Search Market Research Report

Discover Our Latest Reports
Discover Our Featured Reports
Discover Top Selling Reports

Food Traceability (Tracking Technologies) Market Size, Share Global Analysis Report, 2021 - 2026

report img

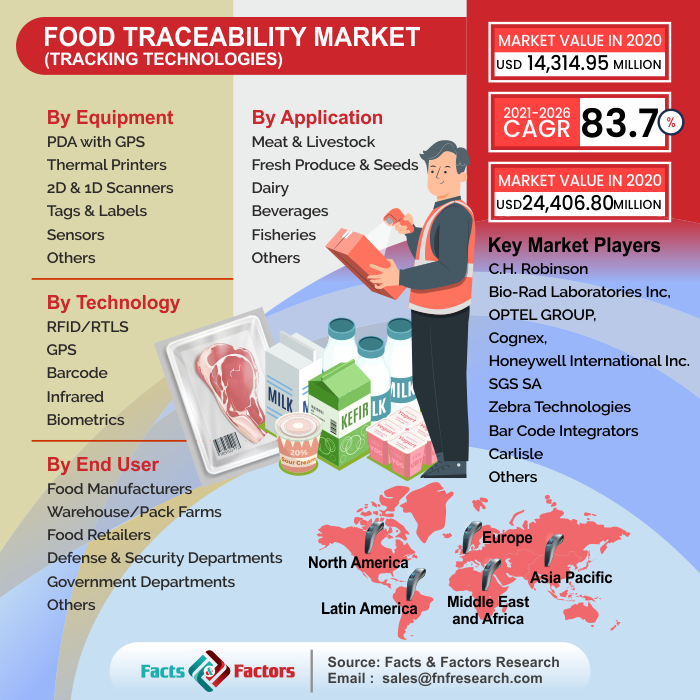
Food Traceability (Tracking Technologies) Market by Equipment (PDA with GPS, Thermal Printers, 2D & 1D Scanners, Tags & Labels, Sensors), Technology (RFID/RTLS, GPS, Barcode, Infrared, and Biometrics), End-User (Food Manufacturers, Warehouse/Pack Farms, Food Retailers, Defense & Security Departments, Other Government Departments, and Others) and Application (Meat & Livestock, Fresh Produce & Seeds, Dairy, Beverages, Fisheries, and Others): Global & Regional Opportunity Analysis and Industry Forecast 2021 - 2026

Industry Insights

[197+ Pages Report] According to Facts and Factors Research, the global food traceability market was valued at around USD 14,314.95 Million in the year 2020 and is expected to generate about USD 24,406.80 Million by the end of 2026, with a CAGR of approximately 9.3% between 2021 and 2026.

logoGlobal Food Traceability Market: Overview       

The purpose is to identify and evaluate various stages of the food chain from production to distribution is referred to as food traceability (tracking technologies). It entails identifying the source of food as well as its final destination, from whence it is intended to be dispersed to various end-users. Because multi-ingredient food contains elements from a range of fast-food chains and regions, this method is necessary for food research and is essential in the global food trade. As a result, importers are reliant on the traceability systems of other countries until they reach the point of import. Meat and cattle, fresh produce and seeds, dairy, drinks, fisheries, and others are the key uses of the food safety market. PDAs with thermal printers, GPS, 2D & 1D scanner, tags & labels, sensors, and other items are among the various equipment’s used to support the system.

Food Traceability Market

To know more about this report | Request Free Sample Copy

Food traceability refers to the tracking and monitoring of food goods as they travel to their final destination, whether it's a customer or a store. The technology employed in this procedure tracks the exact location of the food, avoiding tainted or discarded food from being mixed in with the edible food. In the food traceability market, there are a variety of technologies with various applications that focus on enabling quick and effective corrective steps if something goes wrong, hence preventing tainted food from reaching customers.

Internal traceability and chain traceability are the two types of traceability systems. Internal traceability refers to data that is recorded within an organisation or at a different geographic location. Data is recorded and transferred along a supply chain between Intra and inter organisations, which is referred to as chain traceability. Traceability data can be static or dynamic, depending on the type of business. Static data does not change over time, whereas dynamic data does. The use of software such as Enterprise Resource Planning (ERP) and database management systems, cloud computing, and SaaS (software as a service) solutions to gather, record, store, and distribute traceability data efficiently is expected to result in lower costs and more cost-effective operations.

With the use of a tag that identifies and tracks food goods using radio waves, radio frequency identification technology (RFID) is utilised to track real-time information. RFID technology is beneficial since it tracks data and complex characteristics like temperature, air pressure, and humidity. It also has an advantage over its competitors in that it does not require user-initiated, line-of-sight activities, and it is capable of simultaneously reading and writing hundreds of tags, lowering labour resources and expenses. RFID enables businesses to capture data with the fewest possible errors.

logoGlobal Food Traceability Market: Growth Factors

The technologically sophisticated countries, such as the United States, Japan, the United Kingdom, and others, are majorly driving the food traceability technology industry. End-users from developing countries are adopting the technology as a result of increased awareness. Furthermore, organisations now maintain a solid business framework for optimal inventory levels and seamless operations, increasing demand for food traceability technologies around the world.

The primary factors for the global food traceability market growth are the legislative framework and certifications and standardizations. This is owing to various governments in developed and developing countries being forced to obey food safety regulations and legislation, which further supports market expansion. Competitive advantage and brand loyalty, tracing contamination and product recall, and information flow upstream and downstream of the supply chain are all aspects that drive the market.

According to the World Health Organization, contaminated food causes about 600 million cases of foodborne disease worldwide each year. As a result of such incidents, food safety has become a major concern, posing serious health risks. This is expected to increase demand for food traceability, favourably boosting the market growth.

Food processing operations have increased tremendously in prominence over the past 3 decades, choiring a significant amount of food handling. Of this has manifested in a rise in the number of individuals food handling, as well as other developments such as new methods of producing and distributing food, which has increased the risk of foodborne infection transfer from handlers to consumers, boosting the need for food traceability systems.

logoGlobal Food Traceability Market: Segmentation

The food traceability market is segmented based on by equipment, technology, end-user and application:

As per equipment (PDA with GPS, thermal printers, 2d & 1d scanners, tags & labels, sensors), technology (RFID/RTLS, GPS, barcode, infrared, and biometrics), end-user (food manufacturers, warehouse/pack farms, food retailers, defence & security departments, other government departments, and others) and application (meat & livestock, fresh produce & seeds, dairy, beverages, fisheries and others).

logoReport Scope

Report Attribute

Details

Market Size in 2020

USD 14,314.95 Million

Projected Market Size in 2026

USD 24,406.80 Million

CAGR Growth Rate

9.3% CAGR

Base Year

2020

Forecast Years

2021-2026

Key Market Players

C.H. Robinson, Bio-Rad Laboratories Inc, OPTEL GROUP, Cognex, Honeywell International Inc., SGS SA, Zebra Technologies, Bar Code Integrators, Carlisle, Merit-Trax, FoodLogiq, Safe Traces, Food Forensics, Bext360, rfxcel, Covectra, SMAG, TE-Food, Mass Group, Source Trace, Trace One, Crest Solutions, Traceall Global, VeeMee and among others.

Key Segment

By Equipment, Technology, Application, End User, and Region

Major Regions Covered

North America, Europe, Asia Pacific, Latin America, and the Middle East & Africa

Purchase Options

Request customized purchase options to meet your research needs.Explore purchase options

logoGlobal Food Traceability Market: Regional Analysis

Due to early implementation by business experts and government regulations promoting food traceability in these nations, the food traceability market is well established in developed countries such as the United States, the United Kingdom, Japan, Australia, and others. Food can now be obtained from anywhere in the world, posing a significant traceability difficulty. Due to increased awareness and knowledge among the general population, as well as improvements in people's lifestyles, advanced economies such as India, China, Korea, and others are in the process of adopting strict traceability systems, resulting in the rapid growth of the food traceability market in Asia-Pacific.

Because of the quick shift in the population's consumption habits as a result of increased awareness about healthy food and beverages, Asia-Pacific is predicted to grow at a substantial rate from 2021 to 2028. Furthermore, due to the significant need for food traceability in growing countries, North America leads the way in food traceability.

logoGlobal Food Traceability Market: Covid-19 Analysis

Due to the emergence of COVID-19, the Food Traceability Market will expand at a negative rate from 2020 to 2026. This is an excellent opportunity to distinguish truth from fiction and purposeful emotion, as well as to supply decision-makers with reliable data and experience. The COVID-19 pandemic however has put unprecedented strains on food supply networks, resulting in bottlenecks in farm labour, processing, transportation, and logistics, as well as significant demand fluctuations. The majority of these snarls are the consequence of policies enacted to stop the virus from spreading.

In the face of these challenges, food supply chains have shown amazing resilience. As stockpiling behaviour faded and supply networks adjusted to growing demand, grocery store shelves were restocked over time. Long lineups at the border dwindled swiftly as a result of efforts aimed at removing superfluous barriers. While the effects of COVID-19 are still being felt, experience has demonstrated the need for an open and predictable international commerce environment in ensuring that food can reach those who need it. The greatest threat to food security is not a lack of food, but rather a lack of access to food by consumers: safety nets are required to avoid an increase in hunger and food insecurity.

logoGlobal Food Traceability Market: Competitive Players

Some of the essential players operating in the food traceability market are :

  • C.H. Robinson
  • Bio-Rad Laboratories Inc
  • OPTEL GROUP
  • Cognex
  • Honeywell International Inc.
  • SGS SA
  • Zebra Technologies
  • Bar Code Integrators
  • Carlisle
  • Merit-Trax
  • FoodLogiq
  • Safe Traces
  • Food Forensics
  • Bext360
  • rfxcel
  • Covectra
  • SMAG
  • TE-Food
  • Mass Group
  • Source Trace
  • Trace One
  • Crest Solutions
  • Traceall Global
  • VeeMee

logoGlobal Food Traceability Market – By Equipment:

  • PDA with GPS
  • Thermal Printers
  • 2D & 1D Scanners
  • Tags & Labels
  • Sensors
  • Others

logoGlobal Food Traceability Market – By Technology:

  • RFID/RTLS
  • GPS
  • Barcode
  • Infrared
  • Biometrics

logoGlobal Food Traceability Market – By Application:

  • Meat & Livestock
  • Fresh Produce & Seeds
  • Dairy
  • Beverages
  • Fisheries
  • Others

logoGlobal Food Traceability Market – By End User:

  • Food Manufacturers
  • Warehouse/Pack Farms
  • Food Retailers
  • Defense & Security Departments
  • Government Departments
  • Others

logoGlobal Food Traceability Market – By Region:

  • North America
  • U.S.
  • Canada
  • Mexico
  • Europe
  • France
  • UK
  • Germany
  • Italy
  • Spain
  • Rest of Europe
  • Asia Pacific
  • China
  • India
  • Japan
  • Australia
  • South Korea
  • Rest of APAC
  • LAMEA
  • Brazil
  • South Africa
  • Saudi Arabia
  • Turkey
  • Rest of LAMEA

Table of Content

  1. Chapter 1 Executive Summary
    1. 1.1. Introduction of Food Traceability
    2. 1.2. Global Food Traceability Market, 2020 & 2026 (USD Million)
    3. 1.3. Global Food Traceability Market, 2016 – 2026 (USD Million)
    4. 1.4. Global Food Traceability Market Absolute Revenue Opportunity, 2016 – 2026 (USD Million)
    5. 1.5. Global Food Traceability Market Incremental Revenue Opportunity, 2020 – 2026 (USD Million)
  2. Chapter 2 Food Traceability Market – Sales Channel Analysis
    1. 2.1. Global Food Traceability Market – Sales Channel Overview
    2. 2.2. Global Food Traceability Market Share, by Sales Channel, 2020 & 2026 (USD Million)
    3. 2.3. Premium Food Service
      1. 2.3.1. Global Premium Food Service Food Traceability Market, 2016 – 2026 (USD Million)
      2. 2.3.2. Global Premium Food Service Food Traceability Market, 2016 – 2026 (Kilo Tons)
    4. 2.4. Non Premium Food Service
      1. 2.4.1. Global Non Premium Food Service Food Traceability Market, 2016 – 2026 (USD Million)
      2. 2.4.2. Global Non Premium Food Service Food Traceability Market, 2016 – 2026 (Kilo Tons)
    5. 2.5. B2B
      1. 2.5.1. Global B2B Food Traceability Market, 2016 – 2026 (USD Million)
      2. 2.5.2. Global B2B Food Traceability Market, 2016 – 2026 (Kilo Tons)
  3. Chapter 3 Food Traceability Market – Application Analysis
    1. 3.1. Global Food Traceability Market – Application Overview
    2. 3.2. Global Food Traceability Market Share, by Application, 2020 & 2026 (USD Million)
    3. 3.3. Global Food Traceability Market Share, by Application, 2020 & 2026 (Kilo Tons)
    4. 3.4. Savory
      1. 3.4.1. Global Savory Food Traceability Market, 2016 – 2026 (USD Million)
      2. 3.4.2. Global Savory Food Traceability Market, 2016 – 2026 (Kilo Tons)
    5. 3.5. Sandwich
      1. 3.5.1. Global Sandwich Food Traceability Market, 2016 – 2026 (USD Million)
      2. 3.5.2. Global Sandwich Food Traceability Market, 2016 – 2026 (Kilo Tons)
    6. 3.6. Salad Dressings & Dip
      1. 3.6.1. Global Salad Dressings & Dip Food Traceability Market, 2016 – 2026 (USD Million)
      2. 3.6.2. Global Salad Dressings & Dip Food Traceability Market, 2016 – 2026 (Kilo Tons)
    7. 3.7. Baked Goods/Desserts
      1. 3.7.1. Global Baked Goods/Desserts Food Traceability Market, 2016 – 2026 (USD Million)
      2. 3.7.2. Global Baked Goods/Desserts Food Traceability Market, 2016 – 2026 (Kilo Tons)
    8. 3.8. Ice Creams & Smoothies
      1. 3.8.1. Global Ice Creams & Smoothies Food Traceability Market, 2016 – 2026 (USD Million)
      2. 3.8.2. Global Ice Creams & Smoothies Food Traceability Market, 2016 – 2026 (Kilo Tons)
  4. Chapter 4 Food Traceability Market – Regional Analysis
    1. 4.1. Global Food Traceability Market Regional Overview
    2. 4.2. Global Food Traceability Market Share, by Region, 2020 & 2026 (USD Million)
    3. 4.3. Global Food Traceability Market Share, by Region, 2020 & 2026 (Kilo Tons)
    4. 4.4. North America
      1. 4.4.1. North America Food Traceability Market, 2016 – 2026 (USD Million)
        1. 4.4.1.1. North America Food Traceability Market, by Country, 2016 - 2026 (USD Million)
      2. 4.4.2. North America Market, 2016 – 2026 (Kilo Tons)
        1. 4.4.2.1. North America Food Traceability Market, by Country, 2016 - 2026 (Kilo Tons)
      3. 4.4.3. North America Food Traceability Market, by Sales Channel, 2016 – 2026
        1. 4.4.3.1. North America Food Traceability Market, by Sales Channel, 2016 – 2026 (USD Million)
        2. 4.4.3.2. North America Food Traceability Market, by Sales Channel, 2016 – 2026 (Kilo Tons)
      4. 4.4.4. North America Food Traceability Market, by Application, 2016 – 2026
        1. 4.4.4.1. North America Food Traceability Market, by Application, 2016 – 2026 (USD Million)
        2. 4.4.4.2. North America Food Traceability Market, by Application, 2016 – 2026 (Kilo Tons)
      5. 4.4.5. U.S.
        1. 4.4.5.1. U.S. Food Traceability Market, 2016 – 2026 (USD Million)
        2. 4.4.5.2. U.S. Food Traceability Market, 2016 – 2026 (Kilo Tons)
      6. 4.4.6. Canada
        1. 4.4.6.1. Canada Food Traceability Market, 2016 – 2026 (USD Million)
        2. 4.4.6.2. Canada Food Traceability Market, 2016 – 2026 (Kilo Tons)
    5. 4.5. Europe
      1. 4.5.1. Europe Food Traceability Market, 2016 – 2026 (USD Million)
        1. 4.5.1.1. Europe Food Traceability Market, by Country, 2016 - 2026 (USD Million)
      2. 4.5.2. Europe Food Traceability Market, 2016 – 2026 (Kilo Tons)
        1. 4.5.2.1. Europe Food Traceability Market, by Country, 2016 - 2026 (Kilo Tons)
      3. 4.5.3. Europe Food Traceability Market, by Sales Channel, 2016 – 2026
        1. 4.5.3.1. Europe Food Traceability Market, by Sales Channel, 2016 – 2026 (USD Million)
        2. 4.5.3.2. Europe Food Traceability Market, by Sales Channel, 2016 – 2026 (Kilo Tons)
      4. 4.5.4. Europe Food Traceability Market, by Application, 2016 – 2026
        1. 4.5.4.1. Europe Food Traceability Market, by Application, 2016 – 2026 (USD Million)
        2. 4.5.4.2. Europe Food Traceability Market, by Application, 2016 – 2026 (Kilo Tons)
      5. 4.5.5. Germany
        1. 4.5.5.1. Germany Food Traceability Market, 2016 – 2026 (USD Million)
        2. 4.5.5.2. Germany Food Traceability Market, 2016 – 2026 (Kilo Tons)
      6. 4.5.6. France
        1. 4.5.6.1. France Food Traceability Market, 2016 – 2026 (USD Million)
        2. 4.5.6.2. France Food Traceability Market, 2016 – 2026 (Kilo Tons)
      7. 4.5.7. U.K.
        1. 4.5.7.1. U.K. Food Traceability Market, 2016 – 2026 (USD Million)
        2. 4.5.7.2. U.K. Food Traceability Market, 2016 – 2026 (Kilo Tons)
      8. 4.5.8. Italy
        1. 4.5.8.1. Italy Food Traceability Market, 2016 – 2026 (USD Million)
        2. 4.5.8.2. Italy Food Traceability Market, 2016 – 2026 (Kilo Tons)
      9. 4.5.9. Spain
        1. 4.5.9.1. Spain Food Traceability Market, 2016 – 2026 (USD Million)
        2. 4.5.9.2. Spain Food Traceability Market, 2016 – 2026 (Kilo Tons)
      10. 4.5.10. Rest of Europe
        1. 4.5.10.1. Rest of Europe Food Traceability Market, 2016 – 2026 (USD Million)
        2. 4.5.10.2. Rest of Europe Food Traceability Market, 2016 – 2026 (Kilo Tons)
    6. 4.6. Asia Pacific
      1. 4.6.1. Asia Pacific Food Traceability Market, 2016 – 2026 (USD Million)
        1. 4.6.1.1. Asia Pacific Food Traceability Market, by Country, 2016 - 2026 (USD Million)
      2. 4.6.2. Asia Pacific Food Traceability Market, 2016 – 2026 (Kilo Tons)
        1. 4.6.2.1. Asia Pacific Food Traceability Market, by Country, 2016 - 2026 (Kilo Tons)
      3. 4.6.3. Asia Pacific Food Traceability Market, by Sales Channel, 2016 – 2026
        1. 4.6.3.1. Asia Pacific Food Traceability Market, by Sales Channel, 2016 – 2026 (USD Million)
        2. 4.6.3.2. Asia Pacific Food Traceability Market, by Sales Channel, 2016 – 2026 (Kilo Tons)
      4. 4.6.4. Asia Pacific Food Traceability Market, by Application, 2016 – 2026
        1. 4.6.4.1. Asia Pacific Food Traceability Market, by Application, 2016 – 2026 (USD Million)
        2. 4.6.4.2. Asia Pacific Food Traceability Market, by Application, 2016 – 2026 (Kilo Tons)
      5. 4.6.5. China
        1. 4.6.5.1. China Food Traceability Market, 2016 – 2026 (USD Million)
        2. 4.6.5.2. China Food Traceability Market, 2016 – 2026 (Kilo Tons)
      6. 4.6.6. India
        1. 4.6.6.1. India Food Traceability Market, 2016 – 2026 (USD Million)
        2. 4.6.6.2. India Food Traceability Market, 2016 – 2026 (Kilo Tons)
      7. 4.6.7. Japan
        1. 4.6.7.1. Japan Food Traceability Market, 2016 – 2026 (USD Million)
        2. 4.6.7.2. Japan Food Traceability Market, 2016 – 2026 (Kilo Tons)
      8. 4.6.8. South Korea
        1. 4.6.8.1. South Korea Food Traceability Market, 2016 – 2026 (USD Million)
        2. 4.6.8.2. South Korea Food Traceability Market, 2016 – 2026 (Kilo Tons)
      9. 4.6.9. South-East Asia
        1. 4.6.9.1. South-East Asia Food Traceability Market, 2016 – 2026 (USD Million)
        2. 4.6.9.2. South-East Asia Food Traceability Market, 2016 – 2026 (Kilo Tons)
      10. 4.6.10. Rest of Asia Pacific
        1. 4.6.10.1. Rest of Asia Pacific Food Traceability Market, 2016 – 2026 (USD Million)
        2. 4.6.10.2. Rest of Asia Pacific Food Traceability Market, 2016 – 2026 (Kilo Tons)
    7. 4.7. Latin America
      1. 4.7.1. Latin America Food Traceability Market, 2016 – 2026 (USD Million)
        1. 4.7.1.1. Latin America Food Traceability Market, by Country, 2016 - 2026 (USD Million)
      2. 4.7.2. Latin America Food Traceability Market, 2016 – 2026 (Kilo Tons)
        1. 4.7.2.1. Latin America Food Traceability Market, by Country, 2016 - 2026 (Kilo Tons)
      3. 4.7.3. Latin America Food Traceability Market, by Sales Channel, 2016 – 2026
        1. 4.7.3.1. Latin America Food Traceability Market, by Sales Channel, 2016 – 2026 (USD Million)
        2. 4.7.3.2. Latin America Food Traceability Market, by Sales Channel, 2016 – 2026 (Kilo Tons)
      4. 4.7.4. Latin America Food Traceability Market, by Application, 2016 – 2026
        1. 4.7.4.1. Latin America Food Traceability Market, by Application, 2016 – 2026 (USD Million)
        2. 4.7.4.2. Latin America Food Traceability Market, by Application, 2016 – 2026 (Kilo Tons)
      5. 4.7.5. Brazil
        1. 4.7.5.1. Brazil Food Traceability Market, 2016 – 2026 (USD Million)
        2. 4.7.5.2. Brazil Food Traceability Market, 2016 – 2026 (Kilo Tons)
      6. 4.7.6. Mexico
        1. 4.7.6.1. Mexico Food Traceability Market, 2016 – 2026 (USD Million)
        2. 4.7.6.2. Mexico Food Traceability Market, 2016 – 2026 (Kilo Tons)
      7. 4.7.7. Rest of Latin America
        1. 4.7.7.1. Rest of Latin America Food Traceability Market, 2016 – 2026 (USD Million)
        2. 4.7.7.2. Rest of Latin America Food Traceability Market, 2016 – 2026 (Kilo Tons)
    8. 4.8. Middle East & Africa
      1. 4.8.1. Middle East & Africa Food Traceability Market, 2016 – 2026 (USD Million)
        1. 4.8.1.1. Middle East & Africa Food Traceability Market, by Country, 2016 - 2026 (USD Million)
      2. 4.8.2. Middle East & Africa Food Traceability Market, 2016 – 2026 (Kilo Tons)
        1. 4.8.2.1. Middle East & Africa Food Traceability Market, by Country, 2016 - 2026 (Kilo Tons)
      3. 4.8.3. Middle East & Africa Food Traceability Market, by Sales Channel, 2016 – 2026
        1. 4.8.3.1. Middle East & Africa Food Traceability Market, by Sales Channel, 2016 – 2026 (USD Million)
        2. 4.8.3.2. Middle East & Africa Food Traceability Market, by Sales Channel, 2016 – 2026 (Kilo Tons)
      4. 4.8.4. Middle East & Africa Food Traceability Market, by Application, 2016 – 2026
        1. 4.8.4.1. Middle East & Africa Food Traceability Market, by Application, 2016 – 2026 (USD Million)
        2. 4.8.4.2. Middle East & Africa Food Traceability Market, by Application, 2016 – 2026 (Kilo Tons)
      5. 4.8.5. GCC
        1. 4.8.5.1. GCC Food Traceability Market, 2016 – 2026 (USD Million)
        2. 4.8.5.2. GCC Food Traceability Market, 2016 – 2026 (Kilo Tons)
      6. 4.8.6. South Africa
        1. 4.8.6.1. South Africa Food Traceability Market, 2016 – 2026 (USD Million)
        2. 4.8.6.2. South Africa Food Traceability Market, 2016 – 2026 (Kilo Tons)
      7. 4.8.7. Rest of Middle East & Africa
        1. 4.8.7.1. Rest of Middle East & Africa Food Traceability Market, 2016 – 2026 (USD Million)
        2. 4.8.7.2. Rest of Middle East & Africa Food Traceability Market, 2016 – 2026 (Kilo Tons)
  5. Chapter 5 Food Traceability Market – Competitive Landscape
    1. 5.1. Competitor Market Share – Revenue
    2. 5.2. Market Concentration Rate Analysis, Top 3 and Top 5 Players
    3. 5.3. Strategic Developments
      1. 5.3.1. Acquisitions and Mergers
      2. 5.3.2. New Products
      3. 5.3.3. Research & Development Activities
  6. Chapter 6 Company Profiles
    1. 6.1. Daisy Brand LLC
      1. 6.1.1. Company Overview
      2. 6.1.2. Product/Service Portfolio
      3. 6.1.3. Daisy Brand LLC Sales, Revenue, and Gross Margin
      4. 6.1.4. Daisy Brand LLC Revenue and Growth Rate
      5. 6.1.5. Daisy Brand LLC Market Share
      6. 6.1.6. Recent Initiatives, Funding/VC Activities, and Technological Innovations
    2. 6.2. Dean Foods
      1. 6.2.1. Company Overview
      2. 6.2.2. Product/Service Portfolio
      3. 6.2.3. Dean Foods Sales, Revenue, and Gross Margin
      4. 6.2.4. Dean Foods Revenue and Growth Rate
      5. 6.2.5. Dean Foods Market Share
      6. 6.2.6. Recent Initiatives, Funding/VC Activities, and Technological Innovations
    3. 6.3. Land O’ Lakes
      1. 6.3.1. Company Overview
      2. 6.3.2. Product/Service Portfolio
      3. 6.3.3. Land O’ Lakes Sales, Revenue, and Gross Margin
      4. 6.3.4. Land O’ Lakes Revenue and Growth Rate
      5. 6.3.5. Land O’ Lakes Market Share
      6. 6.3.6. Recent Initiatives, Funding/VC Activities, and Technological Innovations
    4. 6.4. Scott Brothers Diary Inc.
      1. 6.4.1. Company Overview
      2. 6.4.2. Product/Service Portfolio
      3. 6.4.3. Scott Brothers Diary Inc. Sales, Revenue, and Gross Margin
      4. 6.4.4. Scott Brothers Diary Inc. Revenue and Growth Rate
      5. 6.4.5. Scott Brothers Diary Inc. Market Share
      6. 6.4.6. Recent Initiatives, Funding/VC Activities, and Technological Innovations
    5. 6.5. Uelzena Ingredients
      1. 6.5.1. Company Overview
      2. 6.5.2. Product/Service Portfolio
      3. 6.5.3. Uelzena Ingredients Sales, Revenue, and Gross Margin
      4. 6.5.4. Uelzena Ingredients Revenue and Growth Rate
      5. 6.5.5. Uelzena Ingredients Market Share
      6. 6.5.6. Recent Initiatives, Funding/VC Activities, and Technological Innovations
    6. 6.6. Compsey Creamery
      1. 6.6.1. Company Overview
      2. 6.6.2. Product/Service Portfolio
      3. 6.6.3. Compsey Creamery Sales, Revenue, and Gross Margin
      4. 6.6.4. Compsey Creamery Revenue and Growth Rate
      5. 6.6.5. Compsey Creamery Market Share
      6. 6.6.6. Recent Initiatives, Funding/VC Activities, and Technological Innovations
    7. 6.7. Prairie Farms Dairy
      1. 6.7.1. Company Overview
      2. 6.7.2. Product/Service Portfolio
      3. 6.7.3. Prairie Farms Dairy Sales, Revenue, and Gross Margin
      4. 6.7.4. Prairie Farms Dairy Revenue and Growth Rate
      5. 6.7.5. Prairie Farms Dairy Market Share
      6. 6.7.6. Recent Initiatives, Funding/VC Activities, and Technological Innovations
    8. 6.8. HP Hood LLC
      1. 6.8.1. Company Overview
      2. 6.8.2. Product/Service Portfolio
      3. 6.8.3. HP Hood LLC Sales, Revenue, and Gross Margin
      4. 6.8.4. HP Hood LLC Revenue and Growth Rate
      5. 6.8.5. HP Hood LLC Market Share
      6. 6.8.6. Recent Initiatives, Funding/VC Activities, and Technological Innovations
    9. 6.9. Cabot Creamery
      1. 6.9.1. Company Overview
      2. 6.9.2. Product/Service Portfolio
      3. 6.9.3. Cabot Creamery Sales, Revenue, and Gross Margin
      4. 6.9.4. Cabot Creamery Revenue and Growth Rate
      5. 6.9.5. Cabot Creamery Market Share
      6. 6.9.6. Recent Initiatives, Funding/VC Activities, and Technological Innovations
    10. 6.10. Barambah Organics Pty Ltd.
      1. 6.10.1. Company Overview
      2. 6.10.2. Product/Service Portfolio
      3. 6.10.3. Barambah Organics Pty Ltd. Sales, Revenue, and Gross Margin
      4. 6.10.4. Barambah Organics Pty Ltd. Revenue and Growth Rate
      5. 6.10.5. Barambah Organics Pty Ltd. Market Share
      6. 6.10.6. Recent Initiatives, Funding/VC Activities, and Technological Innovations
    11. 6.11. Meggle
      1. 6.11.1. Company Overview
      2. 6.11.2. Product/Service Portfolio
      3. 6.11.3. Meggle Sales, Revenue, and Gross Margin
      4. 6.11.4. Meggle Revenue and Growth Rate
      5. 6.11.5. Meggle Market Share
      6. 6.11.6. Recent Initiatives, Funding/VC Activities, and Technological Innovations
  7. Chapter 7 Food Traceability — Industry Analysis
    1. 7.1. Introduction and Taxonomy
    2. 7.2. Food Traceability Market – Key Trends
      1. 7.2.1. Market Drivers
      2. 7.2.2. Market Restraints
      3. 7.2.3. Market Opportunities
    3. 7.3. Value Chain Analysis
    4. 7.4. Key Mandates and Regulations
    5. 7.5. Technology Roadmap and Timeline
    6. 7.6. Food Traceability Market – Attractiveness Analysis
      1. 7.6.1. By Sales Channel
      2. 7.6.2. By Application
      3. 7.6.3. By Region
  8. Chapter 8 Industrial Chain, Sourcing Strategy, and Downstream Buyers
    1. 8.1. Food Traceability Industrial Chain Analysis
    2. 8.2. Downstream Buyers
    3. 8.3. Distributors/Traders List
  9. Chapter 9 Marketing Strategy Analysis
    1. 9.1. Marketing Channel
    2. 9.2. Direct Marketing
    3. 9.3. Indirect Marketing
    4. 9.4. Marketing Channel Development Trends
    5. 9.5. Economic/Political Environmental Change
  10. Chapter 10 Report Conclusion & Key Insights
    1. 10.1. Key Insights from Primary Interviews & Surveys Respondents
    2. 10.2. Key Takeaways from Analysts, Consultants, and Industry Leaders
  11. Chapter 11 Research Approach & Methodology
    1. 11.1. Report Description
    2. 11.2. Research Scope
    3. 11.3. Research Methodology
      1. 11.3.1. Secondary Research
      2. 11.3.2. Primary Research
      3. 11.3.3. Statistical Models
        1. 11.3.3.1. Company Share Analysis Model
        2. 11.3.3.2. Revenue Based Modeling
      4. 11.3.4. Research Limitations

      List of Figures

      Fig.1	Product Picture of Food Traceability
      Fig.2	Global Food Traceability Market, 2016 – 2026 (USD Million)
      Fig.3	Global Food Traceability Market Absolute Revenue Opportunity, 2016 – 2026 (USD Million)
      Fig.4	Global Food Traceability Market Incremental Revenue Opportunity, 2020 – 2026 (USD Million)
      Fig.5	Global Food Traceability Market Share, by Sales Channel, 2020 & 2026 (USD Million)
      Fig.6	Global Premium Food Service Food Traceability Market, 2016 – 2026 (USD Million)
      Fig.7	Global Premium Food Service Food Traceability Market, 2016 – 2026 (Kilo Tons)
      Fig.8	Global Non Premium Food Service Food Traceability Market, 2016 – 2026 (USD Million)
      Fig.9	Global Non Premium Food Service Food Traceability  Market, 2016 – 2026 (Kilo Tons)
      Fig.10	Global B2B Food Traceability Market, 2016 – 2026 (USD Million)
      Fig.11	Global B2B Food Traceability  Market, 2016 – 2026 (Kilo Tons)
      Fig.12	Global Food Traceability Market Share, by Application, 2020 & 2026 (USD Million)
      Fig.13	Global Food Traceability Market Share, by Application, 2020 & 2026 (Kilo Tons)
      Fig.14	Global Savory Food Traceability Market, 2016 – 2026 (USD Million)
      Fig.15	Global Savory Food Traceability  Market, 2016 – 2026 (Kilo Tons)
      Fig.16	Global Sandwich Food Traceability Market, 2016 – 2026 (USD Million)
      Fig.17	Global Sandwich Food Traceability  Market, 2016 – 2026 (Kilo Tons)
      Fig.18	Global Salad Dressings & Dip Food Traceability Market, 2016 – 2026 (USD Million)
      Fig.19	Global Salad Dressings & Dip Food Traceability  Market, 2016 – 2026 (Kilo Tons)
      Fig.20	Global Baked Goods/Desserts Food Traceability Market, 2016 – 2026 (USD Million)
      Fig.21	Global Baked Goods/Desserts Food Traceability  Market, 2016 – 2026 (Kilo Tons)
      Fig.22	Global Ice Creams & Smoothies Food Traceability Market, 2016 – 2026 (USD Million)
      Fig.23	Global Ice Creams & Smoothies Food Traceability  Market, 2016 – 2026 (Kilo Tons)
      Fig.24	Global Food Traceability Market Share, by Region, 2020 & 2026 (USD Million)
      Fig.25	Global Food Traceability Market Share, by Region, 2020 & 2026 (Kilo Tons)
      Fig.26	North America Food Traceability Market, 2016 – 2026 (USD Million)
      Fig.27	North America Food Traceability Market, 2016 – 2026 (Kilo Tons)
      Fig.28	U.S. Food Traceability Market, 2016 – 2026 (USD Million)
      Fig.29	U.S. Food Traceability  Market, 2016 – 2026 (Kilo Tons)
      Fig.30	Canada Food Traceability Market, 2016 – 2026 (USD Million)
      Fig.31	Canada Food Traceability  Market, 2016 – 2026 (Kilo Tons)
      Fig.32	Europe Food Traceability Market, 2016 – 2026 (USD Million)
      Fig.33	Europe Food Traceability  Market, 2016 – 2026 (Kilo Tons)
      Fig.34	Germany Food Traceability Market, 2016 – 2026 (USD Million)
      Fig.35	Germany Food Traceability  Market, 2016 – 2026 (Kilo Tons)
      Fig.36	France Food Traceability Market, 2016 – 2026 (USD Million)
      Fig.37	France Food Traceability  Market, 2016 – 2026 (Kilo Tons)
      Fig.38	U.K. Food Traceability Market, 2016 – 2026 (USD Million)
      Fig.39	U.K. Food Traceability  Market, 2016 – 2026 (Kilo Tons)
      Fig.40	Italy Food Traceability Market, 2016 – 2026 (USD Million)
      Fig.41	Italy Food Traceability  Market, 2016 – 2026 (Kilo Tons)
      Fig.42	Spain Food Traceability Market, 2016 – 2026 (USD Million)
      Fig.43	Spain Food Traceability  Market, 2016 – 2026 (Kilo Tons)
      Fig.44	Rest of Europe Food Traceability Market, 2016 – 2026 (USD Million)
      Fig.45	Rest of Europe Food Traceability  Market, 2016 – 2026 (Kilo Tons)
      Fig.46	Asia Pacific Food Traceability Market, 2016 – 2026 (USD Million)
      Fig.47	Asia Pacific Food Traceability  Market, 2016 – 2026 (Kilo Tons)
      Fig.48	China Food Traceability Market, 2016 – 2026 (USD Million)
      Fig.49	China Food Traceability  Market, 2016 – 2026 (Kilo Tons)
      Fig.50	India Food Traceability Market, 2016-2026 (USD Million)
      Fig.51	India Food Traceability  Market, 2016 – 2026 (Kilo Tons)
      Fig.52	Japan Food Traceability Market, 2016 – 2026 (USD Million)
      Fig.53	Japan Food Traceability  Market, 2016 – 2026 (Kilo Tons)
      Fig.54	South Korea Food Traceability Market, 2016 – 2026 (USD Million)
      Fig.55	South Korea Food Traceability  Market, 2016 – 2026 (Kilo Tons)
      Fig.56	South-East Asia Food Traceability Market, 2016 – 2026 (USD Million)
      Fig.57	South-East Asia Food Traceability  Market, 2016 – 2026 (Kilo Tons)
      Fig.58	Rest of Asia Pacific Food Traceability Market, 2016 – 2026 (USD Million)
      Fig.59	Rest of Asia Pacific Food Traceability  Market, 2016 – 2026 (Kilo Tons)
      Fig.60	Latin America Food Traceability Market, 2016 – 2026 (USD Million)
      Fig.61	Latin America Food Traceability  Market, 2016 – 2026 (Kilo Tons)
      Fig.62	Brazil Food Traceability Market, 2016 – 2026 (USD Million)
      Fig.63	Brazil Food Traceability  Market, 2016 – 2026 (Kilo Tons)
      Fig.64	Mexico Food Traceability Market, 2016 – 2026 (USD Million)
      Fig.65	Mexico Food Traceability  Market, 2016 – 2026 (Kilo Tons)
      Fig.66	Rest of Latin America Food Traceability Market, 2016 – 2026 (USD Million)
      Fig.67	Rest of Latin America Food Traceability  Market, 2016 – 2026 (Kilo Tons)
      Fig.68	Middle East & Africa Food Traceability Market, 2016 – 2026 (USD Million)
      Fig.69	Middle East & Africa Food Traceability  Market, 2016 – 2026 (Kilo Tons)
      Fig.70	GCC Food Traceability Market, 2016 – 2026 (USD Million)
      Fig.71	GCC Food Traceability Market, 2016 – 2026 (Kilo Tons)
      Fig.72	South Africa Food Traceability Market, 2016 – 2026 (USD Million)
      Fig.73	South Africa Food Traceability  Market, 2016 – 2026 (Kilo Tons)
      Fig.74	Rest of Middle East & Africa Food Traceability Market, 2016 – 2026 (USD Million)
      Fig.75	Rest of Middle East & Africa Food Traceability Market, 2016 – 2026 (Kilo Tons)
      Fig.76	Competitor Market Share – Revenue
      Fig.77	Daisy Brand LLC Revenue and Growth Rate
      Fig.78	Daisy Brand LLC Market Share
      Fig.79	Market Dynamics
      Fig.80	Global Food Traceability – Value Chain Analysis
      Fig.81	Key Mandates and Regulations
      Fig.82	Technology Roadmap and Timeline
      Fig.83	Market Attractiveness Analysis – By Sales Channel
      Fig.84	Market Attractiveness Analysis – By Application
      Fig.85	Market Attractiveness Analysis – By Region
      Fig.86	Food Traceability Industrial Chain Analysis
      Fig.87	Market Channels
      Fig.88	Marketing Channel Development Trend
      Fig.89	Growth in World Gross Product, 2008-2018
      

      List of Tables

      	
      Table 1	Global Food Traceability Market, 2020 & 2026 (USD Million)
      Table 2	Global Food Traceability Market, by Sales Channel, 2016 – 2026 (USD Million)
      Table 3	Global Food Traceability Market, by Application, 2016 – 2026 (USD Million)
      Table 4	Global Food Traceability Market, by Application, 2016 – 2026 (Kilo Tons)
      Table 5	Global Food Traceability Market, by Region, 2016 – 2026 (USD Million)
      Table 6	Global Food Traceability Market, by Region, 2016 – 2026 (Kilo Tons)
      Table 7	North America Food Traceability Market, by Country, 2016 – 2026 (USD Million)
      Table 8	North America Food Traceability Market, by Country, 2016 – 2026 (Kilo Tons)
      Table 9 North America Food Traceability Market, by Sales Channel, 2016 – 2026 (USD Million)
      Table 10 North America Food Traceability Market, by Sales Channel, 2016 – 2026 (Kilo Tons)
      Table 11 North America Food Traceability Market, by Application, 2016 – 2026 (USD Million)
      Table 12 North America Food Traceability Market, by Application, 2016 – 2026 (Kilo Tons)
      Table 13 Europe Food Traceability Market, by Country, 2016 – 2026 (USD Million)
      Table 14 Europe Food Traceability Market, by Country, 2016 – 2026 (Kilo Tons)
      Table 15 Europe Food Traceability Market, by Sales Channel, 2016 – 2026 (USD Million)
      Table 16 Europe Food Traceability Market, by Sales Channel, 2016 – 2026 (Kilo Tons)
      Table 17 Europe Food Traceability Market, by Application, 2016 – 2026 (USD Million)
      Table 18 Europe Food Traceability Market, by Application, 2016 – 2026 (Kilo Tons)
      Table 19 Asia Pacific Food Traceability Market, by Country, 2016 – 2026 (USD Million)
      Table 20 Europe Food Traceability Market, by Country, 2016 – 2026 (Kilo Tons)
      Table 21 Asia Pacific Food Traceability Market, by Sales Channel, 2016 – 2026 (USD Million)
      Table 22 Asia Pacific Food Traceability Market, by Sales Channel, 2016 – 2026 (Kilo Tons)
      Table 23 Asia Pacific Food Traceability Market, by Application (Recipes), 2016 – 2026 (USD Million)
      Table 24 Asia Pacific Food Traceability Market, by Application, 2016 – 2026 (Kilo Tons)
      Table 25 Latin America Food Traceability Market, by Country, 2016 – 2026 (USD Million)
      Table 26 Latin America Food Traceability Market, by Country, 2016 – 2026 (Kilo Tons)
      Table 27 Latin America Food Traceability Market, by Sales Channel, 2016 – 2026 (USD Million)
      Table 28 Latin America Food Traceability Market, by Sales Channel, 2016 – 2026 (Kilo Tons)
      Table 29 Latin America Food Traceability Market, by Application, 2016 – 2026 (USD Million)
      Table 30 Latin America Food Traceability Market, by Application, 2016 – 2026 (Kilo Tons)
      Table 31 Middle East & Africa Food Traceability Market, by Country, 2016 – 2026 (USD Million)
      Table 32 Middle East & Africa Food Traceability Market, by Country, 2016 – 2026 (Kilo Tons)
      Table 33 Middle East & Africa Food Traceability Market, by Sales Channel, 2016 – 2026 (USD Million)
      Table 34 Middle East & Africa Food Traceability Market, by Sales Channel, 2016 – 2026 (Kilo Tons)
      Table 35 Middle East & Africa Food Traceability Market, by Application, 2016 – 2026 (USD Million)
      Table 36 Middle East & Africa Food Traceability Market, by Application, 2016 – 2026 (Kilo Tons)
      Table 37 Global Food Traceability Market - Company Revenue Analysis, 2016 – 2019 (USD Million)
      Table 38 Global Food Traceability Market - Company Revenue Share Analysis, 2016 – 2019 (%)
      Table 39 Acquisitions and Mergers
      Table 40 Market Drivers – Impact Analysis
      Table 41 Market Restraints
      Table 42 Market Opportunities
      Table 43 Major Buyers of Food Traceability
      Table 44 Distributors/Traders of Food Traceability by Region
      

Industry Major Market Players

  • C.H. Robinson
  • Bio-Rad Laboratories Inc
  • OPTEL GROUP
  • Cognex
  • Honeywell International Inc.
  • SGS SA
  • Zebra Technologies
  • Bar Code Integrators
  • Carlisle
  • Merit-Trax
  • FoodLogiq
  • Safe Traces
  • Food Forensics
  • Bext360
  • rfxcel
  • Covectra
  • SMAG
  • TE-Food
  • Mass Group
  • Source Trace
  • Trace One
  • Crest Solutions
  • Traceall Global
  • VeeMee