Search Market Research Report

Discover Our Latest Reports
Discover Our Featured Reports
Discover Top Selling Reports

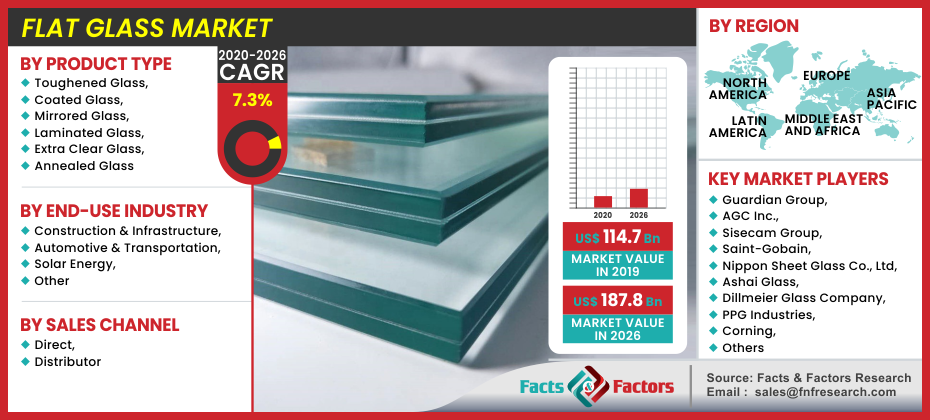
Flat Glass Market Size, Share Global Analysis Report, , 2020 – 2026

report img

Flat Glass Market By Product Type (Toughened Glass, Coated Glass, Mirrored Glass, Laminated Glass, Extra Clear Glass, and Annealed Glass), By End-Use Industry (Construction & Infrastructure, Automotive & Transportation, Solar Energy, and Other), By Sales Channel (Direct, and Distributor) and By Region: Global Industry Perspective, Comprehensive Analysis, and Forecast, 2020 – 2026

Industry Insights

[225+ Pages Report] As per the market research report published by Facts and Factors, the global flat glass market was valued at approximately USD 114.7 Billion in 2019, and is expected to generate revenue of around USD 187.8 Billion by end of 2026, growing at a CAGR of around 7.3% between 2020 and 2026.

logoMarket Overview      

Flat glasses are the glasses that are used in automotive doors, windows, solar panels, and transparent walls. Sand and other materials are melted into a liquid to create the glass. By varying the concentrations of limestone, dolomite, and sodium sulfate, it can be tailored to a variety of applications. It's commonly used indoors, windows, solar cells, chairs, tabletops, cabinet closures, and walls in the infrastructure sector. Additionally, it is often used as windshields and mirrors, and it is easily bent and reused in the auto industry. It is environmentally friendly and manufactured from renewable raw materials, resulting in a high level of light transmission and chemical inertness. Furthermore, the market is expected to grow as a result of environmental concerns about waste management, as well as the recyclability of glass, which encourages its use in a variety of end-use applications.

logoIndustry Growth Factors

Flat glass demand could be driven by rising disposable incomes and increased production of automobiles. It is made of vacuum insulated glass, which guarantees thermal and acoustic insulation. The market will grow due to increased demand for rooftops for aesthetic reasons and insulated glass in luxury windows cars. In the auto sector, flat glass is commonly used in the windshield, mirrors, and backlight. Flat glass demand growth could be aided by increasing use in luxury car roofs and laminated windows for superior aesthetics, as well as consumer spending in the automotive sector. Due to large-scale automotive production, technological market innovations, and demand for lightweight vehicles, industry demand will see substantial growth. Advances in the chemical industry have also aided in increasing demand for flat glass around the world. Manufacturers have devised new methods for creating flat glass, which has aided in the speeding up of production. The ability to meet the high demand for flat glass would be a leading indicator of market maturity. The willingness of the leading vendors in the global flat glass market to reach out to new and uncharted territories will be crucial. Marketing tricks have been critical in boosting the market's development dynamics.

Flat Glass Market

To know more about this report | Request Free Sample Copy

logoSegmentation Analysis

The global flat glass market is segregated into product type, end-use industry, sales channel, and regions.  The product type category is segmented into toughened glass, coated glass, mirrored glass, laminated glass, extra clear glass, and annealed glass. Laminated glass has accounted for the major market share.  Since it has improved UV filtration and decreases inherent visual distortion, laminated flat glass is commonly used in commercial and residential applications. The market for laminated flat glass improves protection as it is higher in strength and durable PVB interlayering. Because of the growing trend of replacing brick and granite building exteriors with laminated flat glass, the market will expand. It is difficult to crack, and it provides safe from break-in attempts, car accidents, and extreme weather. It is often used in offices to relieve tension because it allows natural daylight to enter and improves lighting conditions. Based on the end-use industry, the market has been categorized into construction & infrastructure, automotive & transportation, solar energy, and others. In terms of sales channel, the industry has been bifurcated into direct, and distributor.

logoReport Scope

Report Attribute

Details

Market Size in 2019

USD 114.7 Billion

Projected Market Size in 2026

USD 187.8 Billion

CAGR Growth Rate

7.3% CAGR

Base Year

2019

Forecast Years

2020-2026

Key Market Players

Guardian Group, AGC Inc., Sisecam Group, Saint-Gobain, Nippon Sheet Glass Co., Ltd, Ashai Glass, Dillmeier Glass Company, PPG Industries, Corning, Xinyi Glass Holdings Limited, Cardinal Glass Industries, Taiwan Glass Industry Corporation, Central Glass, Fuyao Glass Industry Group, Vitro, S.A.B. De C.V., and CSG Holding Co., Ltd. amongst others.

Key Segment

By Product, End Use, Sales Channel, and Region

Major Regions Covered

North America, Europe, Asia Pacific, Latin America, and the Middle East & Africa

Purchase Options

Request customized purchase options to meet your research needs.Explore purchase options

logo Regional Analysis

Due to the growing construction market in developing countries such as China, India, and other ASEAN countries, Asia-Pacific is expected to register the highest growth.  In China, the construction industry developed at a high rate in 2019, but at a slower rate than in 2018. Even the other sectors, such as automotive and electronics, suffered from the US-China trade war, the residential construction sector aided the country's economic development. Furthermore, millennials account for more than half of the productive population in Indonesia. Housing demand has risen in tandem with the country's growing young population. The construction of housing units has increased in the country in order to meet the rising demand for affordable housing. All of the aforementioned factors are expected to boost the residential sector's growth, which, in turn, will propel the flat glass market due to its numerous advantages. Moreover, owing to growing environmental concerns about CO2 emissions and high energy use, the European region is expected to see substantial market growth. Because of their ability to transmit natural light and solar radiation, flat glass products have energy-efficient solutions. Furthermore, increased advances in coated glass technology would raise market share.

logo Competitive Players

Some main participants of the global Flat Glass market are :

  • Guardian Group
  • AGC Inc.
  • Sisecam Group
  • Saint-Gobain
  • Nippon Sheet Glass Co. Ltd
  • Ashai Glass
  • Dillmeier Glass Company
  • PPG industries
  • Corning
  • Xinyi Glass Holdings Limited
  • Cardinal Glass Industries
  • Taiwan Glass Industry Corporation
  • Central Glass
  • Fuyao Glass Industry Group
  • Vitro
  • S.A.B. De C.V.
  • CSG Holding Co. Ltd.

logoFlat Glass Market: Regional Segment Analysis

  • North America
    • U.S.
    • Canada
  • Europe
    • UK
    • France
    • Germany
    • Italy
    • Spain
    • Rest of Europe
  • Asia Pacific
    • China
    • Japan
    • India
    • South Korea
    • Southeast Asia
    • Rest of Asia Pacific
  • Latin America
    • Brazil
    • Mexico
    • Rest of Latin America
  • Middle East and Africa
    • GCC Countries
    • South Africa
    • Rest of MEA

Table of Content

  1. Chapter 1 Executive Summary
    1. 1.1. Introduction of Flat Glass
    2. 1.2. Global Flat Glass Market, 2019 & 2026 (USD Million)
    3. 1.3. Global Flat Glass Market, 2016 – 2026 (USD Million)
    4. 1.4. Global Flat Glass Market Absolute Revenue Opportunity, 2016 – 2026 (USD Million)
    5. 1.5. Global Flat Glass Market Incremental Revenue Opportunity, 2020 – 2026 (USD Million)
  2. Chapter 2 Flat Glass Market – Product Type Analysis
    1. 2.1. Global Flat Glass Market – Product Type Overview
    2. 2.2. Global Flat Glass Market Share, by Product Type, 2019 & 2026 (USD Million)
    3. 2.3. Toughened Glass
      1. 2.3.1. Global Toughened Glass Flat Glass Market, 2016 – 2026 (USD Million)
    4. 2.4. Coated Glass
      1. 2.4.1. Global Coated Glass Flat Glass Market, 2016 – 2026 (USD Million)
    5. 2.5. Mirrored Glass
      1. 2.5.1. Global Mirrored Glass Flat Glass Market, 2016 – 2026 (USD Million)
    6. 2.6. Laminated Glass
      1. 2.6.1. Global Laminated Glass Flat Glass Market, 2016 – 2026 (USD Million)
    7. 2.7. Extra Clear Glass
      1. 2.7.1. Global Extra Clear Glass Flat Glass Market, 2016 – 2026 (USD Million)
    8. 2.8. Annealed Glass
      1. 2.8.1. Global Annealed Glass Flat Glass Market, 2016 – 2026 (USD Million)
  3. Chapter 3 Flat Glass Market – End-Use Industry Analysis
    1. 3.1. Global Flat Glass Market – End-Use Industry Overview
    2. 3.2. Global Flat Glass Market Share, by End-Use Industry, 2019 & 2026 (USD Million)
    3. 3.3. Construction & Infrastructure
      1. 3.3.1. Global Construction & Infrastructure Flat Glass Market, 2016 – 2026 (USD Million)
    4. 3.4. Automotive & Transportation
      1. 3.4.1. Global Automotive & Transportation Flat Glass Market, 2016 – 2026 (USD Million)
    5. 3.5. Solar Energy
      1. 3.5.1. Global Solar Energy Flat Glass Market, 2016 – 2026 (USD Million)
    6. 3.6. Others
      1. 3.6.1. Global Others Flat Glass Market, 2016 – 2026 (USD Million)
  4. Chapter 4 Flat Glass Market – Sales Channel Analysis
    1. 4.1. Global Flat Glass Market – Sales Channel Overview
    2. 4.2. Global Flat Glass Market Share, by Sales Channel, 2019 & 2026 (USD Million)
    3. 4.3. Direct
      1. 4.3.1. Global Direct Flat Glass Market, 2016 – 2026 (USD Million)
    4. 4.4. Distributor
      1. 4.4.1. Global Distributor Flat Glass Market, 2016 – 2026 (USD Million)
  5. Chapter 5 Flat Glass Market – Regional Analysis
    1. 5.1. Global Flat Glass Market Regional Overview
    2. 5.2. Global Flat Glass Market Share, by Region, 2019 & 2026 (USD Million)
    3. 5.3. North America
      1. 5.3.1. North America Flat Glass Market, 2016 – 2026 (USD Million)
        1. 5.3.1.1. North America Flat Glass Market, by Country, 2016 - 2026 (USD Million)
      2. 5.3.2. North America Flat Glass Market, by Product Type, 2016 – 2026
        1. 5.3.2.1. North America Flat Glass Market, by Product Type, 2016 – 2026 (USD Million)
      3. 5.3.3. North America Flat Glass Market, by End-Use Industry, 2016 – 2026
        1. 5.3.3.1. North America Flat Glass Market, by End-Use Industry, 2016 – 2026 (USD Million)
      4. 5.3.4. North America Flat Glass Market, by Sales Channel, 2016 – 2026
        1. 5.3.4.1. North America Flat Glass Market, by Sales Channel, 2016 – 2026 (USD Million)
      5. 5.3.5. U.S.
        1. 5.3.5.1. U.S. Flat Glass Market, 2016 – 2026 (USD Million)
      6. 5.3.6. Canada
        1. 5.3.6.1. Canada Flat Glass Market, 2016 – 2026 (USD Million)
    4. 5.4. Europe
      1. 5.4.1. Europe Flat Glass Market, 2016 – 2026 (USD Million)
        1. 5.4.1.1. Europe Flat Glass Market, by Country, 2016 - 2026 (USD Million)
      2. 5.4.2. Europe Flat Glass Market, by Product Type, 2016 – 2026
        1. 5.4.2.1. Europe Flat Glass Market, by Product Type, 2016 – 2026 (USD Million)
      3. 5.4.3. Europe Flat Glass Market, by End-Use Industry, 2016 – 2026
        1. 5.4.3.1. Europe Flat Glass Market, by End-Use Industry, 2016 – 2026 (USD Million)
      4. 5.4.4. Europe Flat Glass Market, by Sales Channel, 2016 – 2026
        1. 5.4.4.1. Europe Flat Glass Market, by Sales Channel, 2016 – 2026 (USD Million)
      5. 5.4.5. Germany
        1. 5.4.5.1. Germany Flat Glass Market, 2016 – 2026 (USD Million)
      6. 5.4.6. France
        1. 5.4.6.1. France Flat Glass Market, 2016 – 2026 (USD Million)
      7. 5.4.7. U.K.
        1. 5.4.7.1. U.K. Flat Glass Market, 2016 – 2026 (USD Million)
      8. 5.4.8. Italy
        1. 5.4.8.1. Italy Flat Glass Market, 2016 – 2026 (USD Million)
      9. 5.4.9. Spain
        1. 5.4.9.1. Spain Flat Glass Market, 2016 – 2026 (USD Million)
      10. 5.4.10. Rest of Europe
        1. 5.4.10.1. Rest of Europe Flat Glass Market, 2016 – 2026 (USD Million)
    5. 5.5. Asia Pacific
      1. 5.5.1. Asia Pacific Flat Glass Market, 2016 – 2026 (USD Million)
        1. 5.5.1.1. Asia Pacific Flat Glass Market, by Country, 2016 - 2026 (USD Million)
      2. 5.5.2. Asia Pacific Flat Glass Market, by Product Type, 2016 – 2026
        1. 5.5.2.1. Asia Pacific Flat Glass Market, by Product Type, 2016 – 2026 (USD Million)
      3. 5.5.3. Asia Pacific Flat Glass Market, by End-Use Industry, 2016 – 2026
        1. 5.5.3.1. Asia Pacific Flat Glass Market, by End-Use Industry, 2016 – 2026 (USD Million)
      4. 5.5.4. Asia Pacific Flat Glass Market, by Sales Channel, 2016 – 2026
        1. 5.5.4.1. Asia Pacific Flat Glass Market, by Sales Channel, 2016 – 2026 (USD Million)
      5. 5.5.5. China
        1. 5.5.5.1. China Flat Glass Market, 2016 – 2026 (USD Million)
      6. 5.5.6. Japan
        1. 5.5.6.1. Japan Flat Glass Market, 2016 – 2026 (USD Million)
      7. 5.5.7. India
        1. 5.5.7.1. India Flat Glass Market, 2016 – 2026 (USD Million)
      8. 5.5.8. South Korea
        1. 5.5.8.1. South Korea Flat Glass Market, 2016 – 2026 (USD Million)
      9. 5.5.9. South-East Asia
        1. 5.5.9.1. South-East Asia Flat Glass Market, 2016 – 2026 (USD Million)
      10. 5.5.10. Rest of Asia Pacific
        1. 5.5.10.1. Rest of Asia Pacific Flat Glass Market, 2016 – 2026 (USD Million)
    6. 5.6. Latin America
      1. 5.6.1. Latin America Flat Glass Market, 2016 – 2026 (USD Million)
        1. 5.6.1.1. Latin America Flat Glass Market, by Country, 2016 - 2026 (USD Million)
      2. 5.6.2. Latin America Flat Glass Market, by Product Type, 2016 – 2026
        1. 5.6.2.1. Latin America Flat Glass Market, by Product Type, 2016 – 2026 (USD Million)
      3. 5.6.3. Latin America Flat Glass Market, by End-Use Industry, 2016 – 2026
        1. 5.6.3.1. Latin America Flat Glass Market, by End-Use Industry, 2016 – 2026 (USD Million)
      4. 5.6.4. Latin America Flat Glass Market, by Sales Channel, 2016 – 2026
        1. 5.6.4.1. Latin America Flat Glass Market, by Sales Channel, 2016 – 2026 (USD Million)
      5. 5.6.5. Brazil
        1. 5.6.5.1. Brazil Flat Glass Market, 2016 – 2026 (USD Million)
      6. 5.6.6. Mexico
        1. 5.6.6.1. Mexico Flat Glass Market, 2016 – 2026 (USD Million)
      7. 5.6.7. Rest of Latin America
        1. 5.6.7.1. Rest of Latin America Flat Glass Market, 2016 – 2026 (USD Million)
    7. 5.7. The Middle-East and Africa
      1. 5.7.1. The Middle-East and Africa Flat Glass Market, 2016 – 2026 (USD Million)
        1. 5.7.1.1. The Middle-East and Africa Flat Glass Market, by Country, 2016 - 2026 (USD Million)
      2. 5.7.2. The Middle-East and Africa Flat Glass Market, by Product Type, 2016 – 2026
        1. 5.7.2.1. The Middle-East and Africa Flat Glass Market, by Product Type, 2016 – 2026 (USD Million)
      3. 5.7.3. The Middle-East and Africa Flat Glass Market, by End-Use Industry, 2016 – 2026
        1. 5.7.3.1. The Middle-East and Africa Flat Glass Market, by End-Use Industry, 2016 – 2026 (USD Million)
      4. 5.7.4. The Middle-East and Africa Flat Glass Market, by Sales Channel, 2016 – 2026
        1. 5.7.4.1. The Middle-East and Africa Flat Glass Market, by Sales Channel, 2016 – 2026 (USD Million)
      5. 5.7.5. GCC Countries
        1. 5.7.5.1. GCC Countries Flat Glass Market, 2016 – 2026 (USD Million)
      6. 5.7.6. South Africa
        1. 5.7.6.1. South Africa Flat Glass Market, 2016 – 2026 (USD Million)
      7. 5.7.7. Rest of Middle-East Africa
        1. 5.7.7.1. Rest of Middle-East Africa Flat Glass Market, 2016 – 2026 (USD Million)
  6. Chapter 6 Flat Glass Market – Competitive Landscape
    1. 6.1. Competitor Market Share – Revenue
    2. 6.2. Market Concentration Rate Analysis, Top 3 and Top 5 Players
    3. 6.3. Strategic Developments
      1. 6.3.1. Acquisitions and Mergers
      2. 6.3.2. New Products
      3. 6.3.3. Research & Development Activities
  7. Chapter 7 Company Profiles
    1. 7.1. Guardian Group
      1. 7.1.1. Company Overview
      2. 7.1.2. Product/Service Portfolio
      3. 7.1.3. Guardian Group Sales, Revenue, and Gross Margin
      4. 7.1.4. Guardian Group Revenue and Growth Rate
      5. 7.1.5. Guardian Group Market Share
      6. 7.1.6. Recent Initiatives, Funding/VC Activities, and Technological Innovations
    2. 7.2. AGC Inc.
      1. 7.2.1. Company Overview
      2. 7.2.2. Product/Service Portfolio
      3. 7.2.3. AGC Inc. Sales, Revenue, and Gross Margin
      4. 7.2.4. AGC Inc. Revenue and Growth Rate
      5. 7.2.5. AGC Inc. Market Share
      6. 7.2.6. Recent Initiatives, Funding/VC Activities, and Technological Innovations
    3. 7.3. Sisecam Group
      1. 7.3.1. Company Overview
      2. 7.3.2. Product/Service Portfolio
      3. 7.3.3. Sisecam Group Sales, Revenue, and Gross Margin
      4. 7.3.4. Sisecam Group Revenue and Growth Rate
      5. 7.3.5. Sisecam Group Market Share
      6. 7.3.6. Recent Initiatives, Funding/VC Activities, and Technological Innovations
    4. 7.4. Saint-Gobain
      1. 7.4.1. Company Overview
      2. 7.4.2. Product/Service Portfolio
      3. 7.4.3. Saint-Gobain Sales, Revenue, and Gross Margin
      4. 7.4.4. Saint-Gobain Revenue and Growth Rate
      5. 7.4.5. Saint-Gobain Market Share
      6. 7.4.6. Recent Initiatives, Funding/VC Activities, and Technological Innovations
    5. 7.5. Nippon Sheet Glass Co., Ltd
      1. 7.5.1. Company Overview
      2. 7.5.2. Product/Service Portfolio
      3. 7.5.3. Nippon Sheet Glass Co., Ltd Sales, Revenue, and Gross Margin
      4. 7.5.4. Nippon Sheet Glass Co., Ltd Revenue and Growth Rate
      5. 7.5.5. Nippon Sheet Glass Co., Ltd Market Share
      6. 7.5.6. Recent Initiatives, Funding/VC Activities, and Technological Innovations
    6. 7.6. Ashai Glass
      1. 7.6.1. Company Overview
      2. 7.6.2. Product/Service Portfolio
      3. 7.6.3. Ashai Glass Sales, Revenue, and Gross Margin
      4. 7.6.4. Ashai Glass Revenue and Growth Rate
      5. 7.6.5. Ashai Glass Market Share
      6. 7.6.6. Recent Initiatives, Funding/VC Activities, and Technological Innovations
    7. 7.7. Dillmeier Glass Company
      1. 7.7.1. Company Overview
      2. 7.7.2. Product/Service Portfolio
      3. 7.7.3. Dillmeier Glass Company Sales, Revenue, and Gross Margin
      4. 7.7.4. Dillmeier Glass Company Revenue and Growth Rate
      5. 7.7.5. Dillmeier Glass Company Market Share
      6. 7.7.6. Recent Initiatives, Funding/VC Activities, and Technological Innovations
    8. 7.8. PPG industries
      1. 7.8.1. Company Overview
      2. 7.8.2. Product/Service Portfolio
      3. 7.8.3. PPG industries Sales, Revenue, and Gross Margin
      4. 7.8.4. PPG industries Revenue and Growth Rate
      5. 7.8.5. PPG industries Market Share
      6. 7.8.6. Recent Initiatives, Funding/VC Activities, and Technological Innovations
    9. 7.9. Corning
      1. 7.9.1. Company Overview
      2. 7.9.2. Product/Service Portfolio
      3. 7.9.3. Corning Sales, Revenue, and Gross Margin
      4. 7.9.4. Corning Revenue and Growth Rate
      5. 7.9.5. Corning Market Share
      6. 7.9.6. Recent Initiatives, Funding/VC Activities, and Technological Innovations
    10. 7.10. Xinyi Glass Holdings Limited,
      1. 7.10.1. Company Overview
      2. 7.10.2. Product/Service Portfolio
      3. 7.10.3. Xinyi Glass Holdings Limited, Sales, Revenue, and Gross Margin
      4. 7.10.4. Xinyi Glass Holdings Limited, Revenue and Growth Rate
      5. 7.10.5. Xinyi Glass Holdings Limited, Market Share
      6. 7.10.6. Recent Initiatives, Funding/VC Activities, and Technological Innovations
    11. 7.11. Cardinal Glass Industries
      1. 7.11.1. Company Overview
      2. 7.11.2. Product/Service Portfolio
      3. 7.11.3. Cardinal Glass Industries Sales, Revenue, and Gross Margin
      4. 7.11.4. Cardinal Glass Industries Revenue and Growth Rate
      5. 7.11.5. Cardinal Glass Industries Market Share
      6. 7.11.6. Recent Initiatives, Funding/VC Activities, and Technological Innovations
    12. 7.12. Taiwan Glass Industry Corporation
      1. 7.12.1. Company Overview
      2. 7.12.2. Product/Service Portfolio
      3. 7.12.3. Taiwan Glass Industry Corporation Sales, Revenue, and Gross Margin
      4. 7.12.4. Taiwan Glass Industry Corporation Revenue and Growth Rate
      5. 7.12.5. Taiwan Glass Industry Corporation Market Share
      6. 7.12.6. Recent Initiatives, Funding/VC Activities, and Technological Innovations
    13. 7.13. Central Glass
      1. 7.13.1. Company Overview
      2. 7.13.2. Product/Service Portfolio
      3. 7.13.3. Central Glass Sales, Revenue, and Gross Margin
      4. 7.13.4. Central Glass Revenue and Growth Rate
      5. 7.13.5. Central Glass Market Share
      6. 7.13.6. Recent Initiatives, Funding/VC Activities, and Technological Innovations
    14. 7.14. Fuyao Glass Industry Group
      1. 7.14.1. Company Overview
      2. 7.14.2. Product/Service Portfolio
      3. 7.14.3. Fuyao Glass Industry Group Sales, Revenue, and Gross Margin
      4. 7.14.4. Fuyao Glass Industry Group Revenue and Growth Rate
      5. 7.14.5. Fuyao Glass Industry Group Market Share
      6. 7.14.6. Recent Initiatives, Funding/VC Activities, and Technological Innovations
    15. 7.15. Vitro, S.A.B. De C.V.
      1. 7.15.1. Company Overview
      2. 7.15.2. Product/Service Portfolio
      3. 7.15.3. Vitro, S.A.B. De C.V. Sales, Revenue, and Gross Margin
      4. 7.15.4. Vitro, S.A.B. De C.V. Revenue and Growth Rate
      5. 7.15.5. Vitro, S.A.B. De C.V. Market Share
      6. 7.15.6. Recent Initiatives, Funding/VC Activities, and Technological Innovations
    16. 7.16. CSG Holding Co., Ltd
      1. 7.16.1. Company Overview
      2. 7.16.2. Product/Service Portfolio
      3. 7.16.3. CSG Holding Co., Ltd Sales, Revenue, and Gross Margin
      4. 7.16.4. CSG Holding Co., Ltd Revenue and Growth Rate
      5. 7.16.5. CSG Holding Co., Ltd Market Share
      6. 7.16.6. Recent Initiatives, Funding/VC Activities, and Technological Innovations
  8. Chapter 8 Flat Glass — Industry Analysis
    1. 8.1. Introduction and Taxonomy
    2. 8.2. Flat Glass Market – Key Trends
      1. 8.2.1. Market Drivers
      2. 8.2.2. Market Restraints
      3. 8.2.3. Market Opportunities
    3. 8.3. Value Chain Analysis
    4. 8.4. Key Mandates and Regulations
    5. 8.5. Technology Roadmap and Timeline
    6. 8.6. Flat Glass Market – Attractiveness Analysis
      1. 8.6.1. By Product Type
      2. 8.6.2. By End-Use Industry
      3. 8.6.3. By Sales Channel
      4. 8.6.4. By Region
  9. Chapter 9 Industrial Chain, Sourcing Strategy, and Downstream Buyers
    1. 9.1. Flat Glass Industrial Chain Analysis
    2. 9.2. Downstream Buyers
    3. 9.3. Distributors/Traders List
  10. Chapter 10 Marketing Strategy Analysis
    1. 10.1. Marketing Channel
    2. 10.2. Direct Marketing
    3. 10.3. Indirect Marketing
    4. 10.4. Marketing Channel Development Trends
    5. 10.5. Economic/Political Environmental Change
  11. Chapter 11 Report Conclusion & Key Insights
    1. 11.1. Key Insights from Primary Interviews & Surveys Respondents
    2. 11.2. Key Takeaways from Analysts, Consultants, and Industry Leaders
  12. Chapter 12 Research Approach & Methodology
    1. 12.1. Report Description
    2. 12.2. Research Scope
    3. 12.3. Research Methodology
      1. 12.3.1. Secondary Research
      2. 12.3.2. Primary Research
      3. 12.3.3. Statistical Models
        1. 12.3.3.1. Company Share Analysis Model
        2. 12.3.3.2. Revenue Based Modeling
      4. 12.3.4. Research Limitations

      List of Figures

      Fig.1	Product Picture of Flat Glass
      Fig.2	Global Flat Glass Market, 2016 – 2026 (USD Million)
      Fig.3	Global Flat Glass Market Absolute Revenue Opportunity, 2016 – 2026 (USD Million)
      Fig.4	Global Flat Glass Market Incremental Revenue Opportunity, 2020 – 2026 (USD Million)
      Fig.5	Global Flat Glass Market Share, by Product Type, 2019 & 2026 (USD Million)
      Fig.6	Global Toughened Glass Flat Glass Market, 2016 – 2026 (USD Million)
      Fig.7	Global Coated Glass Flat Glass Market, 2016 – 2026 (USD Million)
      Fig.8	Global Mirrored Glass Flat Glass Market, 2016 – 2026 (USD Million)
      Fig.9	Global Laminated Glass Flat Glass Market, 2016 – 2026 (USD Million)
      Fig.10	Global Extra Clear Glass Flat Glass Market, 2016 – 2026 (USD Million)
      Fig.11	Global Annealed Glass Flat Glass Market, 2016 – 2026 (USD Million)
      Fig.12	Global Flat Glass Market Share, by End-Use Industry, 2019 & 2026 (USD Million)
      Fig.13	Global Construction & Infrastructure Flat Glass Market, 2016 – 2026 (USD Million)
      Fig.14	Global Automotive & Transportation Flat Glass Market, 2016 – 2026 (USD Million)
      Fig.15	Global Solar Energy Flat Glass Market, 2016 – 2026 (USD Million)
      Fig.16	Global Others Flat Glass Market, 2016 – 2026 (USD Million)
      Fig.17	Global Flat Glass Market Share, by Sales Channel, 2019 & 2026 (USD Million)
      Fig.18	Global Direct Flat Glass Market, 2016 – 2026 (USD Million)
      Fig.19	Global Distributor Flat Glass Market, 2016 – 2026 (USD Million)
      Fig.20	Global Flat Glass Market Share, by Region, 2019 & 2026 (USD Million)
      Fig.21	North America Flat Glass Market, 2016 – 2026 (USD Million)
      Fig.22	U.S. Flat Glass Market, 2016 – 2026 (USD Million)
      Fig.23	Canada Flat Glass Market, 2016 – 2026 (USD Million)
      Fig.24	Europe Flat Glass Market, 2016 – 2026 (USD Million)
      Fig.25	Germany Flat Glass Market, 2016 – 2026 (USD Million)
      Fig.26	France Flat Glass Market, 2016 – 2026 (USD Million)
      Fig.27	U.K. Flat Glass Market, 2016 – 2026 (USD Million)
      Fig.28	Italy Flat Glass Market, 2016 – 2026 (USD Million)
      Fig.29	Spain Flat Glass Market, 2016 – 2026 (USD Million)
      Fig.30	Rest of Europe Flat Glass Market, 2016 – 2026 (USD Million)
      Fig.31	Asia Pacific Flat Glass Market, 2016 – 2026 (USD Million)
      Fig.32	China Flat Glass Market, 2016 – 2026 (USD Million)
      Fig.33	Japan Flat Glass Market, 2016 – 2026 (USD Million)
      Fig.34	India Flat Glass Market, 2016 – 2026 (USD Million)
      Fig.35	South  Korea Flat Glass Market, 2016 – 2026 (USD Million)
      Fig.36	South-East Asia Flat Glass Market, 2016 – 2026 (USD Million)
      Fig.37	Rest of Asia Pacific Flat Glass Market, 2016 – 2026 (USD Million)
      Fig.38	Latin America Flat Glass Market, 2016 – 2026 (USD Million)
      Fig.39	Brazil Flat Glass Market, 2016 – 2026 (USD Million)
      Fig.40	Mexico Flat Glass Market, 2016 – 2026 (USD Million)
      Fig.41	Rest of Latin America Flat Glass Market, 2016 – 2026 (USD Million)
      Fig.42	The Middle-East and Africa Flat Glass Market, 2016 – 2026 (USD Million)
      Fig.43	GCC Countries Flat Glass Market, 2016 – 2026 (USD Million)
      Fig.44	South Africa Flat Glass Market, 2016 – 2026 (USD Million)
      Fig.45	Rest of Middle-East Africa Flat Glass Market, 2016 – 2026 (USD Million)
      Fig.46	Competitor Market Share – Revenue
      Fig.47	Guardian Group Revenue and Growth Rate
      Fig.48	Guardian Group Market Share
      Fig.49	AGC Inc. Revenue and Growth Rate
      Fig.50	AGC Inc. Market Share
      Fig.51	Sisecam Group Revenue and Growth Rate
      Fig.52	Sisecam Group Market Share
      Fig.53	Saint-Gobain Revenue and Growth Rate
      Fig.54	Saint-Gobain Market Share
      Fig.55	Nippon Sheet Glass Co., Ltd Revenue and Growth Rate
      Fig.56	Nippon Sheet Glass Co., Ltd Market Share
      Fig.57	Ashai Glass Revenue and Growth Rate
      Fig.58	Ashai Glass Market Share
      Fig.59	Dillmeier Glass Company Revenue and Growth Rate
      Fig.60	Dillmeier Glass Company Market Share
      Fig.61	PPG industries Revenue and Growth Rate
      Fig.62	PPG industries Market Share
      Fig.63	Corning Revenue and Growth Rate
      Fig.64	Corning Market Share
      Fig.65	Xinyi Glass Holdings Limited, Revenue and Growth Rate
      Fig.66	Xinyi Glass Holdings Limited, Market Share
      Fig.67	Cardinal Glass Industries Revenue and Growth Rate
      Fig.68	Cardinal Glass Industries Market Share
      Fig.69	Taiwan Glass Industry Corporation Revenue and Growth Rate
      Fig.70	Taiwan Glass Industry Corporation Market Share
      Fig.71	Central Glass Revenue and Growth Rate
      Fig.72	Central Glass Market Share
      Fig.73	Fuyao Glass Industry Group Revenue and Growth Rate
      Fig.74	Fuyao Glass Industry Group Market Share
      Fig.75	Vitro, S.A.B. De C.V. Revenue and Growth Rate
      Fig.76	Vitro, S.A.B. De C.V. Market Share
      Fig.77	CSG Holding Co., Ltd Revenue and Growth Rate
      Fig.78	CSG Holding Co., Ltd Market Share
      Fig.79	Market Dynamics
      Fig.80	Global Flat Glass – Value Chain Analysis
      Fig.81	Key Mandates and Regulations
      Fig.82	Technology Roadmap and Timeline
      Fig.83	Market Attractiveness Analysis – By Product Type
      Fig.84	Market Attractiveness Analysis – By End-Use Industry
      Fig.85	Market Attractiveness Analysis – By Sales Channel
      Fig.86	Market Attractiveness Analysis – By Region
      Fig.87	Flat Glass Industrial Chain Analysis
      Fig.88	Market Channels
      Fig.89	Marketing Channel Development Trend
      Fig.90	Growth in World Gross Product, 2008-2018
      

      List of Tables

      Table 1	Global Flat Glass Market, 2019 & 2026 (USD Million)
      Table 2	Global Flat Glass Market, by Product Type, 2016 – 2026 (USD Million)
      Table 3	Global Flat Glass Market, by End-Use Industry, 2016 – 2026 (USD Million)
      Table 4	Global Flat Glass Market, by Sales Channel, 2016 – 2026 (USD Million)
      Table 5	Global Flat Glass Market, by Region, 2016 – 2026 (USD Million)
      Table 6	North America Flat Glass Market, by Country, 2016 – 2026 (USD Million)
      Table 7	North America Flat Glass Market, by Product Type, 2016 – 2026 (USD Million)
      Table 8	North America Flat Glass Market, by End-Use Industry, 2016 – 2026 (USD Million)
      Table 9	North America Flat Glass Market, by Sales Channel, 2016 – 2026 (USD Million)
      Table 10 Europe Flat Glass Market, by Country, 2016 – 2026 (USD Million)
      Table 11 Europe Flat Glass Market, by Product Type, 2016 – 2026 (USD Million)
      Table 12 Europe Flat Glass Market, by End-Use Industry, 2016 – 2026 (USD Million)
      Table 13 Europe Flat Glass Market, by Sales Channel, 2016 – 2026 (USD Million)
      Table 14 Asia Pacific Flat Glass Market, by Country, 2016 – 2026 (USD Million)
      Table 15 Asia Pacific Flat Glass Market, by Product Type, 2016 – 2026 (USD Million)
      Table 16 Asia Pacific Flat Glass Market, by End-Use Industry, 2016 – 2026 (USD Million)
      Table 17 Asia Pacific Flat Glass Market, by Sales Channel, 2016 – 2026 (USD Million)
      Table 18 Latin America Flat Glass Market, by Country, 2016 – 2026 (USD Million)
      Table 19 Latin America Flat Glass Market, by Product Type, 2016 – 2026 (USD Million)
      Table 20 Latin America Flat Glass Market, by End-Use Industry, 2016 – 2026 (USD Million)
      Table 21 Latin America Flat Glass Market, by Sales Channel, 2016 – 2026 (USD Million)
      Table 22 The Middle-East and Africa Flat Glass Market, by Country, 2016 – 2026 (USD Million)
      Table 23 The Middle-East and Africa Flat Glass Market, by Product Type, 2016 – 2026 (USD Million)
      Table 24 The Middle-East and Africa Flat Glass Market, by End-Use Industry, 2016 – 2026 (USD Million)
      Table 25 The Middle-East and Africa Flat Glass Market, by Sales Channel, 2016 – 2026 (USD Million)
      Table 26 Global Flat Glass Market - Company Revenue Analysis, 2016 – 2019 (USD Million)
      Table 27 Global Flat Glass Market - Company Revenue Share Analysis, 2016 – 2019 (%)
      Table 28 Acquisitions and Mergers
      Table 29 Market Drivers – Impact Analysis
      Table 30 Market Restraints
      Table 31 Market Opportunities
      Table 32 Major Buyers of Flat Glass
      Table 33 Distributors/Traders of Flat Glass by Region
      

Industry Major Market Players

  • Guardian Group
  • AGC Inc.
  • Sisecam Group
  • Saint-Gobain
  • Nippon Sheet Glass Co. Ltd
  • Ashai Glass
  • Dillmeier Glass Company
  • PPG industries
  • Corning
  • Xinyi Glass Holdings Limited
  • Cardinal Glass Industries
  • Taiwan Glass Industry Corporation
  • Central Glass
  • Fuyao Glass Industry Group
  • Vitro
  • S.A.B. De C.V.
  • CSG Holding Co. Ltd.