Search Market Research Report

Discover Our Latest Reports
Discover Our Featured Reports
Discover Top Selling Reports

Ethylene Market Size, Share Global Analysis Report, 2020–2026

report img

Ethylene Market By Type (Ethylene oxide, Polyethylene, Ethylene dichloride, and Ethylene benzene), and By End Use( Automotive, Packaging, Agrochemical, Construction, Textile and Others): Global Industry Outlook, Market Size, Business Intelligence, Consumer Preferences, Statistical Surveys, Comprehensive Analysis, Historical Developments, Current Trends, and Forecast 2020–2026

Industry Insights

The Ethylene Market report analyzes and notifies the industry statistics at the global as well as regional and country levels in order to acquire a thorough perspective of the entire ethylene market. The historical and past insights are provided for FY 2016 to FY 2019 whereas projected trends are delivered for FY 2020 to FY 2026. The quantitative and numerical data is represented in terms of both volume (Units) and value (USD Million) from FY 2016 – 2026.

This specialized and expertise-oriented industry research report scrutinizes the technical and commercial business outlook of the Ethylene industry. The report analyzes and declares the historical and current trends analysis of the Ethylene industry and subsequently recommends the projected trends anticipated to be observed in the ethylene market during the upcoming years.

Ethylene Market Size,

To know more about this report | Request Free Sample Copy

logoKey Insights from Primary Research

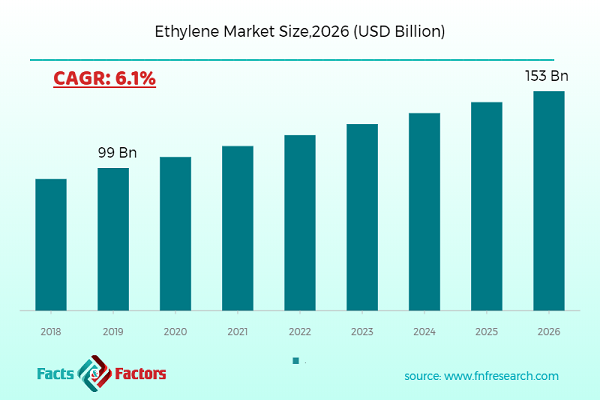
  • As per our primary respondents, the ethylene market is set to grow at a rate of around 6%.
  • It was established through primary interviews that the ethylene market was valued at around USD 99 Million in 2019.
  • APAC will grow the global ethylene market over the forecast period as countries like China and India have a high demand for plastics.
  • On the basis of the application segment, the automotive industry dominates the ethylene market in 2019.
  • As per primary research, the growing construction industry will raise the demand for ethylene products.

logoKey Recommendations from Analysts

  • As per our analysts, the global ethylene market is expected to grow significantly over the forecast period.
  • The strategic and competitive advantage provided by ‘polyethylene’ is anticipated to be the key factor driving this market globally.
  • In recent years, our team of analysts has identified that the growing construction activities worldwide have fueled the demand for high-density polyethylene (HDPE) resins in the manufacture of pipes, plumbing, electrical boxes, and telephone ducts.
  • It has boosted the demand for HDPE for other applications such as decorative items, storage tanks, and geosynthetics.
  • Overall, the global market has the potential to grow owing to its increasing demand for the automotive industry.

The quantitative data is further underlined and reinforced by comprehensive qualitative data which comprises various across-the-board market dynamics. The rationales which directly or indirectly impact the ethylene industry are exemplified through parameters such as growth drivers, restraints, challenges, and opportunities among other impacting factors.

Throughout our research report, we have encompassed all the proven models and tools of industry analysis and extensively illustrated all the key business strategies and business models adopted in the ethylene industry. The report provides an all-inclusive and detailed competitive landscape prevalent in the ethylene market.

The report utilizes established industry analysis tools and models such as Porter’s Five Forces framework to analyze and recognize critical business strategies adopted by various stakeholders involved in the entire value chain of the Ethylene industry. The ethylene market report additionally employs SWOT analysis and PESTLE analysis models for further in-depth analysis.

The report study further includes an in-depth analysis of industry players' market shares and provides an overview of leading players' market positions in the ethylene sector. Key strategic developments in the ethylene market competitive landscape such as acquisitions & mergers, inaugurations of different products and services, partnerships & joint ventures, MoU agreements, VC & funding activities, R&D activities, and geographic expansion among other noteworthy activities by key players of the ethylene market are appropriately highlighted in the report.

Increasing investment initiatives towards fueling the gas production capacity are influencing the global market of ethylene. Due to the widespread use of ethane gas in various sectors, many companies involved in its development are seeking to increase their production capacity. For instance, in August 2018, ExxonMobil and Saudi Basic Industries Corporation announced their decision to expand the ethylene production facility.

Due to the increasing demand for Polyethylene from the packaging industry, the demand for ethylene oxides and ethylene glycol is anticipated to register a progressive growth. Almost, in every product, ethylene oxide used is used as an essential raw material in the production of fibers for ethylene glycol. End-use industries, such as textile, packaging, building, and automotive, have significant applications of ethylene which are raising the demand for ethylene across the nations. The ever-increasing number of applications in the production of packaging products such as HDPE and LDPE has proliferated the ethylene market across several countries, especially the developing economies such as India, China, and Indonesia among others, for various types of ethylene. The ethylene market research report delivers an acute valuation and taxonomy of the ethylene industry by practically splitting the market on the basis of different types, applications, and regions.

Through the analysis of the historical and projected trends, all the segments and sub-segments were evaluated through the bottom-up approach, and different market sizes have been projected for FY 2020 to FY 2026. The regional segmentation of the Ethylene industry includes the complete classification of all the major continents including North America, Latin America, Europe, Asia Pacific, and the Middle East & Africa. Further, country-wise data for the ethylene industry is provided for the leading economies of the world.

The ethylene market is segmented based on type and application. On the basis of type segmentation, the market is classified into polyethylene, ethylene oxide, ethylene benzene, and ethylene dichloride. In terms of application segmentation, the market is bifurcated into automotive, packaging, agrochemical, construction, and textile among others.

logoReport Scope

Report Attribute

Details

Market Size in 2019

USD 99 Billion

Projected Market Size in 2026

USD 153 Billion

CAGR Growth Rate

6.1% CAGR

Base Year

2019

Forecast Years

2019-2026

Key Market Players

Exxon Mobil Corporation, Saudi Basic Industries Corp, Royal Dutch Shell plc, Dow DuPont Inc., Chevron Phillips Chemical Company LLC, China Petroleum & Chemical Corporation, The National Petrochemical Company, LyondellBasell Industries N.V., Lonza Group, and BASF SE among others.

Key Segment

By Type, By End-users, By Region

Major Regions Covered

North America, Europe, Asia Pacific, Latin America, and the Middle East & Africa

Purchase Options

Request customized purchase options to meet your research needs. Explore purchase options

logoSome of the essential players operating in the ethylene market, but not restricted include: 

  •  Exxon Mobil Corporation
  •  Saudi Basic Industries Corp
  •  Royal Dutch Shell plc
  •  Dow DuPont Inc.
  •  Chevron Phillips Chemical Company LLC
  •  China Petroleum & Chemical Corporation
  •  The National Petrochemical Company
  •  LyondellBasell Industries N.V.
  •  Lonza Group 
  •  BASF SE

The taxonomy of the ethylene industry by its scope and segmentation is as follows:

logo By Type Segmentation Analysis

  • Ethylene oxide
  • Polyethylene
  • Ethylene dichloride
  • Ethylene benzene
  • Others

logo By End-Use Segmentation Analysis

  • Automotive
  • Packaging
  • Agrochemical
  • Construction
  • Textile
  • Others

logo Regional Segmentation Analysis

  • North America
    • The U.S.
    • Canada
  • Europe
    • Germany
    • The UK
    • France
    • Spain
    • Italy
    • Rest of Europe
  • Asia Pacific
    • China
    • Japan
    • India
    • South Korea
    • Southeast Asia
    • Rest of Asia Pacific
  • Latin America
    • Brazil
    • Mexico
    • Rest of Latin America
  • Middle East & Africa
    • GCC
    • South Africa
    • Rest of the Middle East & Africa

Table of Content

  1. CHAPTER 1. Executive Summary
  2. CHAPTER 2. ethylene market – Application Analysis
    1. 2.1. Global Ethylene Market – Application Overview
    2. 2.2. Global Ethylene Market Share, by Application, 2018 & 2025 (USD Million)
    3. 2.3. Global Ethylene Market share, by Application, 2018 & 2025 (Kilo Tons)
    4. 2.4. Ethylene oxide
      1. 2.4.1. Global Ethylene oxide Ethylene Market, 2016-2026 (USD Million)
      2. 2.4.2. Global Ethylene oxide Ethylene Market, 2016-2026 (Kilo Tons)
    5. 2.5. Polyethylene
      1. 2.5.1. Global Polyethylene Ethylene Market, 2016-2026 (USD Million)
      2. 2.5.2. Global Polyethylene Ethylene Market, 2016-2026 (Kilo Tons)
    6. 2.6. Ethylene dichloride
      1. 2.6.1. Global Ethylene dichloride Ethylene Market, 2016-2026 (USD Million)
      2. 2.6.2. Global Ethylene dichloride Ethylene Market, 2016-2026 (Kilo Tons)
    7. 2.7. Ethylene benzene
      1. 2.7.1. Global Ethylene benzene Ethylene Market, 2016-2026 (USD Million)
      2. 2.7.2. Global Ethylene benzene Ethylene Market, 2016-2026 (Kilo Tons)
    8. 2.8. Others
      1. 2.8.1. Global Others Ethylene Market, 2016-2026 (USD Million)
      2. 2.8.2. Global Others Ethylene Market, 2016-2026 (Kilo Tons)
  3. CHAPTER 3. ethylene market – End Use Analysis
    1. 3.1. Global Ethylene Market – End Use Overview
    2. 3.2. Global Ethylene Market Share, by End Use, 2018 & 2025 (USD Million)
    3. 3.3. Global Ethylene Market share, by End Use, 2018 & 2025 (Kilo Tons)
    4. 3.4. Automotive
      1. 3.4.1. Global Automotive Ethylene Market, 2016-2026 (USD Million)
      2. 3.4.2. Global Automotive Ethylene Market, 2016-2026 (Kilo Tons)
    5. 3.5. Packaging
      1. 3.5.1. Global Packaging Ethylene Market, 2016-2026 (USD Million)
      2. 3.5.2. Global Packaging Ethylene Market, 2016-2026 (Kilo Tons)
    6. 3.6. Agrochemical
      1. 3.6.1. Global Agrochemical Ethylene Market, 2016-2026 (USD Million)
      2. 3.6.2. Global Agrochemical Ethylene Market, 2016-2026 (Kilo Tons)
    7. 3.7. Construction
      1. 3.7.1. Global Construction Ethylene Market, 2016-2026 (USD Million)
      2. 3.7.2. Global Construction Ethylene Market, 2016-2026 (Kilo Tons)
    8. 3.8. Textile
      1. 3.8.1. Global Textile Ethylene Market, 2016-2026 (USD Million)
      2. 3.8.2. Global Textile Ethylene Market, 2016-2026 (Kilo Tons)
    9. 3.9. Others
      1. 3.9.1. Global Others Ethylene Market, 2016-2026 (USD Million)
      2. 3.9.2. Global Others Ethylene Market, 2016-2026 (Kilo Tons)
  4. CHAPTER 4. ethylene market – Regional Analysis
    1. 4.1. Global Ethylene Market Regional Overview
    2. 4.2. Global Ethylene Market Share, by Region, 2018 & 2025 (Value)
    3. 4.3. Global Ethylene Market Share, by Region, 2018 & 2025 (Volume)
    4. 4.4. North America
      1. 4.4.1. North America Ethylene Market size and forecast, 2016-2026
      2. 4.4.2. North America Ethylene Market, by Country, 2018 - 2025 (USD Million)
      3. 4.4.3. North America Market size and forecast, 2016-2026 (Kilo Tons)
      4. 4.4.4. North America Ethylene Market, by Country, 2018 - 2025 (Kilo Tons)
      5. 4.4.5. North America Ethylene Market, by Application, 2016-2026
        1. 4.4.5.1. North America Ethylene Market, by Application, 2016-2026 (USD Million)
        2. 4.4.5.2. North America Ethylene Market, by Application, 2016-2026 (Kilo Tons)
      6. 4.4.6. North America Ethylene Market, by End Use, 2016-2026
        1. 4.4.6.1. North America Ethylene Market, by End Use, 2016-2026 (USD Million)
        2. 4.4.6.2. North America Ethylene Market, by End Use, 2016-2026 (Kilo Tons)
      7. 4.4.7. U.S.
        1. 4.4.7.1. U.S. Market size and forecast, 2016-2026 (USD Million)
        2. 4.4.7.2. U.S. Market size and forecast, 2016-2026 (Kilo Tons)
      8. 4.4.8. Canada
        1. 4.4.8.1. Canada Market size and forecast, 2016-2026 (USD Million)
        2. 4.4.8.2. Canada Market size and forecast, 2016-2026 (Kilo Tons)
    5. 4.5. Europe
      1. 4.5.1. Europe Ethylene Market size and forecast, 2016-2026
      2. 4.5.2. Europe Ethylene Market, by Country, 2018 - 2025 (USD Million)
      3. 4.5.3. Europe Market size and forecast, 2016-2026 (Kilo Tons)
      4. 4.5.4. Europe Ethylene Market, by Country, 2018 - 2025 (Kilo Tons)
      5. 4.5.5. Europe Ethylene Market, by Application, 2016-2026
        1. 4.5.5.1. Europe Ethylene Market, by Application, 2016-2026 (USD Million)
        2. 4.5.5.2. Europe Ethylene Market, by Application, 2016-2026 (Kilo Tons)
      6. 4.5.6. Europe Ethylene Market, by End Use, 2016-2026
        1. 4.5.6.1. Europe Ethylene Market, by End Use, 2016-2026 (USD Million)
        2. 4.5.6.2. Europe Ethylene Market, by End Use, 2016-2026 (Kilo Tons)
      7. 4.5.7. Germany
        1. 4.5.7.1. Germany Market size and forecast, 2016-2026 (USD Million)
        2. 4.5.7.2. Germany Market size and forecast, 2016-2026 (Kilo Tons)
      8. 4.5.8. France
        1. 4.5.8.1. France Market size and forecast, 2016-2026 (USD Million)
        2. 4.5.8.2. France Market size and forecast, 2016-2026 (Kilo Tons)
      9. 4.5.9. U.K.
        1. 4.5.9.1. U.K. Market size and forecast, 2016-2026 (USD Million)
        2. 4.5.9.2. U.K. Market size and forecast, 2016-2026 (Kilo Tons)
      10. 4.5.10. Italy
        1. 4.5.10.1. Italy Market size and forecast, 2016-2026 (USD Million)
        2. 4.5.10.2. Italy Market size and forecast, 2016-2026 (Kilo Tons)
      11. 4.5.11. Spain
        1. 4.5.11.1. Spain Market size and forecast, 2016-2026 (USD Million)
        2. 4.5.11.2. Spain Market size and forecast, 2016-2026 (Kilo Tons)
      12. 4.5.12. Rest of Europe
        1. 4.5.12.1. Rest of Europe Market size and forecast, 2016-2026 (USD Million)
        2. 4.5.12.2. Rest of Europe Market size and forecast, 2016-2026 (Kilo Tons)
    6. 4.6. Asia Pacific
      1. 4.6.1. Asia Pacific Ethylene Market size and forecast, 2016-2026
      2. 4.6.2. Asia Pacific Ethylene Market, by Country, 2018 - 2025 (USD Million)
      3. 4.6.3. Asia Pacific Market size and forecast, 2016-2026 (Kilo Tons)
      4. 4.6.4. Asia Pacific Ethylene Market, by Country, 2018 - 2025 (Kilo Tons)
      5. 4.6.5. Asia Pacific Ethylene Market, by Application, 2016-2026
        1. 4.6.5.1. Asia Pacific Ethylene Market, by Application, 2016-2026 (USD Million)
        2. 4.6.5.2. Asia Pacific Ethylene Market, by Application, 2016-2026 (Kilo Tons)
      6. 4.6.6. Asia Pacific Ethylene Market, by End Use, 2016-2026
        1. 4.6.6.1. Asia Pacific Ethylene Market, by End Use, 2016-2026 (USD Million)
        2. 4.6.6.2. Asia Pacific Ethylene Market, by End Use, 2016-2026 (Kilo Tons)
      7. 4.6.7. China
        1. 4.6.7.1. China Market size and forecast, 2016-2026 (USD Million)
        2. 4.6.7.2. China Market size and forecast, 2016-2026 (Kilo Tons)
      8. 4.6.8. Japan
        1. 4.6.8.1. Japan Market size and forecast, 2016-2026 (USD Million)
        2. 4.6.8.2. Japan Market size and forecast, 2016-2026 (Kilo Tons)
      9. 4.6.9. India
        1. 4.6.9.1. India Market size and forecast, 2016-2026 (USD Million)
        2. 4.6.9.2. India Market size and forecast, 2016-2026 (Kilo Tons)
      10. 4.6.10. South Korea
        1. 4.6.10.1. South Korea Market size and forecast, 2016-2026 (USD Million)
        2. 4.6.10.2. South Korea Market size and forecast, 2016-2026 (Kilo Tons)
      11. 4.6.11. South-East Asia
        1. 4.6.11.1. South-East Asia Market size and forecast, 2016-2026 (USD Million)
        2. 4.6.11.2. South-East Asia Market size and forecast, 2016-2026 (Kilo Tons)
      12. 4.6.12. Rest of Asia Pacific
        1. 4.6.12.1. Rest of Asia Pacific Market size and forecast, 2016-2026 (USD Million)
        2. 4.6.12.2. Rest of Asia Pacific Market size and forecast, 2016-2026 (Kilo Tons)
    7. 4.7. Latin America
      1. 4.7.1. Latin America Ethylene Market size and forecast, 2016-2026
      2. 4.7.2. Latin America Ethylene Market, by Country, 2018 - 2025 (USD Million)
      3. 4.7.3. Latin America Market size and forecast, 2016-2026 (Kilo Tons)
      4. 4.7.4. Latin America Ethylene Market, by Country, 2018 - 2025 (Kilo Tons)
      5. 4.7.5. Latin America Ethylene Market, by Application, 2016-2026
        1. 4.7.5.1. Latin America Ethylene Market, by Application, 2016-2026 (USD Million)
        2. 4.7.5.2. Latin America Ethylene Market, by Application, 2016-2026 (Kilo Tons)
      6. 4.7.6. Latin America Ethylene Market, by End Use, 2016-2026
        1. 4.7.6.1. Latin America Ethylene Market, by End Use, 2016-2026 (USD Million)
        2. 4.7.6.2. Latin America Ethylene Market, by End Use, 2016-2026 (Kilo Tons)
      7. 4.7.7. Brazil
        1. 4.7.7.1. Brazil Market size and forecast, 2016-2026 (USD Million)
        2. 4.7.7.2. Brazil Market size and forecast, 2016-2026 (Kilo Tons)
      8. 4.7.8. Mexico
        1. 4.7.8.1. Mexico Market size and forecast, 2016-2026 (USD Million)
        2. 4.7.8.2. Mexico Market size and forecast, 2016-2026 (Kilo Tons)
      9. 4.7.9. Rest of Latin America
        1. 4.7.9.1. Rest of Latin America Market size and forecast, 2016-2026 (USD Million)
        2. 4.7.9.2. Rest of Latin America Market size and forecast, 2016-2026 (Kilo Tons)
    8. 4.8. The Middle-East and Africa
      1. 4.8.1. The Middle-East and Africa Ethylene Market size and forecast, 2016-2026
      2. 4.8.2. The Middle-East and Africa Ethylene Market, by Country, 2018 - 2025 (USD Million)
      3. 4.8.3. The Middle-East and Africa Market size and forecast, 2016-2026 (Kilo Tons)
      4. 4.8.4. The Middle-East and Africa Ethylene Market, by Country, 2018 - 2025 (Kilo Tons)
      5. 4.8.5. The Middle-East and Africa Ethylene Market, by Application, 2016-2026
        1. 4.8.5.1. The Middle-East and Africa Ethylene Market, by Application, 2016-2026 (USD Million)
        2. 4.8.5.2. The Middle-East and Africa Ethylene Market, by Application, 2016-2026 (Kilo Tons)
      6. 4.8.6. The Middle-East and Africa Ethylene Market, by End Use, 2016-2026
        1. 4.8.6.1. The Middle-East and Africa Ethylene Market, by End Use, 2016-2026 (USD Million)
        2. 4.8.6.2. The Middle-East and Africa Ethylene Market, by End Use, 2016-2026 (Kilo Tons)
      7. 4.8.7. GCC Countries
        1. 4.8.7.1. GCC Countries Market size and forecast, 2016-2026 (USD Million)
        2. 4.8.7.2. GCC Countries Market size and forecast, 2016-2026 (Kilo Tons)
      8. 4.8.8. South Africa
        1. 4.8.8.1. South Africa Market size and forecast, 2016-2026 (USD Million)
        2. 4.8.8.2. South Africa Market size and forecast, 2016-2026 (Kilo Tons)
      9. 4.8.9. Rest of Middle-East Africa
        1. 4.8.9.1. Rest of Middle-East Africa Market size and forecast, 2016-2026 (USD Million)
        2. 4.8.9.2. Rest of Middle-East Africa Market size and forecast, 2016-2026 (Kilo Tons)
  5. CHAPTER 5. Ethylene Production, Consumption, Export, Import by Regions
    1. 5.1. Global Ethylene production and revenue, 2015-2025 (USD Million) (Kilo Tons)
    2. 5.2. Global Import and Export Analysis, by Region
  6. CHAPTER 6. ethylene market – Competitive Landscape
    1. 6.1. Competitor Market Share – Revenue
    2. 6.2. Market Concentration Rate Analysis, Top 3 and Top 5 Players
    3. 6.3. Competitor Market Share – Volume
    4. 6.4. Strategic Development
      1. 6.4.1. Acquisitions and Mergers
      2. 6.4.2. New Products
      3. 6.4.3. Research & Development Activities
  7. CHAPTER 7. Company Profiles
    1. 7.1. Exxon Mobil Corporation
      1. 7.1.1. Company Overview
      2. 7.1.2. Exxon Mobil Corporation Sales, Revenue, Price, and Gross Margin
      3. 7.1.3. Product portfolio
      4. 7.1.4. Recent initiatives
    2. 7.2. Saudi Basic Industries Corp
      1. 7.2.1. Company Overview
      2. 7.2.2. Saudi Basic Industries Corp Sales, Revenue, Price, and Gross Margin
      3. 7.2.3. Product portfolio
      4. 7.2.4. Recent initiatives
    3. 7.3. Royal Dutch Shell plc
      1. 7.3.1. Company Overview
      2. 7.3.2. Royal Dutch Shell plc Sales, Revenue, Price, and Gross Margin
      3. 7.3.3. Product portfolio
      4. 7.3.4. Recent initiatives
    4. 7.4. Dow DuPont Inc.
      1. 7.4.1. Company Overview
      2. 7.4.2. Dow DuPont Inc. Sales, Revenue, Price, and Gross Margin
      3. 7.4.3. Product portfolio
      4. 7.4.4. Recent initiatives
    5. 7.5. Chevron Phillips Chemical Company LLC
      1. 7.5.1. Company Overview
      2. 7.5.2. Chevron Phillips Chemical Company LLC Sales, Revenue, Price, and Gross Margin
      3. 7.5.3. Product portfolio
      4. 7.5.4. Recent initiatives
    6. 7.6. China Petroleum & Chemical Corporation
      1. 7.6.1. Company Overview
      2. 7.6.2. China Petroleum & Chemical Corporation Sales, Revenue, Price, and Gross Margin
      3. 7.6.3. Product portfolio
      4. 7.6.4. Recent initiatives
    7. 7.7. The National Petrochemical Company
      1. 7.7.1. Company Overview
      2. 7.7.2. The National Petrochemical Company Sales, Revenue, Price, and Gross Margin
      3. 7.7.3. Product portfolio
      4. 7.7.4. Recent initiatives
    8. 7.8. LyondellBasell Industries N.V.
      1. 7.8.1. Company Overview
      2. 7.8.2. LyondellBasell Industries N.V. Sales, Revenue, Price, and Gross Margin
      3. 7.8.3. Product portfolio
      4. 7.8.4. Recent initiatives
    9. 7.9. Lonza Group
      1. 7.9.1. Company Overview
      2. 7.9.2. Lonza Group Sales, Revenue, Price, and Gross Margin
      3. 7.9.3. Product portfolio
      4. 7.9.4. Recent initiatives
    10. 7.10. BASF SE
      1. 7.10.1. Company Overview
      2. 7.10.2. BASF SE Sales, Revenue, Price, and Gross Margin
      3. 7.10.3. Product portfolio
      4. 7.10.4. Recent initiatives
  8. CHAPTER 8. Ethylene — Industry Analysis
    1. 8.1. Introduction and Taxonomy
    2. 8.2. Ethylene Market – Key Trends
      1. 8.2.1. Market Drivers
      2. 8.2.2. Market Restraints
      3. 8.2.3. Market Opportunities
    3. 8.3. Value Chain Analysis
    4. 8.4. Key Mandates and Regulations
    5. 8.5. Technology Roadmap and Timeline
    6. 8.6. ethylene market – Attractiveness Analysis
      1. 8.6.1. By Application
      2. 8.6.2. By End Use
      3. 8.6.3. By Region
  9. CHAPTER 9. Raw Material analysis
    1. 9.1. Ethylene Key Raw Material Analysis
      1. 9.1.1. Key Raw Materials
      2. 9.1.2. Price Trend of Key Raw Materials
    2. 9.2. Key Suppliers of Raw Materials
    3. 9.3. Proportion of Manufacturing Cost Structure
      1. 9.3.1. Raw Materials
      2. 9.3.2. Labor Cost
    4. 9.4. Manufacturing Expenses Analysis of Ethylene
  10. CHAPTER 10. Industrial Chain, Sourcing Strategy and Downstream Buyers
    1. 10.1. Ethylene Industrial Chain Analysis
    2. 10.2. Upstream Raw Materials Sourcing
      1. 10.2.1. Risk Mitigation:
      2. 10.2.2. Supplier Relationships:
      3. 10.2.3. Business Processes:
      4. 10.2.4. Securing the Product:
    3. 10.3. Raw Materials Sources of Ethylene Major Manufacturers in 2016
    4. 10.4. Downstream Buyers
    5. 10.5. Distributors/Traders List
  11. CHAPTER 11. Marketing Strategy Analysis, Distributors
    1. 11.1. Marketing Channel
    2. 11.2. Direct Marketing
    3. 11.3. Indirect Marketing
    4. 11.4. Marketing Channel Development Trend
    5. 11.5. Economic/Political Environmental Change
  12. CHAPTER 12. Report Conclusion
  13. CHAPTER 13. Research Approach & Methodology
    1. 13.1. Report Description
    2. 13.2. Research Scope
    3. 13.3. Research Methodology
      1. 13.3.1. Secondary Research
      2. 13.3.2. Primary Research
      3. 13.3.3. Models
        1. 13.3.3.1. Company Share Analysis Model
        2. 13.3.3.2. Revenue Based Modeling
        3. 13.3.3.3. Research Limitations

        List of Figures

        FIG. 1 Global Ethylene Market, 2016-2026 (USD Million)
        FIG. 2 Global Ethylene Market Share, by Application, 2018 & 2025 (USD Million)
        FIG. 3 Global Ethylene Market share, by Application, 2018 & 2025 (Kilo Tons)
        FIG. 4 Global Ethylene oxide Ethylene Market, 2016-2026 (USD Million)
        FIG. 5 Global Ethylene oxide Ethylene  Market, 2016-2026 (Kilo Tons)
        FIG. 6 Global Polyethylene Ethylene Market, 2016-2026 (USD Million)
        FIG. 7 Global Polyethylene Ethylene  Market, 2016-2026 (Kilo Tons)
        FIG. 8 Global Ethylene dichloride Ethylene Market, 2016-2026 (USD Million)
        FIG. 9 Global Ethylene dichloride Ethylene  Market, 2016-2026 (Kilo Tons)
        FIG. 10 Global Ethylene benzene Ethylene Market, 2016-2026 (USD Million)
        FIG. 11 Global Ethylene benzene Ethylene  Market, 2016-2026 (Kilo Tons)
        FIG. 12 Global Others Ethylene Market, 2016-2026 (USD Million)
        FIG. 13 Global Others Ethylene  Market, 2016-2026 (Kilo Tons)
        FIG. 14 Global Ethylene Market Share, by End Use, 2018 & 2025 (USD Million)
        FIG. 15 Global Ethylene Market share, by End Use, 2018 & 2025 (Kilo Tons)
        FIG. 16 Global Automotive Ethylene Market, 2016-2026 (USD Million)
        FIG. 17 Global Automotive Ethylene  Market, 2016-2026 (Kilo Tons)
        FIG. 18 Global Packaging Ethylene Market, 2016-2026 (USD Million)
        FIG. 19 Global Packaging Ethylene  Market, 2016-2026 (Kilo Tons)
        FIG. 20 Global Agrochemical Ethylene Market, 2016-2026 (USD Million)
        FIG. 21 Global Agrochemical Ethylene  Market, 2016-2026 (Kilo Tons)
        FIG. 22 Global Construction Ethylene Market, 2016-2026 (USD Million)
        FIG. 23 Global Construction Ethylene  Market, 2016-2026 (Kilo Tons)
        FIG. 24 Global Textile Ethylene Market, 2016-2026 (USD Million)
        FIG. 25 Global Textile Ethylene  Market, 2016-2026 (Kilo Tons)
        FIG. 26 Global Others Ethylene Market, 2016-2026 (USD Million)
        FIG. 27 Global Others Ethylene  Market, 2016-2026 (Kilo Tons)
        FIG. 28 Global Ethylene Market Share, by Region, 2018 & 2025
        FIG. 29 Global Ethylene Market Share, by Region, 2018 & 2025
        FIG. 30 North America Ethylene Market, 2016-2026
        FIG. 31 North America Ethylene  Market, 2016-2026 (Kilo Tons)
        FIG. 32 U.S. Ethylene Market, 2016-2026
        FIG. 33 U.S. Ethylene  Market, 2016-2026 (Kilo Tons)
        FIG. 34 Canada Ethylene Market, 2016-2026
        FIG. 35 Canada Ethylene  Market, 2016-2026 (Kilo Tons)
        FIG. 36 Europe Ethylene Market, 2016-2026
        FIG. 37 Europe Ethylene  Market, 2016-2026 (Kilo Tons)
        FIG. 38 Germany Ethylene Market, 2016-2026
        FIG. 39 Germany Ethylene  Market, 2016-2026 (Kilo Tons)
        FIG. 40 France Ethylene Market, 2016-2026
        FIG. 41 France Ethylene  Market, 2016-2026 (Kilo Tons)
        FIG. 42 U.K. Ethylene Market, 2016-2026
        FIG. 43 U.K. Ethylene  Market, 2016-2026 (Kilo Tons)
        FIG. 44 Italy Ethylene Market, 2016-2026
        FIG. 45 Italy Ethylene  Market, 2016-2026 (Kilo Tons)
        FIG. 46 Spain Ethylene Market, 2016-2026
        FIG. 47 Spain Ethylene  Market, 2016-2026 (Kilo Tons)
        FIG. 48 Rest of Europe Ethylene Market, 2016-2026
        FIG. 49 Rest of Europe Ethylene  Market, 2016-2026 (Kilo Tons)
        FIG. 50 Asia Pacific Ethylene Market, 2016-2026
        FIG. 51 Asia Pacific Ethylene  Market, 2016-2026 (Kilo Tons)
        FIG. 52 China Ethylene Market, 2016-2026
        FIG. 53 China Ethylene  Market, 2016-2026 (Kilo Tons)
        FIG. 54 Japan Ethylene Market, 2016-2026
        FIG. 55 Japan Ethylene  Market, 2016-2026 (Kilo Tons)
        FIG. 56 India Ethylene Market, 2016-2026
        FIG. 57 India Ethylene  Market, 2016-2026 (Kilo Tons)
        FIG. 58 South  Korea Ethylene Market, 2016-2026
        FIG. 59 South  Korea Ethylene  Market, 2016-2026 (Kilo Tons)
        FIG. 60 South-East Asia Ethylene Market, 2016-2026
        FIG. 61 South-East Asia Ethylene  Market, 2016-2026 (Kilo Tons)
        FIG. 62 Rest of Asia Pacific Ethylene Market, 2016-2026
        FIG. 63 Rest of Asia Pacific Ethylene  Market, 2016-2026 (Kilo Tons)
        FIG. 64 Latin America Ethylene Market, 2016-2026
        FIG. 65 Latin America Ethylene  Market, 2016-2026 (Kilo Tons)
        FIG. 66 Brazil Ethylene Market, 2016-2026
        FIG. 67 Brazil Ethylene  Market, 2016-2026 (Kilo Tons)
        FIG. 68 Mexico Ethylene Market, 2016-2026
        FIG. 69 Mexico Ethylene  Market, 2016-2026 (Kilo Tons)
        FIG. 70 Rest of Latin America Ethylene Market, 2016-2026
        FIG. 71 Rest of Latin America Ethylene  Market, 2016-2026 (Kilo Tons)
        FIG. 72 The Middle-East and Africa Ethylene Market, 2016-2026
        FIG. 73 The Middle-East and Africa Ethylene  Market, 2016-2026 (Kilo Tons)
        FIG. 74 GCC Countries Ethylene Market, 2016-2026
        FIG. 75 GCC Countries Ethylene  Market, 2016-2026 (Kilo Tons)
        FIG. 76 South Africa Ethylene Market, 2016-2026
        FIG. 77 South Africa Ethylene  Market, 2016-2026 (Kilo Tons)
        FIG. 78 Rest of Middle-East Africa Ethylene Market, 2016-2026
        FIG. 79 Rest of Middle-East Africa Ethylene  Market, 2016-2026 (Kilo Tons)
        FIG. 80 Global Ethylene production and revenue, 2015-2025 (USD Million) (Kilo Tons)
        FIG. 81 North America Ethylene production and revenue, 2015-2025 (USD Million) (Kilo Tons)
        FIG. 82 Europe Ethylene production and revenue, 2015-2025 (USD Million) (Kilo Tons)
        FIG. 83 Asia Pacific Ethylene production and revenue, 2015-2025 (USD Million) (Kilo Tons)
        FIG. 84 Latin America Ethylene production and revenue, 2015-2025 (USD Million) (Kilo Tons)
        FIG. 85 Middle East and Africa Ethylene production and revenue, 2015-2025 (USD Million) (Kilo Tons)
        FIG. 86 Competitor Market Share – Revenue
        FIG. 87 Competitor Market Share – Volume
        FIG. 88 Exxon Mobil Corporation Revenue and Growth Rate
        FIG. 89 Exxon Mobil Corporation Market Share
        FIG. 90 Saudi Basic Industries Corp Revenue and Growth Rate
        FIG. 91 Saudi Basic Industries Corp Market Share
        FIG. 92 Royal Dutch Shell plc Revenue and Growth Rate
        FIG. 93 Royal Dutch Shell plc Market Share
        FIG. 94 Dow DuPont Inc. Revenue and Growth Rate
        FIG. 95 Dow DuPont Inc. Market Share
        FIG. 96 Chevron Phillips Chemical Company LLC Revenue and Growth Rate
        FIG. 97 Chevron Phillips Chemical Company LLC Market Share
        FIG. 98 China Petroleum & Chemical Corporation Revenue and Growth Rate
        FIG. 99 China Petroleum & Chemical Corporation Market Share
        FIG. 100 The National Petrochemical Company Revenue and Growth Rate
        FIG. 101 The National Petrochemical Company Market Share
        FIG. 102 LyondellBasell Industries N.V. Revenue and Growth Rate
        FIG. 103 LyondellBasell Industries N.V. Market Share
        FIG. 104 Lonza Group Revenue and Growth Rate
        FIG. 105 Lonza Group Market Share
        FIG. 106 BASF SE Revenue and Growth Rate
        FIG. 107 BASF SE Market Share
        FIG. 108 Market Dynamics
        FIG. 109 Global Ethylene – Value Chain Analysis
        FIG. 110 Key Mandates and Regulations
        FIG. 111 Technology Roadmap and Timeline
        FIG. 112 Market Attractiveness Analysis – By Application
        FIG. 113 Market Attractiveness Analysis – By End Use
        FIG. 114 Market Attractiveness Analysis – By Region
        FIG. 115 Manufacturing Cost Structure of Ethylene
        FIG. 116 Ethylene Industrial Chain Analysis
        FIG. 117 Market Channel
        FIG. 118 Marketing Channel Development Trend
        FIG. 119 Growth in World Gross Product, 2008-2018

        List of Tables

        TABLE 1 Global ethylene market, 2018 & 2025 (USD Million)
        TABLE 2 Global ethylene market, by Application, 2016-2026 (USD Million)
        TABLE 3 Global ethylene market, by Application, 2016-2026 (Kilo Tons)
        TABLE 4 Global ethylene market, by End Use, 2016-2026 (USD Million)
        TABLE 5 Global ethylene market, by End Use, 2016-2026 (Kilo Tons)
        TABLE 6 Global ethylene market, by region, 2016-2026 (USD Million)
        TABLE 7 Global ethylene market, by region, 2016-2026 (Kilo Tons)
        TABLE 8 North America Ethylene Market, by Application, 2016-2026 (USD Million)
        TABLE 9 North America Ethylene Market, by Application, 2016-2026 (Kilo Tons)
        TABLE 10 North America Ethylene Market, by End Use, 2016-2026 (USD Million)
        TABLE 11 North America Ethylene Market, by End Use, 2016-2026 (Kilo Tons)
        TABLE 12 Europe Ethylene Market, by Application, 2016-2026 (USD Million)
        TABLE 13 Europe Ethylene Market, by Application, 2016-2026 (Kilo Tons)
        TABLE 14 Europe Ethylene Market, by End Use, 2016-2026 (USD Million)
        TABLE 15 Europe Ethylene Market, by End Use, 2016-2026 (Kilo Tons)
        TABLE 16 Asia Pacific Ethylene Market, by Application, 2016-2026 (USD Million)
        TABLE 17 Asia Pacific Ethylene Market, by Application, 2016-2026 (Kilo Tons)
        TABLE 18 Asia Pacific Ethylene Market, by End Use, 2016-2026 (USD Million)
        TABLE 19 Asia Pacific Ethylene Market, by End Use, 2016-2026 (Kilo Tons)
        TABLE 20 Latin America Ethylene Market, by Application, 2016-2026 (USD Million)
        TABLE 21 Latin America Ethylene Market, by Application, 2016-2026 (Kilo Tons)
        TABLE 22 Latin America Ethylene Market, by End Use, 2016-2026 (USD Million)
        TABLE 23 Latin America Ethylene Market, by End Use, 2016-2026 (Kilo Tons)
        TABLE 24 The Middle-East and Africa Ethylene Market, by Application, 2016-2026 (USD Million)
        TABLE 25 The Middle-East and Africa Ethylene Market, by Application, 2016-2026 (Kilo Tons)
        TABLE 26 The Middle-East and Africa Ethylene Market, by End Use, 2016-2026 (USD Million)
        TABLE 27 The Middle-East and Africa Ethylene Market, by End Use, 2016-2026 (Kilo Tons)
        TABLE 28 North America Ethylene Production, Consumption, Export, Import, 2016-2019
        TABLE 29 Europe Ethylene Production, Consumption, Export, Import, 2016-2019
        TABLE 30 Asia Pacific Ethylene Production, Consumption, Export, Import, 2016-2019
        TABLE 31 Latin America Ethylene Production, Consumption, Export, Import, 2016-2019
        TABLE 32 Middle East & Africa Ethylene Production, Consumption, Export, Import, 2016-2019
        TABLE 33 Global Ethylene Market - Company Revenue Analysis 2016-2019 (USD Million)
        TABLE 34 Global Ethylene Market - Company Revenue Share Analysis 2016-2019(%)
        TABLE 35 Global Ethylene Market - Company Volume Analysis 2016-2019 (Kilo Tons)
        TABLE 36 Global Ethylene Market - Company Volume Share Analysis 2016-2019(%)
        TABLE 37 Acquisitions and Mergers
        TABLE 38 New Product/Service Launch
        TABLE 39 Research & Development Activities
        TABLE 40 Market Drivers
        TABLE 41 Market Restraints
        TABLE 42 Market Opportunities
        TABLE 43 Production Base and Market Concentration Rate of Raw Material
        TABLE 44 Key Suppliers of Raw Materials
        TABLE 45 Raw Materials Sources of Ethylene Major Manufacturers in 2016
        TABLE 46 Major Buyers of Ethylene
        TABLE 47 Distributors/Traders of Ethylene by Region
        

Industry Major Market Players

  •  Exxon Mobil Corporation
  •  Saudi Basic Industries Corp
  •  Royal Dutch Shell plc
  •  Dow DuPont Inc.
  •  Chevron Phillips Chemical Company LLC
  •  China Petroleum & Chemical Corporation
  •  The National Petrochemical Company
  •  LyondellBasell Industries N.V.
  •  Lonza Group 
  •  BASF SE