Search Market Research Report

Discover Our Latest Reports
Discover Our Featured Reports
Discover Top Selling Reports

Energy Meter Market Size, Share Global Analysis Report, 2021 – 2026

report img

Energy Meter Market by Type (Electromechanical Meters and Electronic Meters), by Price (Low, Medium Energy Meter Market, and High), by Application (Residential, Commercial, and Industrial), by Distribution Channel (Online and Offline): Global & Regional Industry Perspective, Comprehensive Analysis, and Forecast 2021 – 2026

Industry Insights

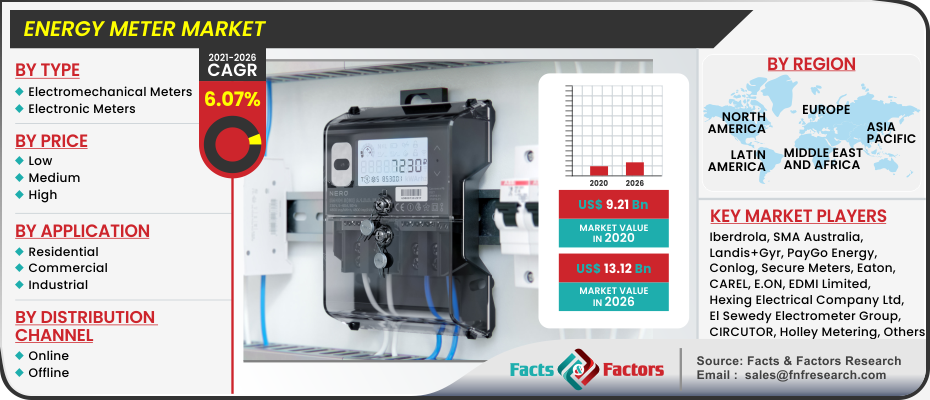
[193+ Pages Report] According to a Facts and Factors market research report, the global energy meter market was estimated to be USD 9.21 Billion in the year 2020; and the revenue is projected to reach about USD 13.12 Billion by the end of 2026, increasing at a CAGR of around 6.07% from 2021 to 2026.

logoMarket Overview

Energy meters are measuring devices that are used to determine the amount of electricity consumed in various areas such as residential, industrial, and commercial buildings. The energy provider typically installs this meter to measure consumption volume and calculate the amount to be invoiced to the customer.

logoIndustry Growth Factors

The rising number of government initiatives to develop advanced infrastructure for consistent delivery of energy and power to underdeveloped regions, as well as the high level of construction and industrialization activities in the global region, which has been one of the major applications for energy meters, will propel the market forward. For instance, by 2022, India intends to set up energy meters across its rural and semi-urban network to avoid losses. Government efforts like these will help the market develop during the forecast period. Consumer preference for smart meters over traditional meter variations and technologies has boosted the growth of the energy meter market, and it is predicted to be one of the most important growth drivers in the forecasted period.

Developing countries where infrastructure expansion is very intensive are also a growth factor where urbanizing the cities and industrial infrastructure are taking place, and many under-construction projects are installing energy meter market as a default electricity connection.

Energy Meter Market

To know more about this report | Request Free Sample Copy

logoSegmentation Analysis

On the basis of type, the energy meter market is segmented into electromechanical meters and electronic meters. On the basis of price, the energy meter market is segmented into low, medium, and high. On the basis of application, the energy meter market is segmented into residential, commercial, and industrial. On the basis of distribution channels, the energy meter market is segmented online and offline.

logoReport Scope

Report Attribute

Details

Market Size in 2020

USD 9.21 Billion

Projected Market Size in 2026

USD 13.12 Billion

CAGR Growth Rate

6.07% CAGR

Base Year

2020

Forecast Years

2021-2026

Key Market Players

Iberdrola, SMA Australia, Landis+Gyr, PayGo Energy, Conlog, Secure Meters, Eaton, CAREL, E.ON, EDMI Limited, Hexing Electrical Company Ltd, El Sewedy Electrometer Group, CIRCUTOR, Holley Metering, Elster GmbH, Exceleron, HCL, Itron Inc., and Siemens AG among others.

Key Segment

By Type, Price, Application, Distribution, and Region

Major Regions Covered

North America, Europe, Asia Pacific, Latin America, and the Middle East & Africa

Purchase Options

Request customized purchase options to meet your research needs.Explore purchase options

logo Regional Analysis

Asia Pacific is considered to be one of the promising markets for the energy meter market because of the developing countries that it constitutes.

logo Competitive Players

Some of the major market players in the energy meter market are :

  • Iberdrola
  • SMA Australia
  • Landis+Gyr
  • PayGo Energy
  • Conlog
  • Secure Meters
  • Eaton
  • CAREL
  • E.ON
  • EDMI Limited
  • Hexing Electrical Company Ltd
  • El Sewedy Electrometer Group
  • CIRCUTOR
  • Holley Metering
  • Elster GmbH
  • Exceleron
  • HCL
  • Itron Inc.
  • Siemens AG

logo By Type Segmentation Analysis:

  • Electromechanical Meters
  • Electronic Meters

logo By Price Segmentation Analysis

  • Low
  • Medium
  • High

logo By Application Segmentation Analysis:

  • Residential
  • Commercial
  • Industrial

logo By Distribution Channel Segmentation Analysis:

  • Online
  • Offline

logo Regional Segmentation Analysis

  • North America
    • U.S.
    • Canada
  • Europe
    • Germany
    • The UK
    • France
    • Spain
    • Italy
    • Rest of Europe
  • Asia Pacific
    • China
    • Japan
    • India
    • South Korea
    • Southeast Asia
    • Rest of Asia Pacific
  • Latin America
    • Brazil
    • Mexico
    • Rest of Latin America
  • Middle East & Africa
    • GCC Countries
    • South Africa
    • Rest of Middle East & Africa

Table of Content

  1. Chapter 1 Executive Summary
    1. 1.1. Introduction of Energy Meter
    2. 1.2. Global Energy Meter Market, 2020 & 2026 (USD Billion)
    3. 1.3. Global Energy Meter Market, 2016 – 2026 (USD Billion)
    4. 1.4. Global Energy Meter Market Absolute Revenue Opportunity, 2016 – 2026 (USD Billion)
    5. 1.5. Global Energy Meter Market Incremental Revenue Opportunity, 2020 – 2026 (USD Billion)
  2. Chapter 2 Energy Meter Market – Type Analysis
    1. 2.1. Global Energy Meter Market – Type Overview
    2. 2.2. Global Energy Meter Market Share, by Type, 2020 & 2026 (USD Billion)
    3. 2.3. Electromechanical Meters
      1. 2.3.1. Global Electromechanical Meters Energy Meter Market, 2016 – 2026 (USD Billion)
    4. 2.4. Electronic Meters
      1. 2.4.1. Global Electronic Meters Energy Meter Market, 2016 – 2026 (USD Billion)
  3. Chapter 3 Energy Meter Market – Price Analysis
    1. 3.1. Global Energy Meter Market – Price Overview
    2. 3.2. Global Energy Meter Market Share, by Price, 2020 & 2026 (USD Billion)
    3. 3.3. Low
      1. 3.3.1. Global Low Energy Meter Market, 2016 – 2026 (USD Billion)
    4. 3.4. Medium
      1. 3.4.1. Global Medium Energy Meter Market, 2016 – 2026 (USD Billion)
    5. 3.5. High
      1. 3.5.1. Global High Energy Meter Market, 2016 – 2026 (USD Billion)
  4. Chapter 4 Energy Meter Market – Application Analysis
    1. 4.1. Global Energy Meter Market – Application Overview
    2. 4.2. Global Energy Meter Market Share, by Application, 2020 & 2026 (USD Billion)
    3. 4.3. Residential
      1. 4.3.1. Global Residential Energy Meter Market, 2016 – 2026 (USD Billion)
    4. 4.4. Commercial
      1. 4.4.1. Global Commercial Energy Meter Market, 2016 – 2026 (USD Billion)
    5. 4.5. Industrial
      1. 4.5.1. Global Industrial Energy Meter Market, 2016 – 2026 (USD Billion)
  5. Chapter 5 Energy Meter Market – Distribution Channel Analysis
    1. 5.1. Global Energy Meter Market – Distribution Channel Overview
    2. 5.2. Global Energy Meter Market Share, by Distribution Channel, 2020 & 2026 (USD Billion)
    3. 5.3. Online
      1. 5.3.1. Global Online Energy Meter Market, 2016 – 2026 (USD Billion)
    4. 5.4. Offline
      1. 5.4.1. Global Offline Energy Meter Market, 2016 – 2026 (USD Billion)
  6. Chapter 6 Energy Meter Market – Regional Analysis
    1. 6.1. Global Energy Meter Market Regional Overview
    2. 6.2. Global Energy Meter Market Share, by Region, 2020 & 2026 (USD Billion)
    3. 6.3. North America
      1. 6.3.1. North America Energy Meter Market, 2016 – 2026 (USD Billion)
        1. 6.3.1.1. North America Energy Meter Market, by Country, 2016 - 2026 (USD Billion)
      2. 6.3.2. North America Energy Meter Market, by Type, 2016 – 2026
        1. 6.3.2.1. North America Energy Meter Market, by Type, 2016 – 2026 (USD Billion)
      3. 6.3.3. North America Energy Meter Market, by Price, 2016 – 2026
        1. 6.3.3.1. North America Energy Meter Market, by Price, 2016 – 2026 (USD Billion)
      4. 6.3.4. North America Energy Meter Market, by Application, 2016 – 2026
        1. 6.3.4.1. North America Energy Meter Market, by Application, 2016 – 2026 (USD Billion)
      5. 6.3.5. North America Energy Meter Market, by Distribution Channel, 2016 – 2026
        1. 6.3.5.1. North America Energy Meter Market, by Distribution Channel, 2016 – 2026 (USD Billion)
      6. 6.3.6. U.S.
        1. 6.3.6.1. U.S. Energy Meter Market, 2016 – 2026 (USD Billion)
      7. 6.3.7. Canada
        1. 6.3.7.1. Canada Energy Meter Market, 2016 – 2026 (USD Billion)
    4. 6.4. Europe
      1. 6.4.1. Europe Energy Meter Market, 2016 – 2026 (USD Billion)
        1. 6.4.1.1. Europe Energy Meter Market, by Country, 2016 - 2026 (USD Billion)
      2. 6.4.2. Europe Energy Meter Market, by Type, 2016 – 2026
        1. 6.4.2.1. Europe Energy Meter Market, by Type, 2016 – 2026 (USD Billion)
      3. 6.4.3. Europe Energy Meter Market, by Price, 2016 – 2026
        1. 6.4.3.1. Europe Energy Meter Market, by Price, 2016 – 2026 (USD Billion)
      4. 6.4.4. Europe Energy Meter Market, by Application, 2016 – 2026
        1. 6.4.4.1. Europe Energy Meter Market, by Application, 2016 – 2026 (USD Billion)
      5. 6.4.5. Europe Energy Meter Market, by Distribution Channel, 2016 – 2026
        1. 6.4.5.1. Europe Energy Meter Market, by Distribution Channel, 2016 – 2026 (USD Billion)
      6. 6.4.6. Germany
        1. 6.4.6.1. Germany Energy Meter Market, 2016 – 2026 (USD Billion)
      7. 6.4.7. France
        1. 6.4.7.1. France Energy Meter Market, 2016 – 2026 (USD Billion)
      8. 6.4.8. U.K.
        1. 6.4.8.1. U.K. Energy Meter Market, 2016 – 2026 (USD Billion)
      9. 6.4.9. Italy
        1. 6.4.9.1. Italy Energy Meter Market, 2016 – 2026 (USD Billion)
      10. 6.4.10. Spain
        1. 6.4.10.1. Spain Energy Meter Market, 2016 – 2026 (USD Billion)
      11. 6.4.11. Rest of Europe
        1. 6.4.11.1. Rest of Europe Energy Meter Market, 2016 – 2026 (USD Billion)
    5. 6.5. Asia Pacific
      1. 6.5.1. Asia Pacific Energy Meter Market, 2016 – 2026 (USD Billion)
        1. 6.5.1.1. Asia Pacific Energy Meter Market, by Country, 2016 - 2026 (USD Billion)
      2. 6.5.2. Asia Pacific Energy Meter Market, by Type, 2016 – 2026
        1. 6.5.2.1. Asia Pacific Energy Meter Market, by Type, 2016 – 2026 (USD Billion)
      3. 6.5.3. Asia Pacific Energy Meter Market, by Price, 2016 – 2026
        1. 6.5.3.1. Asia Pacific Energy Meter Market, by Price, 2016 – 2026 (USD Billion)
      4. 6.5.4. Asia Pacific Energy Meter Market, by Application, 2016 – 2026
        1. 6.5.4.1. Asia Pacific Energy Meter Market, by Application, 2016 – 2026 (USD Billion)
      5. 6.5.5. Asia Pacific Energy Meter Market, by Distribution Channel, 2016 – 2026
        1. 6.5.5.1. Asia Pacific Energy Meter Market, by Distribution Channel, 2016 – 2026 (USD Billion)
      6. 6.5.6. China
        1. 6.5.6.1. China Energy Meter Market, 2016 – 2026 (USD Billion)
      7. 6.5.7. Japan
        1. 6.5.7.1. Japan Energy Meter Market, 2016 – 2026 (USD Billion)
      8. 6.5.8. India
        1. 6.5.8.1. India Energy Meter Market, 2016 – 2026 (USD Billion)
      9. 6.5.9. South Korea
        1. 6.5.9.1. South Korea Energy Meter Market, 2016 – 2026 (USD Billion)
      10. 6.5.10. South-East Asia
        1. 6.5.10.1. South-East Asia Energy Meter Market, 2016 – 2026 (USD Billion)
      11. 6.5.11. Rest of Asia Pacific
        1. 6.5.11.1. Rest of Asia Pacific Energy Meter Market, 2016 – 2026 (USD Billion)
    6. 6.6. Latin America
      1. 6.6.1. Latin America Energy Meter Market, 2016 – 2026 (USD Billion)
        1. 6.6.1.1. Latin America Energy Meter Market, by Country, 2016 - 2026 (USD Billion)
      2. 6.6.2. Latin America Energy Meter Market, by Type, 2016 – 2026
        1. 6.6.2.1. Latin America Energy Meter Market, by Type, 2016 – 2026 (USD Billion)
      3. 6.6.3. Latin America Energy Meter Market, by Price, 2016 – 2026
        1. 6.6.3.1. Latin America Energy Meter Market, by Price, 2016 – 2026 (USD Billion)
      4. 6.6.4. Latin America Energy Meter Market, by Application, 2016 – 2026
        1. 6.6.4.1. Latin America Energy Meter Market, by Application, 2016 – 2026 (USD Billion)
      5. 6.6.5. Latin America Energy Meter Market, by Distribution Channel, 2016 – 2026
        1. 6.6.5.1. Latin America Energy Meter Market, by Distribution Channel, 2016 – 2026 (USD Billion)
      6. 6.6.6. Brazil
        1. 6.6.6.1. Brazil Energy Meter Market, 2016 – 2026 (USD Billion)
      7. 6.6.7. Mexico
        1. 6.6.7.1. Mexico Energy Meter Market, 2016 – 2026 (USD Billion)
      8. 6.6.8. Rest of Latin America
        1. 6.6.8.1. Rest of Latin America Energy Meter Market, 2016 – 2026 (USD Billion)
    7. 6.7. The Middle-East and Africa
      1. 6.7.1. The Middle-East and Africa Energy Meter Market, 2016 – 2026 (USD Billion)
        1. 6.7.1.1. The Middle-East and Africa Energy Meter Market, by Country, 2016 - 2026 (USD Billion)
      2. 6.7.2. The Middle-East and Africa Energy Meter Market, by Type, 2016 – 2026
        1. 6.7.2.1. The Middle-East and Africa Energy Meter Market, by Type, 2016 – 2026 (USD Billion)
      3. 6.7.3. The Middle-East and Africa Energy Meter Market, by Price, 2016 – 2026
        1. 6.7.3.1. The Middle-East and Africa Energy Meter Market, by Price, 2016 – 2026 (USD Billion)
      4. 6.7.4. The Middle-East and Africa Energy Meter Market, by Application, 2016 – 2026
        1. 6.7.4.1. The Middle-East and Africa Energy Meter Market, by Application, 2016 – 2026 (USD Billion)
      5. 6.7.5. The Middle-East and Africa Energy Meter Market, by Distribution Channel, 2016 – 2026
        1. 6.7.5.1. The Middle-East and Africa Energy Meter Market, by Distribution Channel, 2016 – 2026 (USD Billion)
      6. 6.7.6. GCC Countries
        1. 6.7.6.1. GCC Countries Energy Meter Market, 2016 – 2026 (USD Billion)
      7. 6.7.7. South Africa
        1. 6.7.7.1. South Africa Energy Meter Market, 2016 – 2026 (USD Billion)
      8. 6.7.8. Rest of Middle-East Africa
        1. 6.7.8.1. Rest of Middle-East Africa Energy Meter Market, 2016 – 2026 (USD Billion)
  7. Chapter 7 Energy Meter Market – Competitive Landscape
    1. 7.1. Competitor Market Share – Revenue
    2. 7.2. Market Concentration Rate Analysis, Top 3 and Top 5 Players
    3. 7.3. Strategic Developments
      1. 7.3.1. Acquisitions and Mergers
      2. 7.3.2. New Products
      3. 7.3.3. Research & Development Activities
  8. Chapter 8 Company Profiles
    1. 8.1. Iberdrola
      1. 8.1.1. Company Overview
      2. 8.1.2. Product/Service Portfolio
      3. 8.1.3. Iberdrola Sales, Revenue, and Gross Margin
      4. 8.1.4. Iberdrola Revenue and Growth Rate
      5. 8.1.5. Iberdrola Market Share
      6. 8.1.6. Recent Initiatives, Funding/VC Activities, and Technological Innovations
    2. 8.2. SMA Australia
      1. 8.2.1. Company Overview
      2. 8.2.2. Product/Service Portfolio
      3. 8.2.3. SMA Australia Sales, Revenue, and Gross Margin
      4. 8.2.4. SMA Australia Revenue and Growth Rate
      5. 8.2.5. SMA Australia Market Share
      6. 8.2.6. Recent Initiatives, Funding/VC Activities, and Technological Innovations
    3. 8.3. Landis+Gyr
      1. 8.3.1. Company Overview
      2. 8.3.2. Product/Service Portfolio
      3. 8.3.3. Landis+Gyr Sales, Revenue, and Gross Margin
      4. 8.3.4. Landis+Gyr Revenue and Growth Rate
      5. 8.3.5. Landis+Gyr Market Share
      6. 8.3.6. Recent Initiatives, Funding/VC Activities, and Technological Innovations
    4. 8.4. PayGo Energy
      1. 8.4.1. Company Overview
      2. 8.4.2. Product/Service Portfolio
      3. 8.4.3. PayGo Energy Sales, Revenue, and Gross Margin
      4. 8.4.4. PayGo Energy Revenue and Growth Rate
      5. 8.4.5. PayGo Energy Market Share
      6. 8.4.6. Recent Initiatives, Funding/VC Activities, and Technological Innovations
    5. 8.5. Conlog
      1. 8.5.1. Company Overview
      2. 8.5.2. Product/Service Portfolio
      3. 8.5.3. Conlog Sales, Revenue, and Gross Margin
      4. 8.5.4. Conlog Revenue and Growth Rate
      5. 8.5.5. Conlog Market Share
      6. 8.5.6. Recent Initiatives, Funding/VC Activities, and Technological Innovations
    6. 8.6. Secure Meters
      1. 8.6.1. Company Overview
      2. 8.6.2. Product/Service Portfolio
      3. 8.6.3. Secure Meters Sales, Revenue, and Gross Margin
      4. 8.6.4. Secure Meters Revenue and Growth Rate
      5. 8.6.5. Secure Meters Market Share
      6. 8.6.6. Recent Initiatives, Funding/VC Activities, and Technological Innovations
    7. 8.7. Eaton
      1. 8.7.1. Company Overview
      2. 8.7.2. Product/Service Portfolio
      3. 8.7.3. Eaton Sales, Revenue, and Gross Margin
      4. 8.7.4. Eaton Revenue and Growth Rate
      5. 8.7.5. Eaton Market Share
      6. 8.7.6. Recent Initiatives, Funding/VC Activities, and Technological Innovations
    8. 8.8. CAREL
      1. 8.8.1. Company Overview
      2. 8.8.2. Product/Service Portfolio
      3. 8.8.3. CAREL Sales, Revenue, and Gross Margin
      4. 8.8.4. CAREL Revenue and Growth Rate
      5. 8.8.5. CAREL Market Share
      6. 8.8.6. Recent Initiatives, Funding/VC Activities, and Technological Innovations
      7. 8.9. E.ON
      8. 8.9.1. Company Overview
      9. 8.9.2. Product/Service Portfolio
        1. 8.9.3. E.ON Sales, Revenue, and Gross Margin
        2. 8.9.4. E.ON Revenue and Growth Rate
        3. 8.9.5. E.ON Market Share
      10. 8.9.6. Recent Initiatives, Funding/VC Activities, and Technological Innovations
    9. 8.10. EDMI Limited
      1. 8.10.1. Company Overview
      2. 8.10.2. Product/Service Portfolio
      3. 8.10.3. EDMI Limited Sales, Revenue, and Gross Margin
      4. 8.10.4. EDMI Limited Revenue and Growth Rate
      5. 8.10.5. EDMI Limited Market Share
      6. 8.10.6. Recent Initiatives, Funding/VC Activities, and Technological Innovations
    10. 8.11. Hexing Electrical Company Ltd
      1. 8.11.1. Company Overview
      2. 8.11.2. Product/Service Portfolio
      3. 8.11.3. Hexing Electrical Company Ltd Sales, Revenue, and Gross Margin
      4. 8.11.4. Hexing Electrical Company Ltd Revenue and Growth Rate
      5. 8.11.5. Hexing Electrical Company Ltd Market Share
      6. 8.11.6. Recent Initiatives, Funding/VC Activities, and Technological Innovations
    11. 8.12. El Sewedy Electrometer Group
      1. 8.12.1. Company Overview
      2. 8.12.2. Product/Service Portfolio
      3. 8.12.3. El Sewedy Electrometer Group Sales, Revenue, and Gross Margin
      4. 8.12.4. El Sewedy Electrometer Group Revenue and Growth Rate
      5. 8.12.5. El Sewedy Electrometer Group Market Share
      6. 8.12.6. Recent Initiatives, Funding/VC Activities, and Technological Innovations
    12. 8.13. CIRCUTOR
      1. 8.13.1. Company Overview
      2. 8.13.2. Product/Service Portfolio
      3. 8.13.3. CIRCUTOR Sales, Revenue, and Gross Margin
      4. 8.13.4. CIRCUTOR Revenue and Growth Rate
      5. 8.13.5. CIRCUTOR Market Share
      6. 8.13.6. Recent Initiatives, Funding/VC Activities, and Technological Innovations
    13. 8.14. Holley Metering
      1. 8.14.1. Company Overview
      2. 8.14.2. Product/Service Portfolio
      3. 8.14.3. Holley Metering Sales, Revenue, and Gross Margin
      4. 8.14.4. Holley Metering Revenue and Growth Rate
      5. 8.14.5. Holley Metering Market Share
      6. 8.14.6. Recent Initiatives, Funding/VC Activities, and Technological Innovations
    14. 8.15. Elster GmbH
      1. 8.15.1. Company Overview
      2. 8.15.2. Product/Service Portfolio
      3. 8.15.3. Elster GmbH Sales, Revenue, and Gross Margin
      4. 8.15.4. Elster GmbH Revenue and Growth Rate
      5. 8.15.5. Elster GmbH Market Share
      6. 8.15.6. Recent Initiatives, Funding/VC Activities, and Technological Innovations
    15. 8.16. Exceleron
      1. 8.16.1. Company Overview
      2. 8.16.2. Product/Service Portfolio
      3. 8.16.3. Exceleron Sales, Revenue, and Gross Margin
      4. 8.16.4. Exceleron Revenue and Growth Rate
      5. 8.16.5. Exceleron Market Share
      6. 8.16.6. Recent Initiatives, Funding/VC Activities, and Technological Innovations
    16. 8.17. HCL
      1. 8.17.1. Company Overview
      2. 8.17.2. Product/Service Portfolio
      3. 8.17.3. HCL Sales, Revenue, and Gross Margin
      4. 8.17.4. HCL Revenue and Growth Rate
      5. 8.17.5. HCL Market Share
      6. 8.17.6. Recent Initiatives, Funding/VC Activities, and Technological Innovations
    17. 8.18. Itron Inc.
      1. 8.18.1. Company Overview
      2. 8.18.2. Product/Service Portfolio
      3. 8.18.3. Itron Inc. Sales, Revenue, and Gross Margin
      4. 8.18.4. Itron Inc. Revenue and Growth Rate
      5. 8.18.5. Itron Inc. Market Share
      6. 8.18.6. Recent Initiatives, Funding/VC Activities, and Technological Innovations
    18. 8.19. Siemens AG
      1. 8.19.1. Company Overview
      2. 8.19.2. Product/Service Portfolio
      3. 8.19.3. Siemens AG Sales, Revenue, and Gross Margin
      4. 8.19.4. Siemens AG Revenue and Growth Rate
      5. 8.19.5. Siemens AG Market Share
      6. 8.19.6. Recent Initiatives, Funding/VC Activities, and Technological Innovations
  9. Chapter 9 Energy Meter — Industry Analysis
    1. 9.1. Introduction and Taxonomy
    2. 9.2. Energy Meter Market – Key Trends
      1. 9.2.1. Market Drivers
      2. 9.2.2. Market Restraints
      3. 9.2.3. Market Opportunities
    3. 9.3. Value Chain Analysis
    4. 9.4. Key Mandates and Regulations
    5. 9.5. Technology Roadmap and Timeline
    6. 9.6. Energy Meter Market – Attractiveness Analysis
      1. 9.6.1. By Type
      2. 9.6.2. By Price
      3. 9.6.3. By Application
      4. 9.6.4. By Distribution Channel
      5. 9.6.5. By Region
  10. Chapter 10 Industrial Chain, Sourcing Strategy, and Downstream Buyers
    1. 10.1. Energy Meter Industrial Chain Analysis
    2. 10.2. Downstream Buyers
    3. 10.3. Distributors/Traders List
  11. Chapter 11 Marketing Strategy Analysis
    1. 11.1. Marketing Channel
    2. 11.2. Direct Marketing
    3. 11.3. Indirect Marketing
    4. 11.4. Marketing Channel Development Trends
    5. 11.5. Economic/Political Environmental Change
  12. Chapter 12 Report Conclusion & Key Insights
    1. 12.1. Key Insights from Primary Interviews & Surveys Respondents
    2. 12.2. Key Takeaways from Analysts, Consultants, and Industry Leaders
  13. Chapter 13 Research Approach & Methodology
    1. 13.1. Report Description
    2. 13.2. Research Scope
    3. 13.3. Research Methodology
      1. 13.3.1. Secondary Research
      2. 13.3.2. Primary Research
      3. 13.3.3. Statistical Models
        1. 13.3.3.1. Company Share Analysis Model
        2. 13.3.3.2. Revenue Based Modeling
      4. 13.3.4. Research Limitations

      List of Figures

      Fig.1	Product Picture of Energy Meter
      Fig.2	Global Energy Meter Market, 2016 – 2026 (USD Billion)
      Fig.3	Global Energy Meter Market Absolute Revenue Opportunity, 2016 – 2026 (USD Billion)
      Fig.4	Global Energy Meter Market Incremental Revenue Opportunity, 2020 – 2026 (USD Billion)
      Fig.5	Global Energy Meter Market Share, by Type, 2020 & 2026 (USD Billion)
      Fig.6	Global Electromechanical Meters Energy Meter Market, 2016 – 2026 (USD Billion)
      Fig.7	Global Electronic Meters Energy Meter Market, 2016 – 2026 (USD Billion)
      Fig.8	Global Energy Meter Market Share, by Price, 2020 & 2026 (USD Billion)
      Fig.9	Global Low Energy Meter Market, 2016 – 2026 (USD Billion)
      Fig.10	Global Medium Energy Meter Market, 2016 – 2026 (USD Billion)
      Fig.11	Global High Energy Meter Market, 2016 – 2026 (USD Billion)
      Fig.12	Global Energy Meter Market Share, by Application, 2020 & 2026 (USD Billion)
      Fig.13	Global Residential Energy Meter Market, 2016 – 2026 (USD Billion)
      Fig.14	Global Commercial Energy Meter Market, 2016 – 2026 (USD Billion)
      Fig.15	Global Industrial Energy Meter Market, 2016 – 2026 (USD Billion)
      Fig.16	Global Energy Meter Market Share, by Distribution Channel, 2020 & 2026 (USD Billion)
      Fig.17	Global Online Energy Meter Market, 2016 – 2026 (USD Billion)
      Fig.18	Global Offline Energy Meter Market, 2016 – 2026 (USD Billion)
      Fig.19	Global Energy Meter Market Share, by Region, 2020 & 2026 (USD Billion)
      Fig.20	North America Energy Meter Market, 2016 – 2026 (USD Billion)
      Fig.21	U.S. Energy Meter Market, 2016 – 2026 (USD Billion)
      Fig.22	Canada Energy Meter Market, 2016 – 2026 (USD Billion)
      Fig.23	Europe Energy Meter Market, 2016 – 2026 (USD Billion)
      Fig.24	Germany Energy Meter Market, 2016 – 2026 (USD Billion)
      Fig.25	France Energy Meter Market, 2016 – 2026 (USD Billion)
      Fig.26	U.K. Energy Meter Market, 2016 – 2026 (USD Billion)
      Fig.27	Italy Energy Meter Market, 2016 – 2026 (USD Billion)
      Fig.28	Spain Energy Meter Market, 2016 – 2026 (USD Billion)
      Fig.29	Rest of Europe Energy Meter Market, 2016 – 2026 (USD Billion)
      Fig.30	Asia Pacific Energy Meter Market, 2016 – 2026 (USD Billion)
      Fig.31	China Energy Meter Market, 2016 – 2026 (USD Billion)
      Fig.32	Japan Energy Meter Market, 2016 – 2026 (USD Billion)
      Fig.33	India Energy Meter Market, 2016 – 2026 (USD Billion)
      Fig.34	South  Korea Energy Meter Market, 2016 – 2026 (USD Billion)
      Fig.35	South-East Asia Energy Meter Market, 2016 – 2026 (USD Billion)
      Fig.36	Rest of Asia Pacific Energy Meter Market, 2016 – 2026 (USD Billion)
      Fig.37	Latin America Energy Meter Market, 2016 – 2026 (USD Billion)
      Fig.38	Brazil Energy Meter Market, 2016 – 2026 (USD Billion)
      Fig.39	Mexico Energy Meter Market, 2016 – 2026 (USD Billion)
      Fig.40	Rest of Latin America Energy Meter Market, 2016 – 2026 (USD Billion)
      Fig.41	The Middle-East and Africa Energy Meter Market, 2016 – 2026 (USD Billion)
      Fig.42	GCC Countries Energy Meter Market, 2016 – 2026 (USD Billion)
      Fig.43	South Africa Energy Meter Market, 2016 – 2026 (USD Billion)
      Fig.44	Rest of Middle-East Africa Energy Meter Market, 2016 – 2026 (USD Billion)
      Fig.45	Competitor Market Share – Revenue
      Fig.46	Iberdrola Revenue and Growth Rate
      Fig.47	Iberdrola Market Share
      Fig.48	SMA Australia Revenue and Growth Rate
      Fig.49	SMA Australia Market Share
      Fig.50	Landis+Gyr Revenue and Growth Rate
      Fig.51	Landis+Gyr Market Share
      Fig.52	PayGo Energy Revenue and Growth Rate
      Fig.53	PayGo Energy Market Share
      Fig.54	Conlog Revenue and Growth Rate
      Fig.55	Conlog Market Share
      Fig.56	Secure Meters Revenue and Growth Rate
      Fig.57	Secure Meters Market Share
      Fig.58	Eaton Revenue and Growth Rate
      Fig.59	Eaton Market Share
      Fig.60	CAREL Revenue and Growth Rate
      Fig.61	CAREL Market Share
      Fig.62	E.ON Revenue and Growth Rate
      Fig.63	E.ON Market Share
      Fig.64	EDMI Limited Revenue and Growth Rate
      Fig.65	EDMI Limited Market Share
      Fig.66	Hexing Electrical Company Ltd Revenue and Growth Rate
      Fig.67	Hexing Electrical Company Ltd Market Share
      Fig.68	El Sewedy Electrometer Group Revenue and Growth Rate
      Fig.69	El Sewedy Electrometer Group Market Share
      Fig.70	CIRCUTOR Revenue and Growth Rate
      Fig.71	CIRCUTOR Market Share
      Fig.72	Holley Metering Revenue and Growth Rate
      Fig.73	Holley Metering Market Share
      Fig.74	Elster GmbH Revenue and Growth Rate
      Fig.75	Elster GmbH Market Share
      Fig.76	Exceleron Revenue and Growth Rate
      Fig.77	Exceleron Market Share
      Fig.78	HCL Revenue and Growth Rate
      Fig.79	HCL Market Share
      Fig.80	Itron Inc. Revenue and Growth Rate
      Fig.81	Itron Inc. Market Share
      Fig.82	Siemens AG Revenue and Growth Rate
      Fig.83	Siemens AG Market Share
      Fig.84	Market Dynamics
      Fig.85	Global Energy Meter – Value Chain Analysis
      Fig.86	Key Mandates and Regulations
      Fig.87	Technology Roadmap and Timeline
      Fig.88	Market Attractiveness Analysis – By Type
      Fig.89	Market Attractiveness Analysis – By Price
      Fig.90	Market Attractiveness Analysis – By Application
      Fig.91	Market Attractiveness Analysis – By Distribution Channel
      Fig.92	Market Attractiveness Analysis – By Region
      Fig.93	Energy Meter Industrial Chain Analysis
      Fig.94	Market Channels
      Fig.95	Marketing Channel Development Trend
      Fig.96	Growth in World Gross Product, 2008-2018
      

      List of Tables

      	
      Table 1	Global Energy Meter Market, 2020 & 2026 (USD Billion)
      Table 2	Global Energy Meter Market, by Type, 2016 – 2026 (USD Billion)
      Table 3	Global Energy Meter Market, by Price, 2016 – 2026 (USD Billion)
      Table 4	Global Energy Meter Market, by Application, 2016 – 2026 (USD Billion)
      Table 5	Global Energy Meter Market, by Distribution Channel, 2016 – 2026 (USD Billion)
      Table 6	Global Energy Meter Market, by Region, 2016 – 2026 (USD Billion)
      Table 7	North America Energy Meter Market, by Country, 2016 – 2026 (USD Billion)
      Table 8	North America Energy Meter Market, by Type, 2016 – 2026 (USD Billion)
      Table 9	North America Energy Meter Market, by Price, 2016 – 2026 (USD Billion)
      Table 10 North America Energy Meter Market, by Application, 2016 – 2026 (USD Billion)
      Table 11 North America Energy Meter Market, by Distribution Channel, 2016 – 2026 (USD Billion)
      Table 12 Europe Energy Meter Market, by Country, 2016 – 2026 (USD Billion)
      Table 13 Europe Energy Meter Market, by Type, 2016 – 2026 (USD Billion)
      Table 14 Europe Energy Meter Market, by Price, 2016 – 2026 (USD Billion)
      Table 15 Europe Energy Meter Market, by Application, 2016 – 2026 (USD Billion)
      Table 16 Europe Energy Meter Market, by Distribution Channel, 2016 – 2026 (USD Billion)
      Table 17 Asia Pacific Energy Meter Market, by Country, 2016 – 2026 (USD Billion)
      Table 18 Asia Pacific Energy Meter Market, by Type, 2016 – 2026 (USD Billion)
      Table 19 Asia Pacific Energy Meter Market, by Price, 2016 – 2026 (USD Billion)
      Table 20 Asia Pacific Energy Meter Market, by Application, 2016 – 2026 (USD Billion)
      Table 21 Asia Pacific Energy Meter Market, by Distribution Channel, 2016 – 2026 (USD Billion)
      Table 22 Latin America Energy Meter Market, by Country, 2016 – 2026 (USD Billion)
      Table 23 Latin America Energy Meter Market, by Type, 2016 – 2026 (USD Billion)
      Table 24 Latin America Energy Meter Market, by Price, 2016 – 2026 (USD Billion)
      Table 25 Latin America Energy Meter Market, by Application, 2016 – 2026 (USD Billion)
      Table 26 Latin America Energy Meter Market, by Distribution Channel, 2016 – 2026 (USD Billion)
      Table 27 The Middle-East and Africa Energy Meter Market, by Country, 2016 – 2026 (USD Billion)
      Table 28 The Middle-East and Africa Energy Meter Market, by Type, 2016 – 2026 (USD Billion)
      Table 29 The Middle-East and Africa Energy Meter Market, by Price, 2016 – 2026 (USD Billion)
      Table 30 The Middle-East and Africa Energy Meter Market, by Application, 2016 – 2026 (USD Billion)
      Table 31 The Middle-East and Africa Energy Meter Market, by Distribution Channel, 2016 – 2026 (USD Billion)
      Table 32 Global Energy Meter Market - Company Revenue Analysis, 2016 – 2020 (USD Billion)
      Table 33 Global Energy Meter Market - Company Revenue Share Analysis, 2016 – 2020 (%)
      Table 34 Acquisitions and Mergers
      Table 35 Market Drivers – Impact Analysis
      Table 36 Market Restraints
      Table 37 Market Opportunities
      Table 38 Major Buyers of Energy Meter
      Table 39 Distributors/Traders of Energy Meter by Region
      

Industry Major Market Players

  • Iberdrola
  • SMA Australia
  • Landis+Gyr
  • PayGo Energy
  • Conlog
  • Secure Meters
  • Eaton
  • CAREL
  • E.ON
  • EDMI Limited
  • Hexing Electrical Company Ltd
  • El Sewedy Electrometer Group
  • CIRCUTOR
  • Holley Metering
  • Elster GmbH
  • Exceleron
  • HCL
  • Itron Inc.
  • Siemens AG