Search Market Research Report

Discover Our Latest Reports
Discover Our Featured Reports
Discover Top Selling Reports

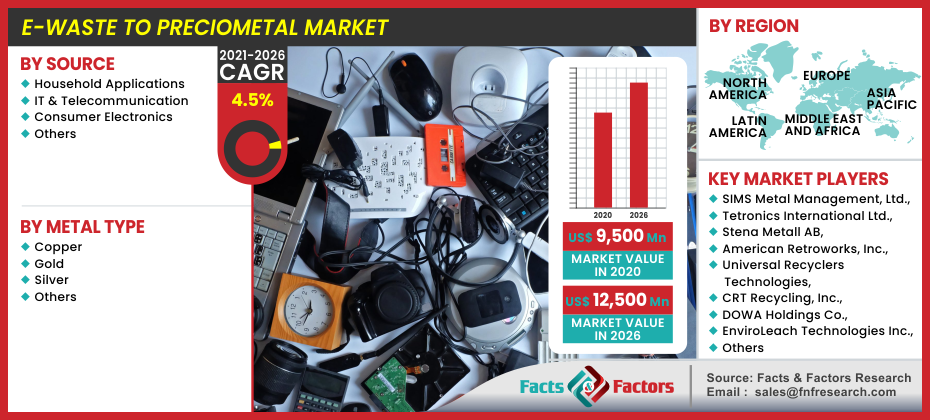
E-Waste to Preciometal Market Size, Share Global Analysis Report, , 2021 – 2026

report img

E-Waste to Preciometal Market By Source (Household Appliances, IT & Telecommunication, Consumer Electronics, & Others), By Metal Type (Copper, Gold, Silver, & Others), and By Regions: Global Industry Perspective, Comprehensive Analysis, and Forecast, 2021 – 2026

Industry Insights

[173+ Pages Report] As per the latest research and survey report issued by Facts and Factors, the global E-Waste to Preciometal Market was valued at around USD 9,500 Million in 2020 and is expected to register revenues worth USD 12,500 Million by the end of 2026, growing at an exceptional CAGR of approximately 4.5% between 2021 and 2026.

logoMarket Overview

Electronic waste is becoming a constant industrial hazard because of a sudden uptake of consumption of electronic devices. However, safe disposal of such materials becomes quite challenging. Precious metals are used in a variety of application, especially electrical-based devices. Their common applications include PCBs of mobile and computers, motherboards, connectors of various kinds, and so on. Their functionality depends on the ability to carry low-ampere current, high sensitivity unlike corrosion and thus, make their use cases highly application based.

logoIndustry Growth Factors

Health concerns related to incinerating e-waste and growing environmental concerns are the major factors governing the growth of e-waste to Preciometal market. A high rise of surge in consumer electronic across a wide variety of application has led to greater collection of e-waste. Additionally, government bodies across various country, OEM’s, and non-profit organizations have begun scaling campaigns and incentives to propel the market growth for e-waste to Preciometal by including monetary relief.

E-Waste to Preciometal Market

To know more about this report | Request Free Sample Copy

An increased need for precious metals such as copper, gold, silver, platinum, and palladium has been observed from an increase in use from their application. Copper is used extensively in communication-based applications as well as in the electrical and thermal sector. However, a serious regard of lack of disposal infrastructures and a smaller number of e-waste collection centers are likely to hinder the growth of the market. Furthermore, due to less advanced technological steps, a decayed paced of recycling and few policies regarding monetary relief are likely to hinder the growth of the e-waste to Preciometal market.

logoSegmentation Analysis

The global e-waste to Preciometal market is segregated based on source, metal type, and regions.

On the basis of source, the e-waste to Preciometal market can be segmented across household applications, IT & telecommunication, consumer electronics, and others. The other subsegment can be further categorized into medical & industrial tools. The household application will account for the largest market share during the forecast period owing to a great deal of electronics come accumulated from this sector. Household applications include device that assist in tasks such as cooking, cleaning, and food conservation. Such devices are regularly discarded which pushed the market share to a greater extent. On the basis of, the e-waste to Preciometal market can be segmented across copper, gold, silver, and others. Copper occupies the largest market share in the subcategory owing to an extensive use case scenario in various sectors such as infrastructure, power transmission, and electronic manufacturing, among others. Copper is also the main ingredient used in wiring and plumbing application which pushed the market value in the category to rise to a high level.

logoReport Scope

Report Attribute

Details

Market Size in 2020/td>

USD 9,500 Million

Projected Market Size in 2026

USD 12,500 Million

CAGR Growth Rate

4.5% CAGR

Base Year

2020

Forecast Years

2021-2026

Key Market Players

SIMS Metal Management, Ltd., Tetronics International Ltd.,  Stena Metall AB, American Retroworks, Inc., Universal Recyclers Technologies, CRT Recycling, Inc., DOWA Holdings Co., EnviroLeach Technologies Inc., and Umicore NV, among others.

Key Segment

By Source, Metal, and Region

Major Regions Covered

North America, Europe, Asia Pacific, Latin America, and the Middle East & Africa

Purchase Options

Request customized purchase options to meet your research needs.Explore purchase options

logo Regional Analysis

The region of Asia-Pacific is expected to witness the highest market value during the forecast period. Stringent policies and regulation regarding disposal of e-waste plays a big role in driving the market value in the region. Additional factors such as ease of availability of cheap labor and raw material further help achieve a huge foothold. With a larger market cap, firms in the region have limited pollution which makes the region the most exclusive destination for the market.

Europe ranks in second with regards to revenue generation as the EU enforced a directive of Waste Electrical and Electronic Equipment (WEEE) Directive, among other. The following initiative takes aim at reducing electronic waste and maximizes the use of reusable materials for similar applications.

logo Competitive Players

Some main participants of the global market are e-waste to Preciometal market are :

  • SIMS Metal Management Ltd.
  •  Tetronics International Ltd.
  •   Stena Metall AB
  •  American Retroworks Inc.
  •  Universal Recyclers Technologies
  •  CRT Recycling Inc.
  •  DOWA Holdings Co.
  •  EnviroLeach Technologies Inc.
  •   Umicore NV

logo By Source Segment Analysis

  • Household Applications
  • IT & Telecommunication
  • Consumer Electronics
  • Others

logo By Metal Type Segment Analysis

  • Copper
  • Gold
  • Silver
  • Others

logo By Regional Segment Analysis

  • North America
    • U.S.
    • Canada
  • Europe
    • UK
    • France
    • Germany
    • Italy
    • Spain
    • Rest of Europe
  • Asia Pacific
    • China
    • Japan
    • India
    • South Korea
    • Southeast Asia
    • Rest of Asia Pacific
  • Latin America
    • Brazil
    • Mexico
    • Rest of Latin America
  • Middle East and Africa
    • GCC Countries
    • South Africa
    • Rest of MEA

Table of Content

  1. Chapter 1 Executive Summary
    1. 1.1. Introduction of E-Waste to Preciometal
    2. 1.2. Global E-Waste to Preciometal Market, 2020 & 2026 (USD Million)
    3. 1.3. Global E-Waste to Preciometal Market, 2016 – 2026 (USD Million) (Tons)
    4. 1.4. Global E-Waste to Preciometal Market Absolute Revenue Opportunity, 2016 – 2026 (USD Million)
    5. 1.5. Global E-Waste to Preciometal Market Incremental Revenue Opportunity, 2021 – 2026 (USD Million)
  2. Chapter 2 E-Waste to Preciometal Market – Source Analysis
    1. 2.1. Global E-Waste to Preciometal Market – Source Overview
    2. 2.2. Global E-Waste to Preciometal Market Share, by Source, 2020 & 2026 (USD Million)
    3. 2.3. Global E-Waste to Preciometal Market share, by Source, 2020 & 2026 (Tons)
    4. 2.4. Household Applications
      1. 2.4.1. Global Household Applications E-Waste to Preciometal Market, 2016 – 2026 (USD Million)
      2. 2.4.2. Global Household Applications E-Waste to Preciometal Market, 2016 – 2026 (Tons)
    5. 2.5. IT & Telecommunication
      1. 2.5.1. Global IT & Telecommunication E-Waste to Preciometal Market, 2016 – 2026 (USD Million)
      2. 2.5.2. Global IT & Telecommunication E-Waste to Preciometal Market, 2016 – 2026 (Tons)
    6. 2.6. Consumer Electronics
      1. 2.6.1. Global Consumer Electronics E-Waste to Preciometal Market, 2016 – 2026 (USD Million)
      2. 2.6.2. Global Consumer Electronics E-Waste to Preciometal Market, 2016 – 2026 (Tons)
    7. 2.7. Others
      1. 2.7.1. Global Others E-Waste to Preciometal Market, 2016 – 2026 (USD Million)
      2. 2.7.2. Global Others E-Waste to Preciometal Market, 2016 – 2026 (Tons)
  3. Chapter 3 E-Waste to Preciometal Market – Metal Type Analysis
    1. 3.1. Global E-Waste to Preciometal Market – Metal Type Overview
    2. 3.2. Global E-Waste to Preciometal Market Share, by Metal Type , 2020 & 2026 (USD Million)
    3. 3.3. Global E-Waste to Preciometal Market share, by Metal Type , 2020 & 2026 (Tons)
    4. 3.4. Copper
      1. 3.4.1. Global Copper E-Waste to Preciometal Market, 2016 – 2026 (USD Million)
      2. 3.4.2. Global Copper E-Waste to Preciometal Market, 2016 – 2026 (Tons)
    5. 3.5. Gold
      1. 3.5.1. Global Gold E-Waste to Preciometal Market, 2016 – 2026 (USD Million)
      2. 3.5.2. Global Gold E-Waste to Preciometal Market, 2016 – 2026 (Tons)
    6. 3.6. Silver
      1. 3.6.1. Global Silver E-Waste to Preciometal Market, 2016 – 2026 (USD Million)
      2. 3.6.2. Global Silver E-Waste to Preciometal Market, 2016 – 2026 (Tons)
    7. 3.7. Others
      1. 3.7.1. Global Others E-Waste to Preciometal Market, 2016 – 2026 (USD Million)
      2. 3.7.2. Global Others E-Waste to Preciometal Market, 2016 – 2026 (Tons)
  4. Chapter 4 E-Waste to Preciometal Market – Regional Analysis
    1. 4.1. Global E-Waste to Preciometal Market Regional Overview
    2. 4.2. Global E-Waste to Preciometal Market Share, by Region, 2020 & 2026 (USD Million)
    3. 4.3. Global E-Waste to Preciometal Market Share, by Region, 2020 & 2026 (Tons)
    4. 4.4. North America
      1. 4.4.1. North America E-Waste to Preciometal Market, 2016 – 2026 (USD Million)
        1. 4.4.1.1. North America E-Waste to Preciometal Market, by Country, 2016 – 2026 (USD Million)
      2. 4.4.2. North America Market, 2016 – 2026 (Tons)
        1. 4.4.2.1. North America E-Waste to Preciometal Market, by Country, 2016 – 2026 (Tons)
      3. 4.4.3. North America E-Waste to Preciometal Market, by Source, 2016 – 2026
        1. 4.4.3.1. North America E-Waste to Preciometal Market, by Source, 2016 – 2026 (USD Million)
        2. 4.4.3.2. North America E-Waste to Preciometal Market, by Source, 2016 – 2026 (Tons)
      4. 4.4.4. North America E-Waste to Preciometal Market, by Metal Type , 2016 – 2026
        1. 4.4.4.1. North America E-Waste to Preciometal Market, by Metal Type , 2016 – 2026 (USD Million)
        2. 4.4.4.2. North America E-Waste to Preciometal Market, by Metal Type , 2016 – 2026 (Tons)
      5. 4.4.5. U.S.
        1. 4.4.5.1. U.S. E-Waste to Preciometal Market, 2016 – 2026 (USD Million)
        2. 4.4.5.2. U.S. E-Waste to Preciometal Market, 2016 – 2026 (Tons)
      6. 4.4.6. Canada
        1. 4.4.6.1. Canada E-Waste to Preciometal Market, 2016 – 2026 (USD Million)
        2. 4.4.6.2. Canada E-Waste to Preciometal Market, 2016 – 2026 (Tons)
    5. 4.5. Europe
      1. 4.5.1. Europe E-Waste to Preciometal Market, 2016 – 2026 (USD Million)
        1. 4.5.1.1. Europe E-Waste to Preciometal Market, by Country, 2016 – 2026 (USD Million)
      2. 4.5.2. Europe Market, 2016 – 2026 (Tons)
        1. 4.5.2.1. Europe E-Waste to Preciometal Market, by Country, 2016 – 2026 (Tons)
      3. 4.5.3. Europe E-Waste to Preciometal Market, by Source, 2016 – 2026
        1. 4.5.3.1. Europe E-Waste to Preciometal Market, by Source, 2016 – 2026 (USD Million)
        2. 4.5.3.2. Europe E-Waste to Preciometal Market, by Source, 2016 – 2026 (Tons)
      4. 4.5.4. Europe E-Waste to Preciometal Market, by Metal Type , 2016 – 2026
        1. 4.5.4.1. Europe E-Waste to Preciometal Market, by Metal Type , 2016 – 2026 (USD Million)
        2. 4.5.4.2. Europe E-Waste to Preciometal Market, by Metal Type , 2016 – 2026 (Tons)
      5. 4.5.5. Germany
        1. 4.5.5.1. Germany E-Waste to Preciometal Market, 2016 – 2026 (USD Million)
        2. 4.5.5.2. Germany E-Waste to Preciometal Market, 2016 – 2026 (Tons)
      6. 4.5.6. France
        1. 4.5.6.1. France E-Waste to Preciometal Market, 2016 – 2026 (USD Million)
        2. 4.5.6.2. France E-Waste to Preciometal Market, 2016 – 2026 (Tons)
      7. 4.5.7. U.K.
        1. 4.5.7.1. U.K. E-Waste to Preciometal Market, 2016 – 2026 (USD Million)
        2. 4.5.7.2. U.K. E-Waste to Preciometal Market, 2016 – 2026 (Tons)
      8. 4.5.8. Italy
        1. 4.5.8.1. Italy E-Waste to Preciometal Market, 2016 – 2026 (USD Million)
        2. 4.5.8.2. Italy E-Waste to Preciometal Market, 2016 – 2026 (Tons)
      9. 4.5.9. Spain
        1. 4.5.9.1. Spain E-Waste to Preciometal Market, 2016 – 2026 (USD Million)
        2. 4.5.9.2. Spain E-Waste to Preciometal Market, 2016 – 2026 (Tons)
      10. 4.5.10. Rest of Europe
        1. 4.5.10.1. Rest of Europe E-Waste to Preciometal Market, 2016 – 2026 (USD Million)
        2. 4.5.10.2. Rest of Europe E-Waste to Preciometal Market, 2016 – 2026 (Tons)
    6. 4.6. Asia Pacific
      1. 4.6.1. Asia Pacific E-Waste to Preciometal Market, 2016 – 2026 (USD Million)
        1. 4.6.1.1. Asia Pacific E-Waste to Preciometal Market, by Country, 2016 – 2026 (USD Million)
      2. 4.6.2. Asia Pacific Market, 2016 – 2026 (Tons)
        1. 4.6.2.1. Asia Pacific E-Waste to Preciometal Market, by Country, 2016 – 2026 (Tons)
      3. 4.6.3. Asia Pacific E-Waste to Preciometal Market, by Source, 2016 – 2026
        1. 4.6.3.1. Asia Pacific E-Waste to Preciometal Market, by Source, 2016 – 2026 (USD Million)
        2. 4.6.3.2. Asia Pacific E-Waste to Preciometal Market, by Source, 2016 – 2026 (Tons)
      4. 4.6.4. Asia Pacific E-Waste to Preciometal Market, by Metal Type , 2016 – 2026
        1. 4.6.4.1. Asia Pacific E-Waste to Preciometal Market, by Metal Type , 2016 – 2026 (USD Million)
        2. 4.6.4.2. Asia Pacific E-Waste to Preciometal Market, by Metal Type , 2016 – 2026 (Tons)
      5. 4.6.5. China
        1. 4.6.5.1. China E-Waste to Preciometal Market, 2016 – 2026 (USD Million)
        2. 4.6.5.2. China E-Waste to Preciometal Market, 2016 – 2026 (Tons)
      6. 4.6.6. Japan
        1. 4.6.6.1. Japan E-Waste to Preciometal Market, 2016 – 2026 (USD Million)
        2. 4.6.6.2. Japan E-Waste to Preciometal Market, 2016 – 2026 (Tons)
      7. 4.6.7. India
        1. 4.6.7.1. India E-Waste to Preciometal Market, 2016 – 2026 (USD Million)
        2. 4.6.7.2. India E-Waste to Preciometal Market, 2016 – 2026 (Tons)
      8. 4.6.8. South Korea
        1. 4.6.8.1. South Korea E-Waste to Preciometal Market, 2016 – 2026 (USD Million)
        2. 4.6.8.2. South Korea E-Waste to Preciometal Market, 2016 – 2026 (Tons)
      9. 4.6.9. South-East Asia
        1. 4.6.9.1. South-East Asia E-Waste to Preciometal Market, 2016 – 2026 (USD Million)
        2. 4.6.9.2. South-East Asia E-Waste to Preciometal Market, 2016 – 2026 (Tons)
      10. 4.6.10. Rest of Asia Pacific
        1. 4.6.10.1. Rest of Asia Pacific E-Waste to Preciometal Market, 2016 – 2026 (USD Million)
        2. 4.6.10.2. Rest of Asia Pacific E-Waste to Preciometal Market, 2016 – 2026 (Tons)
    7. 4.7. Latin America
      1. 4.7.1. Latin America E-Waste to Preciometal Market, 2016 – 2026 (USD Million)
        1. 4.7.1.1. Latin America E-Waste to Preciometal Market, by Country, 2016 – 2026 (USD Million)
      2. 4.7.2. Latin America Market, 2016 – 2026 (Tons)
        1. 4.7.2.1. Latin America E-Waste to Preciometal Market, by Country, 2016 – 2026 (Tons)
      3. 4.7.3. Latin America E-Waste to Preciometal Market, by Source, 2016 – 2026
        1. 4.7.3.1. Latin America E-Waste to Preciometal Market, by Source, 2016 – 2026 (USD Million)
        2. 4.7.3.2. Latin America E-Waste to Preciometal Market, by Source, 2016 – 2026 (Tons)
      4. 4.7.4. Latin America E-Waste to Preciometal Market, by Metal Type , 2016 – 2026
        1. 4.7.4.1. Latin America E-Waste to Preciometal Market, by Metal Type , 2016 – 2026 (USD Million)
        2. 4.7.4.2. Latin America E-Waste to Preciometal Market, by Metal Type , 2016 – 2026 (Tons)
      5. 4.7.5. Brazil
        1. 4.7.5.1. Brazil E-Waste to Preciometal Market, 2016 – 2026 (USD Million)
        2. 4.7.5.2. Brazil E-Waste to Preciometal Market, 2016 – 2026 (Tons)
      6. 4.7.6. Mexico
        1. 4.7.6.1. Mexico E-Waste to Preciometal Market, 2016 – 2026 (USD Million)
        2. 4.7.6.2. Mexico E-Waste to Preciometal Market, 2016 – 2026 (Tons)
      7. 4.7.7. Rest of Latin America
        1. 4.7.7.1. Rest of Latin America E-Waste to Preciometal Market, 2016 – 2026 (USD Million)
        2. 4.7.7.2. Rest of Latin America E-Waste to Preciometal Market, 2016 – 2026 (Tons)
    8. 4.8. The Middle-East and Africa
      1. 4.8.1. The Middle-East and Africa E-Waste to Preciometal Market, 2016 – 2026 (USD Million)
        1. 4.8.1.1. The Middle-East and Africa E-Waste to Preciometal Market, by Country, 2016 – 2026 (USD Million)
      2. 4.8.2. The Middle-East and Africa Market, 2016 – 2026 (Tons)
        1. 4.8.2.1. The Middle-East and Africa E-Waste to Preciometal Market, by Country, 2016 – 2026 (Tons)
      3. 4.8.3. The Middle-East and Africa E-Waste to Preciometal Market, by Source, 2016 – 2026
        1. 4.8.3.1. The Middle-East and Africa E-Waste to Preciometal Market, by Source, 2016 – 2026 (USD Million)
        2. 4.8.3.2. The Middle-East and Africa E-Waste to Preciometal Market, by Source, 2016 – 2026 (Tons)
      4. 4.8.4. The Middle-East and Africa E-Waste to Preciometal Market, by Metal Type , 2016 – 2026
        1. 4.8.4.1. The Middle-East and Africa E-Waste to Preciometal Market, by Metal Type , 2016 – 2026 (USD Million)
        2. 4.8.4.2. The Middle-East and Africa E-Waste to Preciometal Market, by Metal Type , 2016 – 2026 (Tons)
      5. 4.8.5. GCC Countries
        1. 4.8.5.1. GCC Countries E-Waste to Preciometal Market, 2016 – 2026 (USD Million)
        2. 4.8.5.2. GCC Countries E-Waste to Preciometal Market, 2016 – 2026 (Tons)
      6. 4.8.6. South Africa
        1. 4.8.6.1. South Africa E-Waste to Preciometal Market, 2016 – 2026 (USD Million)
        2. 4.8.6.2. South Africa E-Waste to Preciometal Market, 2016 – 2026 (Tons)
      7. 4.8.7. Rest of Middle-East Africa
        1. 4.8.7.1. Rest of Middle-East Africa E-Waste to Preciometal Market, 2016 – 2026 (USD Million)
        2. 4.8.7.2. Rest of Middle-East Africa E-Waste to Preciometal Market, 2016 – 2026 (Tons)
  5. Chapter 5 E-Waste to Preciometal Production, Consumption, Export, Import by Regions
    1. 5.1. Global E-Waste to Preciometal Production and Consumption, 2016 – 2026 (Tons)
    2. 5.2. Global Import and Export Analysis, by Region
  6. Chapter 6 E-Waste to Preciometal Market – Competitive Landscape
    1. 6.1. Competitor Market Share – Revenue
    2. 6.2. Market Concentration Rate Analysis, Top 3 and Top 5 Players
    3. 6.3. Competitor Market Share – Volume
    4. 6.4. Strategic Developments
      1. 6.4.1. Acquisitions and Mergers
      2. 6.4.2. New Products
      3. 6.4.3. Research & Development Activities
  7. Chapter 7 Company Profiles
    1. 7.1. SIMS Metal Management, Ltd.
      1. 7.1.1. Company Overview
      2. 7.1.2. Product/Service Portfolio
      3. 7.1.3. SIMS Metal Management, Ltd. Sales, Revenue, Price, and Gross Margin
      4. 7.1.4. SIMS Metal Management, Ltd. Revenue and Growth Rate
      5. 7.1.5. SIMS Metal Management, Ltd. Market Share
      6. 7.1.6. Recent Initiatives, Funding/VC Activities, and Technological Innovations
    2. 7.2. Tetronics International Ltd.
      1. 7.2.1. Company Overview
      2. 7.2.2. Product/Service Portfolio
      3. 7.2.3. Tetronics International Ltd. Sales, Revenue, Price, and Gross Margin
      4. 7.2.4. Tetronics International Ltd. Revenue and Growth Rate
      5. 7.2.5. Tetronics International Ltd. Market Share
      6. 7.2.6. Recent Initiatives, Funding/VC Activities, and Technological Innovations
    3. 7.3. Stena Metall AB
      1. 7.3.1. Company Overview
      2. 7.3.2. Product/Service Portfolio
      3. 7.3.3. Stena Metall AB Sales, Revenue, Price, and Gross Margin
      4. 7.3.4. Stena Metall AB Revenue and Growth Rate
      5. 7.3.5. Stena Metall AB Market Share
      6. 7.3.6. Recent Initiatives, Funding/VC Activities, and Technological Innovations
    4. 7.4. American Retroworks, Inc.
      1. 7.4.1. Company Overview
      2. 7.4.2. Product/Service Portfolio
      3. 7.4.3. American Retroworks, Inc. Sales, Revenue, Price, and Gross Margin
      4. 7.4.4. American Retroworks, Inc. Revenue and Growth Rate
      5. 7.4.5. American Retroworks, Inc. Market Share
      6. 7.4.6. Recent Initiatives, Funding/VC Activities, and Technological Innovations
    5. 7.5. Universal Recyclers Technologies
      1. 7.5.1. Company Overview
      2. 7.5.2. Product/Service Portfolio
      3. 7.5.3. Universal Recyclers Technologies Sales, Revenue, Price, and Gross Margin
      4. 7.5.4. Universal Recyclers Technologies Revenue and Growth Rate
      5. 7.5.5. Universal Recyclers Technologies Market Share
      6. 7.5.6. Recent Initiatives, Funding/VC Activities, and Technological Innovations
    6. 7.6. CRT Recycling, Inc.
      1. 7.6.1. Company Overview
      2. 7.6.2. Product/Service Portfolio
      3. 7.6.3. CRT Recycling, Inc. Sales, Revenue, Price, and Gross Margin
      4. 7.6.4. CRT Recycling, Inc. Revenue and Growth Rate
      5. 7.6.5. CRT Recycling, Inc. Market Share
      6. 7.6.6. Recent Initiatives, Funding/VC Activities, and Technological Innovations
    7. 7.7. DOWA Holdings Co.
      1. 7.7.1. Company Overview
      2. 7.7.2. Product/Service Portfolio
      3. 7.7.3. DOWA Holdings Co. Sales, Revenue, Price, and Gross Margin
      4. 7.7.4. DOWA Holdings Co. Revenue and Growth Rate
      5. 7.7.5. DOWA Holdings Co. Market Share
      6. 7.7.6. Recent Initiatives, Funding/VC Activities, and Technological Innovations
    8. 7.8. EnviroLeach Technologies Inc.
      1. 7.8.1. Company Overview
      2. 7.8.2. Product/Service Portfolio
      3. 7.8.3. EnviroLeach Technologies Inc. Sales, Revenue, Price, and Gross Margin
      4. 7.8.4. EnviroLeach Technologies Inc. Revenue and Growth Rate
      5. 7.8.5. EnviroLeach Technologies Inc. Market Share
      6. 7.8.6. Recent Initiatives, Funding/VC Activities, and Technological Innovations
    9. 7.9. Umicore NV
      1. 7.9.1. Company Overview
      2. 7.9.2. Product/Service Portfolio
      3. 7.9.3. Umicore NV Sales, Revenue, Price, and Gross Margin
      4. 7.9.4. Umicore NV Revenue and Growth Rate
      5. 7.9.5. Umicore NV Market Share
      6. 7.9.6. Recent Initiatives, Funding/VC Activities, and Technological Innovations
    10. 7.10. Others
      1. 7.10.1. Company Overview
      2. 7.10.2. Product/Service Portfolio
      3. 7.10.3. Others Sales, Revenue, Price, and Gross Margin
      4. 7.10.4. Others Revenue and Growth Rate
      5. 7.10.5. Others Market Share
      6. 7.10.6. Recent Initiatives, Funding/VC Activities, and Technological Innovations
  8. Chapter 8 E-Waste to Preciometal — Industry Analysis
    1. 8.1. Introduction and Taxonomy
    2. 8.2. E-Waste to Preciometal Market – Key Trends
      1. 8.2.1. Market Drivers
      2. 8.2.2. Market Restraints
      3. 8.2.3. Market Opportunities
    3. 8.3. Value Chain Analysis
    4. 8.4. Key Mandates and Regulations
    5. 8.5. Technology Roadmap and Timeline
    6. 8.6. E-Waste to Preciometal Market – Attractiveness Analysis
      1. 8.6.1. By Source
      2. 8.6.2. By Metal Type
      3. 8.6.3. By Region
  9. Chapter 9 Raw Material Analysis
    1. 9.1. E-Waste to Preciometal Key Raw Material Analysis
      1. 9.1.1. Key Raw Materials
      2. 9.1.2. Price Trend of Key Raw Materials
    2. 9.2. Key Suppliers of Raw Materials
    3. 9.3. Proportion of Manufacturing Cost Structure
      1. 9.3.1. Raw Materials Cost
      2. 9.3.2. Labor Cost
      3. 9.3.3. Manufacturing Expenses
      4. 9.3.4. Miscellaneous Expenses
    4. 9.4. Manufacturing Cost Analysis of E-Waste to Preciometal
  10. Chapter 10 Industrial Chain, Sourcing Strategy, and Downstream Buyers
    1. 10.1. E-Waste to Preciometal Industrial Chain Analysis
    2. 10.2. Upstream Raw Materials Sourcing
      1. 10.2.1. Risk Mitigation:
      2. 10.2.2. Supplier Relationships:
      3. 10.2.3. Business Processes:
      4. 10.2.4. Securing the Product:
    3. 10.3. Raw Materials Sources of E-Waste to Preciometal Major Manufacturers
    4. 10.4. Downstream Buyers
    5. 10.5. Distributors/Traders List
  11. Chapter 11 Marketing Strategy Analysis, Distributors
    1. 11.1. Marketing Channel
    2. 11.2. Direct Marketing
    3. 11.3. Indirect Marketing
    4. 11.4. Marketing Channel Development Trends
    5. 11.5. Economic/Political Environmental Change
  12. Chapter 12 Report Conclusion & Key Insights
    1. 12.1. Key Insights from Primary Interviews & Surveys Respondents
    2. 12.2. Key Takeaways from Analysts, Consultants, and Industry Leaders
  13. Chapter 13 Research Approach & Methodology
    1. 13.1. Report Description
    2. 13.2. Research Scope
    3. 13.3. Research Methodology
      1. 13.3.1. Secondary Research
      2. 13.3.2. Primary Research
      3. 13.3.3. Statistical Models
        1. 13.3.3.1. Company Share Analysis Model
        2. 13.3.3.2. Revenue Based Modeling
      4. 13.3.4. Research Limitations

      List of Figures

      Fig.1	Product Picture of E-Waste to Preciometal
      Fig.2	Global E-Waste to Preciometal Market, 2016 – 2026 (USD Million)
      Fig.3	Global E-Waste to Preciometal Market, 2016 – 2026 (Tons)
      Fig.4	Global E-Waste to Preciometal Market Absolute Revenue Opportunity, 2016 – 2026 (USD Million)
      Fig.5	Global E-Waste to Preciometal Market Incremental Revenue Opportunity, 2021 – 2026 (USD Million)
      Fig.6	Global E-Waste to Preciometal Market Share, by Source, 2020 & 2026 (USD Million)
      Fig.7	Global E-Waste to Preciometal Market Share, by Source, 2020 & 2026 (Tons)
      Fig.8	Global Household Applications E-Waste to Preciometal Market, 2016 – 2026 (USD Million)
      Fig.9	Global Household Applications E-Waste to Preciometal Market, 2016 – 2026 (Tons)
      Fig.10	Global IT & Telecommunication E-Waste to Preciometal Market, 2016 – 2026 (USD Million)
      Fig.11	Global IT & Telecommunication E-Waste to Preciometal Market, 2016 – 2026 (Tons)
      Fig.12	Global Consumer Electronics E-Waste to Preciometal Market, 2016 – 2026 (USD Million)
      Fig.13	Global Consumer Electronics E-Waste to Preciometal Market, 2016 – 2026 (Tons)
      Fig.14	Global Others E-Waste to Preciometal Market, 2016 – 2026 (USD Million)
      Fig.15	Global Others E-Waste to Preciometal Market, 2016 – 2026 (Tons)
      Fig.16	Global E-Waste to Preciometal Market Share, by Metal Type , 2020 & 2026 (USD Million)
      Fig.17	Global E-Waste to Preciometal Market Share, by Metal Type , 2020 & 2026 (Tons)
      Fig.18	Global Copper E-Waste to Preciometal Market, 2016 – 2026 (USD Million)
      Fig.19	Global Copper E-Waste to Preciometal Market, 2016 – 2026 (Tons)
      Fig.20	Global Gold E-Waste to Preciometal Market, 2016 – 2026 (USD Million)
      Fig.21	Global Gold E-Waste to Preciometal Market, 2016 – 2026 (Tons)
      Fig.22	Global  Silver E-Waste to Preciometal Market, 2016 – 2026 (USD Million)
      Fig.23	Global  Silver E-Waste to Preciometal Market, 2016 – 2026 (Tons)
      Fig.24	Global Others E-Waste to Preciometal Market, 2016 – 2026 (USD Million)
      Fig.25	Global Others E-Waste to Preciometal Market, 2016 – 2026 (Tons)
      Fig.26	Global E-Waste to Preciometal Market Share, by Region, 2020 & 2026 (USD Million)
      Fig.27	Global E-Waste to Preciometal Market Share, by Region, 2020 & 2026 (Tons)
      Fig.28	North America E-Waste to Preciometal Market, 2016 – 2026 (USD Million)
      Fig.29	North America E-Waste to Preciometal Market, 2016 – 2026 (Tons)
      Fig.30	U.S. E-Waste to Preciometal Market, 2016 – 2026 (USD Million)
      Fig.31	U.S. E-Waste to Preciometal  Market, 2016 – 2026 (Tons)
      Fig.32	Canada E-Waste to Preciometal Market, 2016 – 2026 (USD Million)
      Fig.33	Canada E-Waste to Preciometal  Market, 2016 – 2026 (Tons)
      Fig.34	Europe E-Waste to Preciometal Market, 2016 – 2026 (USD Million)
      Fig.35	Europe E-Waste to Preciometal Market, 2016 – 2026 (Tons)
      Fig.36	Germany E-Waste to Preciometal Market, 2016 – 2026 (USD Million)
      Fig.37	Germany E-Waste to Preciometal  Market, 2016 – 2026 (Tons)
      Fig.38	France E-Waste to Preciometal Market, 2016 – 2026 (USD Million)
      Fig.39	France E-Waste to Preciometal  Market, 2016 – 2026 (Tons)
      Fig.40	U.K. E-Waste to Preciometal Market, 2016 – 2026 (USD Million)
      Fig.41	U.K. E-Waste to Preciometal  Market, 2016 – 2026 (Tons)
      Fig.42	Italy E-Waste to Preciometal Market, 2016 – 2026 (USD Million)
      Fig.43	Italy E-Waste to Preciometal  Market, 2016 – 2026 (Tons)
      Fig.44	Spain E-Waste to Preciometal Market, 2016 – 2026 (USD Million)
      Fig.45	Spain E-Waste to Preciometal  Market, 2016 – 2026 (Tons)
      Fig.46	Rest of Europe E-Waste to Preciometal Market, 2016 – 2026 (USD Million)
      Fig.47	Rest of Europe E-Waste to Preciometal  Market, 2016 – 2026 (Tons)
      Fig.48	Asia Pacific E-Waste to Preciometal Market, 2016 – 2026 (USD Million)
      Fig.49	Asia Pacific E-Waste to Preciometal Market, 2016 – 2026 (Tons)
      Fig.50	China E-Waste to Preciometal Market, 2016 – 2026 (USD Million)
      Fig.51	China E-Waste to Preciometal  Market, 2016 – 2026 (Tons)
      Fig.52	Japan E-Waste to Preciometal Market, 2016 – 2026 (USD Million)
      Fig.53	Japan E-Waste to Preciometal  Market, 2016 – 2026 (Tons)
      Fig.54	India E-Waste to Preciometal Market, 2016 – 2026 (USD Million)
      Fig.55	India E-Waste to Preciometal  Market, 2016 – 2026 (Tons)
      Fig.56	South  Korea E-Waste to Preciometal Market, 2016 – 2026 (USD Million)
      Fig.57	South  Korea E-Waste to Preciometal  Market, 2016 – 2026 (Tons)
      Fig.58	South-East Asia E-Waste to Preciometal Market, 2016 – 2026 (USD Million)
      Fig.59	South-East Asia E-Waste to Preciometal  Market, 2016 – 2026 (Tons)
      Fig.60	Rest of Asia Pacific E-Waste to Preciometal Market, 2016 – 2026 (USD Million)
      Fig.61	Rest of Asia Pacific E-Waste to Preciometal  Market, 2016 – 2026 (Tons)
      Fig.62	Latin America E-Waste to Preciometal Market, 2016 – 2026 (USD Million)
      Fig.63	Latin America E-Waste to Preciometal Market, 2016 – 2026 (Tons)
      Fig.64	Brazil E-Waste to Preciometal Market, 2016 – 2026 (USD Million)
      Fig.65	Brazil E-Waste to Preciometal  Market, 2016 – 2026 (Tons)
      Fig.66	Mexico E-Waste to Preciometal Market, 2016 – 2026 (USD Million)
      Fig.67	Mexico E-Waste to Preciometal  Market, 2016 – 2026 (Tons)
      Fig.68	Rest of Latin America E-Waste to Preciometal Market, 2016 – 2026 (USD Million)
      Fig.69	Rest of Latin America E-Waste to Preciometal  Market, 2016 – 2026 (Tons)
      Fig.70	The Middle-East and Africa E-Waste to Preciometal Market, 2016 – 2026 (USD Million)
      Fig.71	The Middle-East and Africa E-Waste to Preciometal Market, 2016 – 2026 (Tons)
      Fig.72	GCC Countries E-Waste to Preciometal Market, 2016 – 2026 (USD Million)
      Fig.73	GCC Countries E-Waste to Preciometal  Market, 2016 – 2026 (Tons)
      Fig.74	South Africa E-Waste to Preciometal Market, 2016 – 2026 (USD Million)
      Fig.75	South Africa E-Waste to Preciometal  Market, 2016 – 2026 (Tons)
      Fig.76	Rest of Middle-East Africa E-Waste to Preciometal Market, 2016 – 2026 (USD Million)
      Fig.77	Rest of Middle-East Africa E-Waste to Preciometal  Market, 2016 – 2026 (Tons)
      Fig.78	Global E-Waste to Preciometal Production and Consumption, 2016 – 2026 (Tons)
      Fig.79	North America E-Waste to Preciometal Production and Consumption, 2016 – 2026 (USD Million) (Tons)
      Fig.80	Europe E-Waste to Preciometal Production and Consumption, 2016 – 2026 (USD Million) (Tons)
      Fig.81	Asia Pacific E-Waste to Preciometal Production and Consumption, 2016 – 2026 (USD Million) (Tons)
      Fig.82	Latin America E-Waste to Preciometal Production and Consumption, 2016 – 2026 (USD Million) (Tons)
      Fig.83	The Middle-East and Africa E-Waste to Preciometal Production and Consumption, 2016 – 2026 (USD Million) (Tons)
      Fig.84	Competitor Market Share – Revenue
      Fig.85	Competitor Market Share – Volume
      Fig.86	SIMS Metal Management, Ltd. Revenue and Growth Rate
      Fig.87	SIMS Metal Management, Ltd. Market Share
      Fig.88	Tetronics International Ltd. Revenue and Growth Rate
      Fig.89	Tetronics International Ltd. Market Share
      Fig.90	Stena Metall AB Revenue and Growth Rate
      Fig.91	Stena Metall AB Market Share
      Fig.92	American Retroworks, Inc. Revenue and Growth Rate
      Fig.93	American Retroworks, Inc. Market Share
      Fig.94	Universal Recyclers Technologies Revenue and Growth Rate
      Fig.95	Universal Recyclers Technologies Market Share
      Fig.96	CRT Recycling, Inc. Revenue and Growth Rate
      Fig.97	CRT Recycling, Inc. Market Share
      Fig.98	DOWA Holdings Co. Revenue and Growth Rate
      Fig.99	DOWA Holdings Co. Market Share
      Fig.100	EnviroLeach Technologies Inc. Revenue and Growth Rate
      Fig.101	EnviroLeach Technologies Inc. Market Share
      Fig.102	Umicore NV Revenue and Growth Rate
      Fig.103	Umicore NV Market Share
      Fig.104	Others Revenue and Growth Rate
      Fig.105	Others Market Share
      Fig.106	Market Dynamics
      Fig.107	Global E-Waste to Preciometal – Value Chain Analysis
      Fig.108	Key Mandates and Regulations
      Fig.109	Technology Roadmap and Timeline
      Fig.110	Market Attractiveness Analysis – By Source
      Fig.111	Market Attractiveness Analysis – By Metal Type
      Fig.112	Market Attractiveness Analysis – By Region
      Fig.113	Manufacturing Cost Structure of E-Waste to Preciometal
      Fig.114	E-Waste to Preciometal Industrial Chain Analysis
      Fig.115	Market Channels
      Fig.116	Marketing Channel Development Trend
      Fig.117	Growth in World Gross Product, 2008-2018
      

      List of Tables

      Table 1	Global E-Waste to Preciometal Market, 2020 & 2026 (USD Million)
      Table 2	Global E-Waste to Preciometal Market, by Source, 2016 – 2026 (USD Million)
      Table 3	Global E-Waste to Preciometal Market, by Source, 2016 – 2026 (Tons)
      Table 4	Global E-Waste to Preciometal Market, by Metal Type , 2016 – 2026 (USD Million)
      Table 5	Global E-Waste to Preciometal Market, by Metal Type , 2016 – 2026 (Tons)
      Table 6	Global E-Waste to Preciometal Market, by Region, 2016 – 2026 (USD Million)
      Table 7	Global E-Waste to Preciometal Market, by Region, 2016 – 2026 (Tons)
      Table 8	North America E-Waste to Preciometal Market, by Country, 2016 – 2026 (USD Million)
      Table 9	North America E-Waste to Preciometal Market, by Country, 2016 – 2026 (Tons)
      Table 10 North America E-Waste to Preciometal Market, by Source, 2016 – 2026 (USD Million)
      Table 11 North America E-Waste to Preciometal Market, by Source, 2016 – 2026 (Tons)
      Table 12 North America E-Waste to Preciometal Market, by Metal Type , 2016 – 2026 (USD Million)
      Table 13 North America E-Waste to Preciometal Market, by Metal Type , 2016 – 2026 (Tons)
      Table 14 Europe E-Waste to Preciometal Market, by Country, 2016 – 2026 (USD Million)
      Table 15 Europe E-Waste to Preciometal Market, by Country, 2016 – 2026 (Tons)
      Table 16 Europe E-Waste to Preciometal Market, by Source, 2016 – 2026 (USD Million)
      Table 17 Europe E-Waste to Preciometal Market, by Source, 2016 – 2026 (Tons)
      Table 18 Europe E-Waste to Preciometal Market, by Metal Type , 2016 – 2026 (USD Million)
      Table 19 Europe E-Waste to Preciometal Market, by Metal Type , 2016 – 2026 (Tons)
      Table 20 Asia Pacific E-Waste to Preciometal Market, by Country, 2016 – 2026 (USD Million)
      Table 21 Asia Pacific E-Waste to Preciometal Market, by Country, 2016 – 2026 (Tons)
      Table 22 Asia Pacific E-Waste to Preciometal Market, by Source, 2016 – 2026 (USD Million)
      Table 23 Asia Pacific E-Waste to Preciometal Market, by Source, 2016 – 2026 (Tons)
      Table 24 Asia Pacific E-Waste to Preciometal Market, by Metal Type , 2016 – 2026 (USD Million)
      Table 25 Asia Pacific E-Waste to Preciometal Market, by Metal Type , 2016 – 2026 (Tons)
      Table 26 Latin America E-Waste to Preciometal Market, by Country, 2016 – 2026 (USD Million)
      Table 27 Latin America E-Waste to Preciometal Market, by Country, 2016 – 2026 (Tons)
      Table 28 Latin America E-Waste to Preciometal Market, by Source, 2016 – 2026 (USD Million)
      Table 29 Latin America E-Waste to Preciometal Market, by Source, 2016 – 2026 (Tons)
      Table 30 Latin America E-Waste to Preciometal Market, by Metal Type , 2016 – 2026 (USD Million)
      Table 31 Latin America E-Waste to Preciometal Market, by Metal Type , 2016 – 2026 (Tons)
      Table 32 The Middle-East and Africa E-Waste to Preciometal Market, by Country, 2016 – 2026 (USD Million)
      Table 33 The Middle-East and Africa E-Waste to Preciometal Market, by Country, 2016 – 2026 (Tons)
      Table 34 The Middle-East and Africa E-Waste to Preciometal Market, by Source, 2016 – 2026 (USD Million)
      Table 35 The Middle-East and Africa E-Waste to Preciometal Market, by Source, 2016 – 2026 (Tons)
      Table 36 The Middle-East and Africa E-Waste to Preciometal Market, by Metal Type , 2016 – 2026 (USD Million)
      Table 37 The Middle-East and Africa E-Waste to Preciometal Market, by Metal Type , 2016 – 2026 (Tons)
      Table 38 North America E-Waste to Preciometal Production, Consumption, Export, Import, 2016 – 2020
      Table 39 Europe E-Waste to Preciometal Production, Consumption, Export, Import, 2016 – 2020
      Table 40 Asia Pacific E-Waste to Preciometal Production, Consumption, Export, Import, 2016 – 2020
      Table 41 Latin America E-Waste to Preciometal Production, Consumption, Export, Import, 2016 – 2020
      Table 42 The Middle-East and Africa E-Waste to Preciometal Production, Consumption, Export, Import, 2016 – 2020
      Table 43 Global E-Waste to Preciometal Market - Company Revenue Analysis, 2016 – 2020 (USD Million)
      Table 44 Global E-Waste to Preciometal Market - Company Revenue Share Analysis, 2016 – 2020 (%)
      Table 45 Global E-Waste to Preciometal Market - Company Volume Analysis, 2016 – 2020 (Tons)
      Table 46 Global E-Waste to Preciometal Market - Company Volume Share Analysis, 2016 – 2020 (%)
      Table 47 Acquisitions and Mergers
      Table 48 Market Drivers – Impact Analysis
      Table 49 Market Restraints
      Table 50 Market Opportunities
      Table 51 Production Base and Market Concentration Rate of Raw Material
      Table 52 Key Suppliers of Raw Materials
      Table 53 Raw Materials Sources of E-Waste to Preciometal Major Manufacturers
      Table 54 Major Buyers of E-Waste to Preciometal
      Table 55 Distributors/Traders of E-Waste to Preciometal by Region
      

Industry Major Market Players

  • SIMS Metal Management Ltd.
  •  Tetronics International Ltd.
  •   Stena Metall AB
  •  American Retroworks Inc.
  •  Universal Recyclers Technologies
  •  CRT Recycling Inc.
  •  DOWA Holdings Co.
  •  EnviroLeach Technologies Inc.
  •   Umicore NV