Search Market Research Report

Discover Our Latest Reports
Discover Our Featured Reports
Discover Top Selling Reports

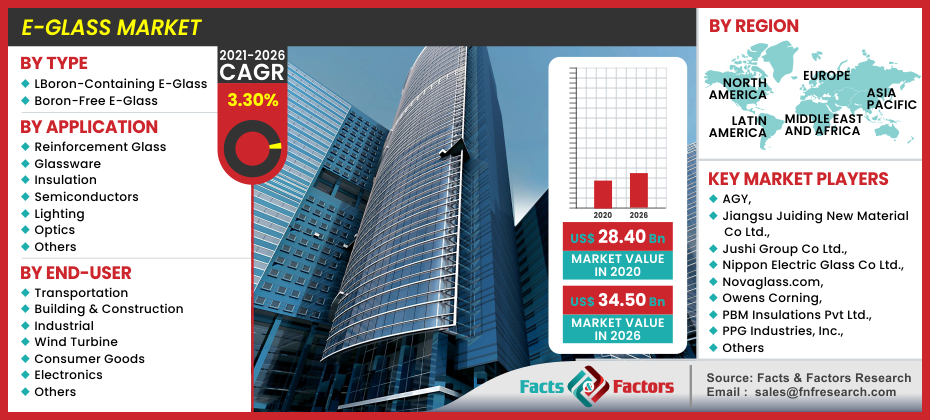
E-Glass Market Size, Share Global Analysis Report, , 2020 – 2026

report img

E-Glass Market By Type (Boron-Containing E-Glass & Boron-Free E-Glass), By Application (Reinforcement Glass, Glassware, Insulation, Semiconductors, Lighting, Optics, & Others), By End-User (Transportation, Building & Construction, Industrial, Wind Turbine, Consumer Goods, Electronics, & Others), and By Regions - Global Industry Perspective, Comprehensive Analysis, and Forecast, 2020 – 2026

Industry Insights

[216+ Pages Report] Facts and Factors has recently published the report titled “E-Glass Market” which illustrates that the global E-Glass market was estimated to be around USD 28.40 Billion in 2020, and it is expected to provide revenue of about USD 34.50 Billion by end of 2026, developing at a CAGR of around 3.30% between 2021 and 2026.

logoMarket Overview

In the term E-glass, the letter “e” stands for “electrical grade” that clearly helps explain the reason behind its low electrical conductivity. This type of glass is known to have limited thermal expansion coefficients, which helps enhance its resistance to thermal shock compared to common glass. Additionally, thermal stress is found to have no impact on the e-glass. It is general used to produce glassware used in laboratories, cooking, and other general purposes. In the standoff insulators used for electrical wiring, e-glass is used as a primary component. Furthermore, this glass is found to contain fabulous fiber-forming capabilities, thereby increasing its use as reinforcement agent in fiberglass, also known as glass-reinforced plastic (GRP) or glass-fiber reinforced plastic (GFRP). The variation in the percentage of e-glass composition helps manufacture different types of fiberglass. The low cost, strength, high stiffness, electrical insulation, heat & chemical resistance, and non-flammable property of e-glass makes it a highly preferred option for the production of fiberglass and other glass fiber-reinforced composites.

E-Glass Market

To know more about this report | Request Free Sample Copy

logoIndustry Growth Factors

The increasing cases of cancer caused due to the use of asbestos have increased the demand for e-glass. Thus, the nature-friendly boron-free e-glass is helping replace the boron-containing types. However, the toxicity of glass fibers present in the e-glass is likely to restrain the market growth during the forecast period. The rising use of glass fiber-reinforced composites in the various industries including, rowing shells & oars, traffic lights, antenna covers & structures, ship hulls auto body parts, GRP & GRE pipes, helmets, surfboards, storage tanks, tent poles, and others are expected to drive the e-glass market growth during the forecast period. Additionally, the rising technological advancements in production of lightweight materials for manufacturing automotive parts, such as brake pads, drive belts, clutch discs, and demand for high-performance glass fibers are expected to fuel the industry growth. The increasing disposable income has increased the electronic device expenditure, which in turn helps drive the market growth. The government programs to support digitalization coupled with growing the tech-savvy population further propels the growth of the e-glass market.

logoSegmentation Analysis

The global e-glass market can be segmented on the basis of type, application, end-users, and regions.

The global e-glass market can be divided into boron-containing and boron-free on the basis of type. Based on application, the global e-glass market can be segmented into reinforcement glass, glassware, insulation, semiconductors, lighting, optics, and others. The global e-glass market can be broken down into transportation, building & construction, industrial, wind turbine, consumer goods, electronics, and others on the basis of end-users.

logoReport Scope

Report Attribute

Details

Market Size in 2020

USD 28.40 Million

Projected Market Size in 2026

USD 34.50 Million

CAGR Growth Rate

3.30% CAGR

Base Year

2020

Forecast Years

2021-2026

Key Market Players

AGY, Jiangsu Juiding New Material Co Ltd., Jushi Group Co Ltd., Nippon Electric Glass Co Ltd., Novaglass.com, Owens Corning, PBM Insulations Pvt Ltd., PPG Industries, Inc., Rex Sealing & Packing Industries Pvt Limited, and SCHOTT AG, among others

Key Segment

By Type, Application, End-Users, and Region

Major Regions Covered

North America, Europe, Asia Pacific, Latin America, and the Middle East & Africa

Purchase Options

Request customized purchase options to meet your research needs. Explore purchase options

logo Regional Analysis

The region of Asia-Pacific is expected to witness the highest market share during the forecast period in terms of global revenue. China, Japan, and India are expected to be the biggest contributors to the market in the region. The increasing adoption of the building & construction industry, growing population, high demand for effective insulation materials in China is projected to drive the E-glass market in the Asia Pacific region. Additionally, the favorable government policies such as China's New Materials five-year plan effective from 2012 have further helped enhance the e-glass market growth by managing the composite materials and technologies.

Europe will account for the second-largest market share in the global landscape in terms of global revenue. Germany, France, and the U.K will account as the largest contributors to the market during the forecast.

logo Competitive Analysis

The major participants in the global e-glass market are :

  • AGY
  • Jiangsu Juiding New Material Co Ltd.
  • Jushi Group Co Ltd.
  • Nippon Electric Glass Co Ltd.
  • Novaglass.com
  • Owens Corning
  • PBM Insulations Pvt Ltd.
  • PPG Industries Inc.
  • Rex Sealing & Packing Industries Pvt Limited
  • SCHOTT AG

logo By Type Segment Analysis

  • Boron-Containing E-Glass
  • Boron-Free E-Glass

logo By Application Segment Analysis

  • Reinforcement Glass
  • Glassware
  • Insulation
  • Semiconductors
  • Lighting
  • Optics
  • Others

logo By End-User Segment Analysis

  • Transportation
  • Building & Construction
  • Industrial
  • Wind Turbine
  • Consumer Goods
  • Electronics
  • Others

logo By Regional Segment Analysis

  • North America
    • U.S.
    • Canada
  • Europe
    • UK
    • France
    • Germany
    • Italy
    • Spain
    • Rest of Europe
  • Asia Pacific
    • China
    • Japan
    • India
    • South Korea
    • Southeast Asia
    • Rest of Asia Pacific
  • Latin America
    • Brazil
    • Mexico
    • Rest of Latin America
  • Middle East and Africa
    • GCC Countries
    • South Africa
    • Rest of MEA

Table of Content

  1. Chapter 1 Executive Summary
    1. 1.1. Introduction of E-Glass
    2. 1.2. Global E-Glass Market, 2019 & 2021 (USD Billion)
    3. 1.3. Global E-Glass Market, 2020 – 2021 (USD Billion) ()
    4. 1.4. Global E-Glass Market Absolute Revenue Opportunity, 2020 – 2021 (USD Billion)
    5. 1.5. Global E-Glass Market Incremental Revenue Opportunity, 2020 – 2021 (USD Billion)
  2. Chapter 2 E-Glass Market – Type Analysis
    1. 2.1. Global E-Glass Market – Type Overview
    2. 2.2. Global E-Glass Market Share, by Type, 2019 & 2021 (USD Billion)
    3. 2.3. Global E-Glass Market share, by Type, 2019 & 2021 ()
    4. 2.4. Boron-Containing E-Glass
      1. 2.4.1. Global Boron-Containing E-Glass E-Glass Market, 2020 – 2021 (USD Billion)
      2. 2.4.2. Global Boron-Containing E-Glass E-Glass Market, 2020 – 2021 ()
    5. 2.5. Boron-Free E-Glass
      1. 2.5.1. Global Boron-Free E-Glass E-Glass Market, 2020 – 2021 (USD Billion)
      2. 2.5.2. Global Boron-Free E-Glass E-Glass Market, 2020 – 2021 ()
  3. Chapter 3 E-Glass Market – Application Analysis
    1. 3.1. Global E-Glass Market – Application Overview
    2. 3.2. Global E-Glass Market Share, by Application, 2019 & 2021 (USD Billion)
    3. 3.3. Global E-Glass Market share, by Application, 2019 & 2021 ()
    4. 3.4. Reinforcement Glass
      1. 3.4.1. Global Reinforcement Glass E-Glass Market, 2020 – 2021 (USD Billion)
      2. 3.4.2. Global Reinforcement Glass E-Glass Market, 2020 – 2021 ()
    5. 3.5. Glassware
      1. 3.5.1. Global Glassware E-Glass Market, 2020 – 2021 (USD Billion)
      2. 3.5.2. Global Glassware E-Glass Market, 2020 – 2021 ()
    6. 3.6. Insulation
      1. 3.6.1. Global Insulation E-Glass Market, 2020 – 2021 (USD Billion)
      2. 3.6.2. Global Insulation E-Glass Market, 2020 – 2021 ()
    7. 3.7. Semiconductors
      1. 3.7.1. Global Semiconductors E-Glass Market, 2020 – 2021 (USD Billion)
      2. 3.7.2. Global Semiconductors E-Glass Market, 2020 – 2021 ()
    8. 3.8. Lighting
      1. 3.8.1. Global Lighting E-Glass Market, 2020 – 2021 (USD Billion)
      2. 3.8.2. Global Lighting E-Glass Market, 2020 – 2021 ()
    9. 3.9. Optics
      1. 3.9.1. Global Optics E-Glass Market, 2020 – 2021 (USD Billion)
      2. 3.9.2. Global Optics E-Glass Market, 2020 – 2021 ()
    10. 3.10. Others
      1. 3.10.1. Global Others E-Glass Market, 2020 – 2021 (USD Billion)
      2. 3.10.2. Global Others E-Glass Market, 2020 – 2021 ()
  4. Chapter 4 E-Glass Market – End-Users Analysis
    1. 4.1. Global E-Glass Market – End-Users Overview
    2. 4.2. Global E-Glass Market Share, by End-Users, 2019 & 2021 (USD Billion)
    3. 4.3. Global E-Glass Market share, by End-Users, 2019 & 2021 ()
    4. 4.4. Transportation
      1. 4.4.1. Global Transportation E-Glass Market, 2020 – 2021 (USD Billion)
      2. 4.4.2. Global Transportation E-Glass Market, 2020 – 2021 ()
    5. 4.5. Building & Construction
      1. 4.5.1. Global Building & Construction E-Glass Market, 2020 – 2021 (USD Billion)
      2. 4.5.2. Global Building & Construction E-Glass Market, 2020 – 2021 ()
    6. 4.6. Industrial
      1. 4.6.1. Global Industrial E-Glass Market, 2020 – 2021 (USD Billion)
      2. 4.6.2. Global Industrial E-Glass Market, 2020 – 2021 ()
    7. 4.7. Wind Turbine
      1. 4.7.1. Global Wind Turbine E-Glass Market, 2020 – 2021 (USD Billion)
      2. 4.7.2. Global Wind Turbine E-Glass Market, 2020 – 2021 ()
    8. 4.8. Consumer Goods
      1. 4.8.1. Global Consumer Goods E-Glass Market, 2020 – 2021 (USD Billion)
      2. 4.8.2. Global Consumer Goods E-Glass Market, 2020 – 2021 ()
    9. 4.9. Electronics
      1. 4.9.1. Global Electronics E-Glass Market, 2020 – 2021 (USD Billion)
      2. 4.9.2. Global Electronics E-Glass Market, 2020 – 2021 ()
    10. 4.10. Others
      1. 4.10.1. Global Others E-Glass Market, 2020 – 2021 (USD Billion)
      2. 4.10.2. Global Others E-Glass Market, 2020 – 2021 ()
  5. Chapter 5 E-Glass Market – Regional Analysis
    1. 5.1. Global E-Glass Market Regional Overview
    2. 5.2. Global E-Glass Market Share, by Region, 2019 & 2021 (USD Billion)
    3. 5.3. Global E-Glass Market Share, by Region, 2019 & 2021 ()
    4. 5.4. North America
      1. 5.4.1. North America E-Glass Market, 2020 – 2021 (USD Billion)
        1. 5.4.1.1. North America E-Glass Market, by Country, 2020 – 2021 (USD Billion)
      2. 5.4.2. North America Market, 2020 – 2021 ()
        1. 5.4.2.1. North America E-Glass Market, by Country, 2020 – 2021 ()
      3. 5.4.3. North America E-Glass Market, by Type, 2020 – 2021
        1. 5.4.3.1. North America E-Glass Market, by Type, 2020 – 2021 (USD Billion)
        2. 5.4.3.2. North America E-Glass Market, by Type, 2020 – 2021 ()
      4. 5.4.4. North America E-Glass Market, by Application, 2020 – 2021
        1. 5.4.4.1. North America E-Glass Market, by Application, 2020 – 2021 (USD Billion)
        2. 5.4.4.2. North America E-Glass Market, by Application, 2020 – 2021 ()
      5. 5.4.5. North America E-Glass Market, by End-Users, 2020 – 2021
        1. 5.4.5.1. North America E-Glass Market, by End-Users, 2020 – 2021 (USD Billion)
        2. 5.4.5.2. North America E-Glass Market, by End-Users, 2020 – 2021 ()
      6. 5.4.6. U.S.
        1. 5.4.6.1. U.S. E-Glass Market, 2020 – 2021 (USD Billion)
        2. 5.4.6.2. U.S. E-Glass Market, 2020 – 2021 ()
      7. 5.4.7. Canada
        1. 5.4.7.1. Canada E-Glass Market, 2020 – 2021 (USD Billion)
        2. 5.4.7.2. Canada E-Glass Market, 2020 – 2021 ()
    5. 5.5. Europe
      1. 5.5.1. Europe E-Glass Market, 2020 – 2021 (USD Billion)
        1. 5.5.1.1. Europe E-Glass Market, by Country, 2020 – 2021 (USD Billion)
      2. 5.5.2. Europe Market, 2020 – 2021 ()
        1. 5.5.2.1. Europe E-Glass Market, by Country, 2020 – 2021 ()
      3. 5.5.3. Europe E-Glass Market, by Type, 2020 – 2021
        1. 5.5.3.1. Europe E-Glass Market, by Type, 2020 – 2021 (USD Billion)
        2. 5.5.3.2. Europe E-Glass Market, by Type, 2020 – 2021 ()
      4. 5.5.4. Europe E-Glass Market, by Application, 2020 – 2021
        1. 5.5.4.1. Europe E-Glass Market, by Application, 2020 – 2021 (USD Billion)
        2. 5.5.4.2. Europe E-Glass Market, by Application, 2020 – 2021 ()
      5. 5.5.5. Europe E-Glass Market, by End-Users, 2020 – 2021
        1. 5.5.5.1. Europe E-Glass Market, by End-Users, 2020 – 2021 (USD Billion)
        2. 5.5.5.2. Europe E-Glass Market, by End-Users, 2020 – 2021 ()
      6. 5.5.6. Germany
        1. 5.5.6.1. Germany E-Glass Market, 2020 – 2021 (USD Billion)
        2. 5.5.6.2. Germany E-Glass Market, 2020 – 2021 ()
      7. 5.5.7. France
        1. 5.5.7.1. France E-Glass Market, 2020 – 2021 (USD Billion)
        2. 5.5.7.2. France E-Glass Market, 2020 – 2021 ()
      8. 5.5.8. U.K.
        1. 5.5.8.1. U.K. E-Glass Market, 2020 – 2021 (USD Billion)
        2. 5.5.8.2. U.K. E-Glass Market, 2020 – 2021 ()
      9. 5.5.9. Italy
        1. 5.5.9.1. Italy E-Glass Market, 2020 – 2021 (USD Billion)
        2. 5.5.9.2. Italy E-Glass Market, 2020 – 2021 ()
      10. 5.5.10. Spain
        1. 5.5.10.1. Spain E-Glass Market, 2020 – 2021 (USD Billion)
        2. 5.5.10.2. Spain E-Glass Market, 2020 – 2021 ()
      11. 5.5.11. Rest of Europe
        1. 5.5.11.1. Rest of Europe E-Glass Market, 2020 – 2021 (USD Billion)
        2. 5.5.11.2. Rest of Europe E-Glass Market, 2020 – 2021 ()
    6. 5.6. Asia Pacific
      1. 5.6.1. Asia Pacific E-Glass Market, 2020 – 2021 (USD Billion)
        1. 5.6.1.1. Asia Pacific E-Glass Market, by Country, 2020 – 2021 (USD Billion)
      2. 5.6.2. Asia Pacific Market, 2020 – 2021 ()
        1. 5.6.2.1. Asia Pacific E-Glass Market, by Country, 2020 – 2021 ()
      3. 5.6.3. Asia Pacific E-Glass Market, by Type, 2020 – 2021
        1. 5.6.3.1. Asia Pacific E-Glass Market, by Type, 2020 – 2021 (USD Billion)
        2. 5.6.3.2. Asia Pacific E-Glass Market, by Type, 2020 – 2021 ()
      4. 5.6.4. Asia Pacific E-Glass Market, by Application, 2020 – 2021
        1. 5.6.4.1. Asia Pacific E-Glass Market, by Application, 2020 – 2021 (USD Billion)
        2. 5.6.4.2. Asia Pacific E-Glass Market, by Application, 2020 – 2021 ()
      5. 5.6.5. Asia Pacific E-Glass Market, by End-Users, 2020 – 2021
        1. 5.6.5.1. Asia Pacific E-Glass Market, by End-Users, 2020 – 2021 (USD Billion)
        2. 5.6.5.2. Asia Pacific E-Glass Market, by End-Users, 2020 – 2021 ()
      6. 5.6.6. China
        1. 5.6.6.1. China E-Glass Market, 2020 – 2021 (USD Billion)
        2. 5.6.6.2. China E-Glass Market, 2020 – 2021 ()
      7. 5.6.7. Japan
        1. 5.6.7.1. Japan E-Glass Market, 2020 – 2021 (USD Billion)
        2. 5.6.7.2. Japan E-Glass Market, 2020 – 2021 ()
      8. 5.6.8. India
        1. 5.6.8.1. India E-Glass Market, 2020 – 2021 (USD Billion)
        2. 5.6.8.2. India E-Glass Market, 2020 – 2021 ()
      9. 5.6.9. South Korea
        1. 5.6.9.1. South Korea E-Glass Market, 2020 – 2021 (USD Billion)
        2. 5.6.9.2. South Korea E-Glass Market, 2020 – 2021 ()
      10. 5.6.10. South-East Asia
        1. 5.6.10.1. South-East Asia E-Glass Market, 2020 – 2021 (USD Billion)
        2. 5.6.10.2. South-East Asia E-Glass Market, 2020 – 2021 ()
      11. 5.6.11. Rest of Asia Pacific
        1. 5.6.11.1. Rest of Asia Pacific E-Glass Market, 2020 – 2021 (USD Billion)
        2. 5.6.11.2. Rest of Asia Pacific E-Glass Market, 2020 – 2021 ()
    7. 5.7. Latin America
      1. 5.7.1. Latin America E-Glass Market, 2020 – 2021 (USD Billion)
        1. 5.7.1.1. Latin America E-Glass Market, by Country, 2020 – 2021 (USD Billion)
      2. 5.7.2. Latin America Market, 2020 – 2021 ()
        1. 5.7.2.1. Latin America E-Glass Market, by Country, 2020 – 2021 ()
      3. 5.7.3. Latin America E-Glass Market, by Type, 2020 – 2021
        1. 5.7.3.1. Latin America E-Glass Market, by Type, 2020 – 2021 (USD Billion)
        2. 5.7.3.2. Latin America E-Glass Market, by Type, 2020 – 2021 ()
      4. 5.7.4. Latin America E-Glass Market, by Application, 2020 – 2021
        1. 5.7.4.1. Latin America E-Glass Market, by Application, 2020 – 2021 (USD Billion)
        2. 5.7.4.2. Latin America E-Glass Market, by Application, 2020 – 2021 ()
      5. 5.7.5. Latin America E-Glass Market, by End-Users, 2020 – 2021
        1. 5.7.5.1. Latin America E-Glass Market, by End-Users, 2020 – 2021 (USD Billion)
        2. 5.7.5.2. Latin America E-Glass Market, by End-Users, 2020 – 2021 ()
      6. 5.7.6. Brazil
        1. 5.7.6.1. Brazil E-Glass Market, 2020 – 2021 (USD Billion)
        2. 5.7.6.2. Brazil E-Glass Market, 2020 – 2021 ()
      7. 5.7.7. Mexico
        1. 5.7.7.1. Mexico E-Glass Market, 2020 – 2021 (USD Billion)
        2. 5.7.7.2. Mexico E-Glass Market, 2020 – 2021 ()
      8. 5.7.8. Rest of Latin America
        1. 5.7.8.1. Rest of Latin America E-Glass Market, 2020 – 2021 (USD Billion)
        2. 5.7.8.2. Rest of Latin America E-Glass Market, 2020 – 2021 ()
    8. 5.8. The Middle-East and Africa
      1. 5.8.1. The Middle-East and Africa E-Glass Market, 2020 – 2021 (USD Billion)
        1. 5.8.1.1. The Middle-East and Africa E-Glass Market, by Country, 2020 – 2021 (USD Billion)
      2. 5.8.2. The Middle-East and Africa Market, 2020 – 2021 ()
        1. 5.8.2.1. The Middle-East and Africa E-Glass Market, by Country, 2020 – 2021 ()
      3. 5.8.3. The Middle-East and Africa E-Glass Market, by Type, 2020 – 2021
        1. 5.8.3.1. The Middle-East and Africa E-Glass Market, by Type, 2020 – 2021 (USD Billion)
        2. 5.8.3.2. The Middle-East and Africa E-Glass Market, by Type, 2020 – 2021 ()
      4. 5.8.4. The Middle-East and Africa E-Glass Market, by Application, 2020 – 2021
        1. 5.8.4.1. The Middle-East and Africa E-Glass Market, by Application, 2020 – 2021 (USD Billion)
        2. 5.8.4.2. The Middle-East and Africa E-Glass Market, by Application, 2020 – 2021 ()
      5. 5.8.5. The Middle-East and Africa E-Glass Market, by End-Users, 2020 – 2021
        1. 5.8.5.1. The Middle-East and Africa E-Glass Market, by End-Users, 2020 – 2021 (USD Billion)
        2. 5.8.5.2. The Middle-East and Africa E-Glass Market, by End-Users, 2020 – 2021 ()
      6. 5.8.6. GCC Countries
        1. 5.8.6.1. GCC Countries E-Glass Market, 2020 – 2021 (USD Billion)
        2. 5.8.6.2. GCC Countries E-Glass Market, 2020 – 2021 ()
      7. 5.8.7. South Africa
        1. 5.8.7.1. South Africa E-Glass Market, 2020 – 2021 (USD Billion)
        2. 5.8.7.2. South Africa E-Glass Market, 2020 – 2021 ()
      8. 5.8.8. Rest of Middle-East Africa
        1. 5.8.8.1. Rest of Middle-East Africa E-Glass Market, 2020 – 2021 (USD Billion)
        2. 5.8.8.2. Rest of Middle-East Africa E-Glass Market, 2020 – 2021 ()
  6. Chapter 6 E-Glass Production, Consumption, Export, Import by Regions
    1. 6.1. Global E-Glass Production and Consumption, 2020 – 2021 ()
    2. 6.2. Global Import and Export Analysis, by Region
  7. Chapter 7 E-Glass Market – Competitive Landscape
    1. 7.1. Competitor Market Share – Revenue
    2. 7.2. Market Concentration Rate Analysis, Top 3 and Top 5 Players
    3. 7.3. Competitor Market Share – Volume
    4. 7.4. Strategic Developments
      1. 7.4.1. Acquisitions and Mergers
      2. 7.4.2. New Products
      3. 7.4.3. Research & Development Activities
  8. Chapter 8 Company Profiles
    1. 8.1. AGY
      1. 8.1.1. Company Overview
      2. 8.1.2. Product/Service Portfolio
      3. 8.1.3. AGY Sales, Revenue, Price, and Gross Margin
      4. 8.1.4. AGY Revenue and Growth Rate
      5. 8.1.5. AGY Market Share
      6. 8.1.6. Recent Initiatives, Funding/VC Activities, and Technological Innovations
    2. 8.2. Jiangsu Juiding New Material Co Ltd
      1. 8.2.1. Company Overview
      2. 8.2.2. Product/Service Portfolio
      3. 8.2.3. Jiangsu Juiding New Material Co Ltd Sales, Revenue, Price, and Gross Margin
      4. 8.2.4. Jiangsu Juiding New Material Co Ltd Revenue and Growth Rate
      5. 8.2.5. Jiangsu Juiding New Material Co Ltd Market Share
      6. 8.2.6. Recent Initiatives, Funding/VC Activities, and Technological Innovations
    3. 8.3. Jushi Group Co Ltd
      1. 8.3.1. Company Overview
      2. 8.3.2. Product/Service Portfolio
      3. 8.3.3. Jushi Group Co Ltd Sales, Revenue, Price, and Gross Margin
      4. 8.3.4. Jushi Group Co Ltd Revenue and Growth Rate
      5. 8.3.5. Jushi Group Co Ltd Market Share
      6. 8.3.6. Recent Initiatives, Funding/VC Activities, and Technological Innovations
    4. 8.4. Nippon Electric Glass Co Ltd
      1. 8.4.1. Company Overview
      2. 8.4.2. Product/Service Portfolio
      3. 8.4.3. Nippon Electric Glass Co Ltd Sales, Revenue, Price, and Gross Margin
      4. 8.4.4. Nippon Electric Glass Co Ltd Revenue and Growth Rate
      5. 8.4.5. Nippon Electric Glass Co Ltd Market Share
      6. 8.4.6. Recent Initiatives, Funding/VC Activities, and Technological Innovations
      7. 8.5. Novaglass.com
      8. 8.5.1. Company Overview
      9. 8.5.2. Product/Service Portfolio
        1. 8.5.3. Novaglass.com Sales, Revenue, Price, and Gross Margin
        2. 8.5.4. Novaglass.com Revenue and Growth Rate
        3. 8.5.5. Novaglass.com Market Share
      10. 8.5.6. Recent Initiatives, Funding/VC Activities, and Technological Innovations
    5. 8.6. Owens Corning
      1. 8.6.1. Company Overview
      2. 8.6.2. Product/Service Portfolio
      3. 8.6.3. Owens Corning Sales, Revenue, Price, and Gross Margin
      4. 8.6.4. Owens Corning Revenue and Growth Rate
      5. 8.6.5. Owens Corning Market Share
      6. 8.6.6. Recent Initiatives, Funding/VC Activities, and Technological Innovations
    6. 8.7. PBM Insulations Pvt Ltd
      1. 8.7.1. Company Overview
      2. 8.7.2. Product/Service Portfolio
      3. 8.7.3. PBM Insulations Pvt Ltd Sales, Revenue, Price, and Gross Margin
      4. 8.7.4. PBM Insulations Pvt Ltd Revenue and Growth Rate
      5. 8.7.5. PBM Insulations Pvt Ltd Market Share
      6. 8.7.6. Recent Initiatives, Funding/VC Activities, and Technological Innovations
    7. 8.8. PPG Industries Inc
      1. 8.8.1. Company Overview
      2. 8.8.2. Product/Service Portfolio
      3. 8.8.3. PPG Industries Inc Sales, Revenue, Price, and Gross Margin
      4. 8.8.4. PPG Industries Inc Revenue and Growth Rate
      5. 8.8.5. PPG Industries Inc Market Share
      6. 8.8.6. Recent Initiatives, Funding/VC Activities, and Technological Innovations
    8. 8.9. Rex Sealing & Packing Industries Pvt Limited
      1. 8.9.1. Company Overview
      2. 8.9.2. Product/Service Portfolio
      3. 8.9.3. Rex Sealing & Packing Industries Pvt Limited Sales, Revenue, Price, and Gross Margin
      4. 8.9.4. Rex Sealing & Packing Industries Pvt Limited Revenue and Growth Rate
      5. 8.9.5. Rex Sealing & Packing Industries Pvt Limited Market Share
      6. 8.9.6. Recent Initiatives, Funding/VC Activities, and Technological Innovations
    9. 8.10. SCHOTT AG
      1. 8.10.1. Company Overview
      2. 8.10.2. Product/Service Portfolio
      3. 8.10.3. SCHOTT AG Sales, Revenue, Price, and Gross Margin
      4. 8.10.4. SCHOTT AG Revenue and Growth Rate
      5. 8.10.5. SCHOTT AG Market Share
      6. 8.10.6. Recent Initiatives, Funding/VC Activities, and Technological Innovations
  9. Chapter 9 E-Glass — Industry Analysis
    1. 9.1. Introduction and Taxonomy
    2. 9.2. E-Glass Market – Key Trends
      1. 9.2.1. Market Drivers
      2. 9.2.2. Market Restraints
      3. 9.2.3. Market Opportunities
    3. 9.3. Value Chain Analysis
    4. 9.4. Key Mandates and Regulations
    5. 9.5. Technology Roadmap and Timeline
    6. 9.6. E-Glass Market – Attractiveness Analysis
      1. 9.6.1. By Type
      2. 9.6.2. By Application
      3. 9.6.3. By End-Users
      4. 9.6.4. By Region
  10. Chapter 10 Raw Material Analysis
    1. 10.1. E-Glass Key Raw Material Analysis
      1. 10.1.1. Key Raw Materials
      2. 10.1.2. Price Trend of Key Raw Materials
    2. 10.2. Key Suppliers of Raw Materials
    3. 10.3. Proportion of Manufacturing Cost Structure
      1. 10.3.1. Raw Materials Cost
      2. 10.3.2. Labor Cost
      3. 10.3.3. Manufacturing Expenses
      4. 10.3.4. Miscellaneous Expenses
    4. 10.4. Manufacturing Cost Analysis of E-Glass
  11. Chapter 11 Industrial Chain, Sourcing Strategy, and Downstream Buyers
    1. 11.1. E-Glass Industrial Chain Analysis
    2. 11.2. Upstream Raw Materials Sourcing
      1. 11.2.1. Risk Mitigation:
      2. 11.2.2. Supplier Relationships:
      3. 11.2.3. Business Processes:
      4. 11.2.4. Securing the Product:
    3. 11.3. Raw Materials Sources of E-Glass Major Manufacturers
    4. 11.4. Downstream Buyers
    5. 11.5. Distributors/Traders List
  12. Chapter 12 Marketing Strategy Analysis, Distributors
    1. 12.1. Marketing Channel
    2. 12.2. Direct Marketing
    3. 12.3. Indirect Marketing
    4. 12.4. Marketing Channel Development Trends
    5. 12.5. Economic/Political Environmental Change
  13. Chapter 13 Report Conclusion & Key Insights
    1. 13.1. Key Insights from Primary Interviews & Surveys Respondents
    2. 13.2. Key Takeaways from Analysts, Consultants, and Industry Leaders
  14. Chapter 14 Research Approach & Methodology
    1. 14.1. Report Description
    2. 14.2. Research Scope
    3. 14.3. Research Methodology
      1. 14.3.1. Secondary Research
      2. 14.3.2. Primary Research
      3. 14.3.3. Statistical Models
        1. 14.3.3.1. Company Share Analysis Model
        2. 14.3.3.2. Revenue Based Modeling
      4. 14.3.4. Research Limitations

      List of Figures

      Fig.1	Product Picture of E-Glass
      Fig.2	Global E-Glass  Market, 2020 – 2021 (USD Billion)
      Fig.3	Global E-Glass  Market, 2020 – 2021 ()
      Fig.4	Global E-Glass  Market Absolute Revenue Opportunity, 2020 – 2021 (USD Billion)
      Fig.5	Global E-Glass  Market Incremental Revenue Opportunity, 2020 – 2021 (USD Billion)
      Fig.6	Global E-Glass  Market Share, by Type, 2019 & 2021 (USD Billion)
      Fig.7	Global E-Glass  Market Share, by Type, 2019 & 2021 ()
      Fig.8	Global Boron-Containing E-Glass E-Glass  Market, 2020 – 2021 (USD Billion)
      Fig.9	Global Boron-Containing E-Glass E-Glass  Market, 2020 – 2021 ()
      Fig.10	Global Boron-Free E-Glass E-Glass  Market, 2020 – 2021 (USD Billion)
      Fig.11	Global Boron-Free E-Glass E-Glass  Market, 2020 – 2021 ()
      Fig.12	Global E-Glass  Market Share, by Application, 2019 & 2021 (USD Billion)
      Fig.13	Global E-Glass  Market Share, by Application, 2019 & 2021 ()
      Fig.14	Global Reinforcement Glass E-Glass  Market, 2020 – 2021 (USD Billion)
      Fig.15	Global Reinforcement Glass E-Glass  Market, 2020 – 2021 ()
      Fig.16	Global Glassware E-Glass  Market, 2020 – 2021 (USD Billion)
      Fig.17	Global Glassware E-Glass  Market, 2020 – 2021 ()
      Fig.18	Global Insulation E-Glass  Market, 2020 – 2021 (USD Billion)
      Fig.19	Global Insulation E-Glass  Market, 2020 – 2021 ()
      Fig.20	Global Semiconductors E-Glass  Market, 2020 – 2021 (USD Billion)
      Fig.21	Global Semiconductors E-Glass  Market, 2020 – 2021 ()
      Fig.22	Global Lighting E-Glass  Market, 2020 – 2021 (USD Billion)
      Fig.23	Global Lighting E-Glass  Market, 2020 – 2021 ()
      Fig.24	Global Optics E-Glass  Market, 2020 – 2021 (USD Billion)
      Fig.25	Global Optics E-Glass  Market, 2020 – 2021 ()
      Fig.26	Global Others E-Glass  Market, 2020 – 2021 (USD Billion)
      Fig.27	Global Others E-Glass  Market, 2020 – 2021 ()
      Fig.28	Global E-Glass  Market Share, by End-Users, 2019 & 2021 (USD Billion)
      Fig.29	Global E-Glass  Market Share, by End-Users, 2019 & 2021 ()
      Fig.30	Global Transportation E-Glass  Market, 2020 – 2021 (USD Billion)
      Fig.31	Global Transportation E-Glass  Market, 2020 – 2021 ()
      Fig.32	Global Building & Construction E-Glass  Market, 2020 – 2021 (USD Billion)
      Fig.33	Global Building & Construction E-Glass  Market, 2020 – 2021 ()
      Fig.34	Global Industrial E-Glass  Market, 2020 – 2021 (USD Billion)
      Fig.35	Global Industrial E-Glass  Market, 2020 – 2021 ()
      Fig.36	Global Wind Turbine E-Glass  Market, 2020 – 2021 (USD Billion)
      Fig.37	Global Wind Turbine E-Glass  Market, 2020 – 2021 ()
      Fig.38	Global Consumer Goods E-Glass  Market, 2020 – 2021 (USD Billion)
      Fig.39	Global Consumer Goods E-Glass  Market, 2020 – 2021 ()
      Fig.40	Global Electronics E-Glass  Market, 2020 – 2021 (USD Billion)
      Fig.41	Global Electronics E-Glass  Market, 2020 – 2021 ()
      Fig.42	Global Others E-Glass  Market, 2020 – 2021 (USD Billion)
      Fig.43	Global Others E-Glass  Market, 2020 – 2021 ()
      Fig.44	Global E-Glass  Market Share, by Region, 2019 & 2021 (USD Billion)
      Fig.45	Global E-Glass  Market Share, by Region, 2019 & 2021 ()
      Fig.46	North America E-Glass  Market, 2020 – 2021 (USD Billion)
      Fig.47	North America E-Glass  Market, 2020 – 2021 ()
      Fig.48	U.S. E-Glass  Market, 2020 – 2021 (USD Billion)
      Fig.49	U.S. E-Glass   Market, 2020 – 2021 ()
      Fig.50	Canada E-Glass  Market, 2020 – 2021 (USD Billion)
      Fig.51	Canada E-Glass   Market, 2020 – 2021 ()
      Fig.52	Europe E-Glass  Market, 2020 – 2021 (USD Billion)
      Fig.53	Europe E-Glass  Market, 2020 – 2021 ()
      Fig.54	Germany E-Glass  Market, 2020 – 2021 (USD Billion)
      Fig.55	Germany E-Glass   Market, 2020 – 2021 ()
      Fig.56	France E-Glass  Market, 2020 – 2021 (USD Billion)
      Fig.57	France E-Glass   Market, 2020 – 2021 ()
      Fig.58	U.K. E-Glass  Market, 2020 – 2021 (USD Billion)
      Fig.59	U.K. E-Glass   Market, 2020 – 2021 ()
      Fig.60	Italy E-Glass  Market, 2020 – 2021 (USD Billion)
      Fig.61	Italy E-Glass   Market, 2020 – 2021 ()
      Fig.62	Spain E-Glass  Market, 2020 – 2021 (USD Billion)
      Fig.63	Spain E-Glass   Market, 2020 – 2021 ()
      Fig.64	Rest of Europe E-Glass  Market, 2020 – 2021 (USD Billion)
      Fig.65	Rest of Europe E-Glass   Market, 2020 – 2021 ()
      Fig.66	Asia Pacific E-Glass  Market, 2020 – 2021 (USD Billion)
      Fig.67	Asia Pacific E-Glass  Market, 2020 – 2021 ()
      Fig.68	China E-Glass  Market, 2020 – 2021 (USD Billion)
      Fig.69	China E-Glass   Market, 2020 – 2021 ()
      Fig.70	Japan E-Glass  Market, 2020 – 2021 (USD Billion)
      Fig.71	Japan E-Glass   Market, 2020 – 2021 ()
      Fig.72	India E-Glass  Market, 2020 – 2021 (USD Billion)
      Fig.73	India E-Glass   Market, 2020 – 2021 ()
      Fig.74	South  Korea E-Glass  Market, 2020 – 2021 (USD Billion)
      Fig.75	South  Korea E-Glass   Market, 2020 – 2021 ()
      Fig.76	South-East Asia E-Glass  Market, 2020 – 2021 (USD Billion)
      Fig.77	South-East Asia E-Glass   Market, 2020 – 2021 ()
      Fig.78	Rest of Asia Pacific E-Glass  Market, 2020 – 2021 (USD Billion)
      Fig.79	Rest of Asia Pacific E-Glass   Market, 2020 – 2021 ()
      Fig.80	Latin America E-Glass  Market, 2020 – 2021 (USD Billion)
      Fig.81	Latin America E-Glass  Market, 2020 – 2021 ()
      Fig.82	Brazil E-Glass  Market, 2020 – 2021 (USD Billion)
      Fig.83	Brazil E-Glass   Market, 2020 – 2021 ()
      Fig.84	Mexico E-Glass  Market, 2020 – 2021 (USD Billion)
      Fig.85	Mexico E-Glass   Market, 2020 – 2021 ()
      Fig.86	Rest of Latin America E-Glass  Market, 2020 – 2021 (USD Billion)
      Fig.87	Rest of Latin America E-Glass   Market, 2020 – 2021 ()
      Fig.88	The Middle-East and Africa E-Glass  Market, 2020 – 2021 (USD Billion)
      Fig.89	The Middle-East and Africa E-Glass  Market, 2020 – 2021 ()
      Fig.90	GCC Countries E-Glass  Market, 2020 – 2021 (USD Billion)
      Fig.91	GCC Countries E-Glass   Market, 2020 – 2021 ()
      Fig.92	South Africa E-Glass  Market, 2020 – 2021 (USD Billion)
      Fig.93	South Africa E-Glass   Market, 2020 – 2021 ()
      Fig.94	Rest of Middle-East Africa E-Glass  Market, 2020 – 2021 (USD Billion)
      Fig.95	Rest of Middle-East Africa E-Glass   Market, 2020 – 2021 ()
      Fig.96	Global E-Glass  Production and Consumption, 2020 – 2021 ()
      Fig.97	North America E-Glass  Production and Consumption, 2020 – 2021 (USD Billion) ()
      Fig.98	Europe E-Glass  Production and Consumption, 2020 – 2021 (USD Billion) ()
      Fig.99	Asia Pacific E-Glass  Production and Consumption, 2020 – 2021 (USD Billion) ()
      Fig.100	Latin America E-Glass  Production and Consumption, 2020 – 2021 (USD Billion) ()
      Fig.101	The Middle-East and Africa E-Glass  Production and Consumption, 2020 – 2021 (USD Billion) ()
      Fig.102	Competitor Market Share – Revenue
      Fig.103	Competitor Market Share – Volume
      Fig.104	AGY Revenue and Growth Rate
      Fig.105	AGY Market Share
      Fig.106	Jiangsu Juiding New Material Co Ltd Revenue and Growth Rate
      Fig.107	Jiangsu Juiding New Material Co Ltd Market Share
      Fig.108	Jushi Group Co Ltd Revenue and Growth Rate
      Fig.109	Jushi Group Co Ltd Market Share
      Fig.110	Nippon Electric Glass Co Ltd Revenue and Growth Rate
      Fig.111	Nippon Electric Glass Co Ltd Market Share
      Fig.112	Novaglass.com Revenue and Growth Rate
      Fig.113	Novaglass.com Market Share
      Fig.114	Owens Corning Revenue and Growth Rate
      Fig.115	Owens Corning Market Share
      Fig.116	PBM Insulations Pvt Ltd Revenue and Growth Rate
      Fig.117	PBM Insulations Pvt Ltd Market Share
      Fig.118	PPG Industries Inc Revenue and Growth Rate
      Fig.119	PPG Industries Inc Market Share
      Fig.120	Rex Sealing & Packing Industries Pvt Limited Revenue and Growth Rate
      Fig.121	Rex Sealing & Packing Industries Pvt Limited Market Share
      Fig.122	SCHOTT AG Revenue and Growth Rate
      Fig.123	SCHOTT AG Market Share
      Fig.124	Market Dynamics
      Fig.125	Global E-Glass  – Value Chain Analysis
      Fig.126	Key Mandates and Regulations
      Fig.127	Technology Roadmap and Timeline
      Fig.128	Market Attractiveness Analysis – By Type
      Fig.129	Market Attractiveness Analysis – By Application
      Fig.130	Market Attractiveness Analysis – By End-Users
      Fig.131	Market Attractiveness Analysis – By Region
      Fig.132	Manufacturing Cost Structure of E-Glass
      Fig.133	E-Glass  Industrial Chain Analysis
      Fig.134	Market Channels
      Fig.135	Marketing Channel Development Trend
      Fig.136	Growth in World Gross Product, 2008-2018
      

      List of Tables

      Table 1	Global E-Glass  Market, 2019 & 2021 (USD Billion)
      Table 2	Global E-Glass  Market, by Type, 2020 – 2021 (USD Billion)
      Table 3	Global E-Glass  Market, by Type, 2020 – 2021 ()
      Table 4	Global E-Glass  Market, by Application, 2020 – 2021 (USD Billion)
      Table 5	Global E-Glass  Market, by Application, 2020 – 2021 ()
      Table 6	Global E-Glass  Market, by End-Users, 2020 – 2021 (USD Billion)
      Table 7	Global E-Glass  Market, by End-Users, 2020 – 2021 ()
      Table 8	Global E-Glass  Market, by Region, 2020 – 2021 (USD Billion)
      Table 9	Global E-Glass  Market, by Region, 2020 – 2021 ()
      Table 10 North America E-Glass  Market, by Country, 2020 – 2021 (USD Billion)
      Table 11 North America E-Glass  Market, by Country, 2020 – 2021 ()
      Table 12 North America E-Glass  Market, by Type, 2020 – 2021 (USD Billion)
      Table 13 North America E-Glass  Market, by Type, 2020 – 2021 ()
      Table 14 North America E-Glass  Market, by Application, 2020 – 2021 (USD Billion)
      Table 15 North America E-Glass  Market, by Application, 2020 – 2021 ()
      Table 16 North America E-Glass  Market, by End-Users, 2020 – 2021 (USD Billion)
      Table 17 North America E-Glass  Market, by End-Users, 2020 – 2021 ()
      Table 18 Europe E-Glass  Market, by Country, 2020 – 2021 (USD Billion)
      Table 19 Europe E-Glass  Market, by Country, 2020 – 2021 ()
      Table 20 Europe E-Glass  Market, by Type, 2020 – 2021 (USD Billion)
      Table 21 Europe E-Glass  Market, by Type, 2020 – 2021 ()
      Table 22 Europe E-Glass  Market, by Application, 2020 – 2021 (USD Billion)
      Table 23 Europe E-Glass  Market, by Application, 2020 – 2021 ()
      Table 24 Europe E-Glass  Market, by End-Users, 2020 – 2021 (USD Billion)
      Table 25 Europe E-Glass  Market, by End-Users, 2020 – 2021 ()
      Table 26 Asia Pacific E-Glass  Market, by Country, 2020 – 2021 (USD Billion)
      Table 27 Asia Pacific E-Glass  Market, by Country, 2020 – 2021 ()
      Table 28 Asia Pacific E-Glass  Market, by Type, 2020 – 2021 (USD Billion)
      Table 29 Asia Pacific E-Glass  Market, by Type, 2020 – 2021 ()
      Table 30 Asia Pacific E-Glass  Market, by Application, 2020 – 2021 (USD Billion)
      Table 31 Asia Pacific E-Glass  Market, by Application, 2020 – 2021 ()
      Table 32 Asia Pacific E-Glass  Market, by End-Users, 2020 – 2021 (USD Billion)
      Table 33 Asia Pacific E-Glass  Market, by End-Users, 2020 – 2021 ()
      Table 34 Latin America E-Glass  Market, by Country, 2020 – 2021 (USD Billion)
      Table 35 Latin America E-Glass  Market, by Country, 2020 – 2021 ()
      Table 36 Latin America E-Glass  Market, by Type, 2020 – 2021 (USD Billion)
      Table 37 Latin America E-Glass  Market, by Type, 2020 – 2021 ()
      Table 38 Latin America E-Glass  Market, by Application, 2020 – 2021 (USD Billion)
      Table 39 Latin America E-Glass  Market, by Application, 2020 – 2021 ()
      Table 40 Latin America E-Glass  Market, by End-Users, 2020 – 2021 (USD Billion)
      Table 41 Latin America E-Glass  Market, by End-Users, 2020 – 2021 ()
      Table 42 The Middle-East and Africa E-Glass  Market, by Country, 2020 – 2021 (USD Billion)
      Table 43 The Middle-East and Africa E-Glass  Market, by Country, 2020 – 2021 ()
      Table 44 The Middle-East and Africa E-Glass  Market, by Type, 2020 – 2021 (USD Billion)
      Table 45 The Middle-East and Africa E-Glass  Market, by Type, 2020 – 2021 ()
      Table 46 The Middle-East and Africa E-Glass  Market, by Application, 2020 – 2021 (USD Billion)
      Table 47 The Middle-East and Africa E-Glass  Market, by Application, 2020 – 2021 ()
      Table 48 The Middle-East and Africa E-Glass  Market, by End-Users, 2020 – 2021 (USD Billion)
      Table 49 The Middle-East and Africa E-Glass  Market, by End-Users, 2020 – 2021 ()
      Table 50 North America E-Glass  Production, Consumption, Export, Import, 2020 – 2019
      Table 51 Europe E-Glass  Production, Consumption, Export, Import, 2020 – 2019
      Table 52 Asia Pacific E-Glass  Production, Consumption, Export, Import, 2020 – 2019
      Table 53 Latin America E-Glass  Production, Consumption, Export, Import, 2020 – 2019
      Table 54 The Middle-East and Africa E-Glass  Production, Consumption, Export, Import, 2020 – 2019
      Table 55 Global E-Glass  Market - Company Revenue Analysis, 2016 – 2019 (USD Billion)
      Table 56 Global E-Glass  Market - Company Revenue Share Analysis, 2016 – 2019 (%)
      Table 57 Global E-Glass  Market - Company Volume Analysis, 2020 – 2019 ()
      Table 58 Global E-Glass  Market - Company Volume Share Analysis, 2020 – 2019 (%)
      Table 59 Acquisitions and Mergers
      Table 60 Market Drivers – Impact Analysis
      Table 61 Market Restraints
      Table 62 Market Opportunities
      Table 63 Production Base and Market Concentration Rate of Raw Material
      Table 64 Key Suppliers of Raw Materials
      Table 65 Raw Materials Sources of E-Glass  Major Manufacturers
      Table 66 Major Buyers of E-Glass
      Table 67 Distributors/Traders of E-Glass  by Region
      

Industry Major Market Players

  • AGY
  • Jiangsu Juiding New Material Co Ltd.
  • Jushi Group Co Ltd.
  • Nippon Electric Glass Co Ltd.
  • Novaglass.com
  • Owens Corning
  • PBM Insulations Pvt Ltd.
  • PPG Industries Inc.
  • Rex Sealing & Packing Industries Pvt Limited
  • SCHOTT AG