Search Market Research Report

Discover Our Latest Reports
Discover Our Featured Reports
Discover Top Selling Reports

E-Glass Fiber Market Size, Share Global Analysis Report, , 2021 – 2026

report img

E-Glass Fiber Market By Types (General-Purpose Glass Fiber & Special-Purpose Glass Fiber), By Application (Construction, Transportation, Industrial, Consumer, & Wind), and By Regions - Global Industry Perspective, Comprehensive Analysis, and Forecast, 2021 – 2026

Industry Insights

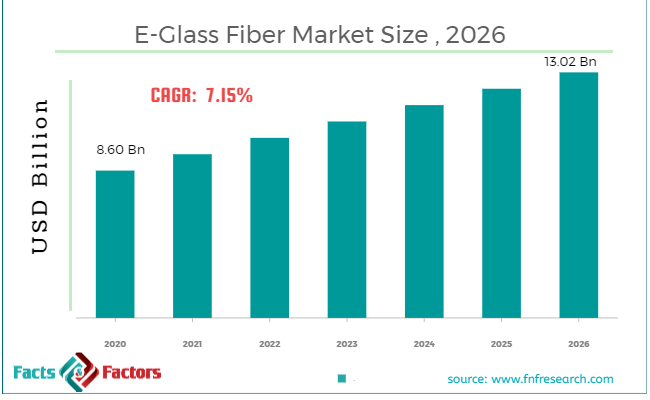
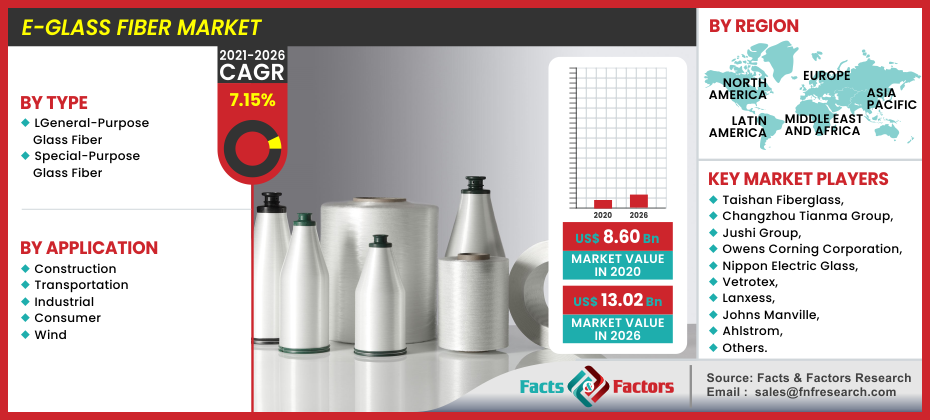
[216+ Pages Report] As per the latest research and survey report issued by Facts and Factors, the global e-glass fiber market was valued at around USD 8.60 Billion in 2020 and is expected to register revenues worth USD 13.02 Billion by the end of 2026, growing at an exceptional CAGR of approximately 7.15% between 2021 and 2026.

Glass Fiber Market Size

To know more about this report | Request Free Sample Copy

logoMarket Overview

E-glass fiber is an industrial material that can be produced easily from raw materials. It is a versatile version of glass fiber. This glass fiber possesses properties such as chemical attack resistance, transparency, hardness, and stability. The demand for e-glass fibers is increasing basically due to its properties such as flexibility, stiffness, and strength. The e-glass fibers are used in the production of various special-purpose products, structural composites, and printed circuit boards. It is a version of glass fiber that can provide excellent insulation for electric wires and other electrical conduits. These excellent properties have increased the use of e-glass fiber in the production of different types of fiberglass.  The intricately woven fibers of glass make it better than fibers such as polymer and carbon fiber.


Glass Fiber Market


E-Glass Fiber Market

To know more about this report | Request Free Sample Copy

logoIndustry Growth Factors

Advancements in research and technology and continuous up-gradation of the previous iteration of e-glass fiber will drive the market during the forecast years. A wide range of applications is dependent on e-glass fiber. Additionally, when compared to glass and silk fibers, e-glass fibers fares the best at an optimal price. The defense and aerospace industry has a tremendous applicable components which has given a rise to government funding and incentive for the market. Furthermore, advent of an increase in wind energy plants and swift change from traditional to alternative energy sources will further drive the market of global e-glass fiber to a lucrative market during the forecast period. High initial cost and intricate manufacturing processes will hamper the growth of the market to a certain extent.

Growing need for high-performance fiber glass and technological advancements for the production of lightweight material for automotive parts’ production is projected to drive the global e-glass fiber market. Furthermore, it is also widely used as additives in building & construction, aerospace, marine, wind energy, automotive & transport, pipes & tanks, and other industrial sectors owing to its cost effectiveness, lightweight products, and superior durability. The research carried out in the area of thermal insulation of e-glass fiber helps open new funding opportunities for the market.

logoSegmentation Analysis

The global e-fiber glass market can be segmented on the basis of types, applications, and regions.

The global e-glass fiber market can be divided into general-purpose glass fiber and special-purpose glass fiber on the basis of types. The global e-glass fiber can be broken down into construction, transportation, industrial, consumer, and wind on the basis of applications.

logoReport Scope

Report Attribute

Details

Market Size in 2020

USD 8.60 Billion

Projected Market Size in 2026

USD 13.02 Billion

CAGR Growth Rate

7.15% CAGR

Base Year

2020

Forecast Years

2021-2026

Key Market Players

Taishan Fiberglass, Changzhou Tianma Group, Jushi Group, Owens Corning Corporation, Nippon Electric Glass, Vetrotex, Lanxess, Johns Manville, Sichuan Weibo New Material Group, Ahlstrom, and PPG Industries, among others.

Key Segment

By Types, Application, and Region

Major Regions Covered

North America, Europe, Asia Pacific, Latin America, and the Middle East & Africa

Purchase Options

Request customized purchase options to meet your research needs. Explore purchase options

logo Regional Analysis

The region of North America is expected to witness the market share during the forecast period. The extensively developed aerospace and defense sector in the region alongside a well-funded government program for further research and development will drive the growth of the market in the region.

logoCompetitive Players

The global participants in the global e-fiber glass market are :

  • Taishan Fiberglass
  • Changzhou Tianma Group
  • Jushi Group
  • Owens Corning Corporation
  • Nippon Electric Glass
  • Vetrotex, Lanxess
  • Johns Manville
  • Sichuan Weibo New Material Group
  • Ahlstrom
  • PPG Industries
  • among others

logo By Type Segment Analysis.

  • General-Purpose Glass Fiber
  • Special-Purpose Glass Fiber

logo By Application Segment Analysis

  • Construction
  • Transportation
  • Industrial
  • Consumer
  • Wind

logo By Regional Segment Analysis

  • North America
    • U.S.
    • Canada
  • Europe
    • UK
    • France
    • Germany
    • Italy
    • Spain
    • Rest of Europe
  • Asia Pacific
    • China
    • Japan
    • India
    • South Korea
    • Southeast Asia
    • Rest of Asia Pacific
  • Latin America
    • Brazil
    • Mexico
    • Rest of Latin America
  • Middle East and Africa
    • GCC Countries
    • South Africa
    • Rest of MEA

Table of Content

  1. Chapter 1 Executive Summary
    1. 1.1. Introduction of E-Glass Fiber
    2. 1.2. Global E-Glass Fiber Market, 2019 & 2021 (USD Billion)
    3. 1.3. Global E-Glass Fiber Market, 2020 – 2021 (USD Billion) ()
    4. 1.4. Global E-Glass Fiber Market Absolute Revenue Opportunity, 2020 – 2021 (USD Billion)
    5. 1.5. Global E-Glass Fiber Market Incremental Revenue Opportunity, 2020 – 2021 (USD Billion)
  2. Chapter 2 E-Glass Fiber Market – Type Analysis
    1. 2.1. Global E-Glass Fiber Market – Type Overview
    2. 2.2. Global E-Glass Fiber Market Share, by Type, 2019 & 2021 (USD Billion)
    3. 2.3. Global E-Glass Fiber Market share, by Type, 2019 & 2021 ()
    4. 2.4. General-Purpose Glass Fiber
      1. 2.4.1. Global General-Purpose Glass Fiber E-Glass Fiber Market, 2020 – 2021 (USD Billion)
      2. 2.4.2. Global General-Purpose Glass Fiber E-Glass Fiber Market, 2020 – 2021 ()
    5. 2.5. Special-Purpose Glass Fiber
      1. 2.5.1. Global Special-Purpose Glass Fiber E-Glass Fiber Market, 2020 – 2021 (USD Billion)
      2. 2.5.2. Global Special-Purpose Glass Fiber E-Glass Fiber Market, 2020 – 2021 ()
  3. Chapter 3 E-Glass Fiber Market – Application Analysis
    1. 3.1. Global E-Glass Fiber Market – Application Overview
    2. 3.2. Global E-Glass Fiber Market Share, by Application, 2019 & 2021 (USD Billion)
    3. 3.3. Global E-Glass Fiber Market share, by Application, 2019 & 2021 ()
    4. 3.4. Construction
      1. 3.4.1. Global Construction E-Glass Fiber Market, 2020 – 2021 (USD Billion)
      2. 3.4.2. Global Construction E-Glass Fiber Market, 2020 – 2021 ()
    5. 3.5. Transportation
      1. 3.5.1. Global Transportation E-Glass Fiber Market, 2020 – 2021 (USD Billion)
      2. 3.5.2. Global Transportation E-Glass Fiber Market, 2020 – 2021 ()
    6. 3.6. Industrial
      1. 3.6.1. Global Industrial E-Glass Fiber Market, 2020 – 2021 (USD Billion)
      2. 3.6.2. Global Industrial E-Glass Fiber Market, 2020 – 2021 ()
    7. 3.7. Consumer
      1. 3.7.1. Global Consumer E-Glass Fiber Market, 2020 – 2021 (USD Billion)
      2. 3.7.2. Global Consumer E-Glass Fiber Market, 2020 – 2021 ()
    8. 3.8. Wind
      1. 3.8.1. Global Wind E-Glass Fiber Market, 2020 – 2021 (USD Billion)
      2. 3.8.2. Global Wind E-Glass Fiber Market, 2020 – 2021 ()
  4. Chapter 4 E-Glass Fiber Market – Regional Analysis
    1. 4.1. Global E-Glass Fiber Market Regional Overview
    2. 4.2. Global E-Glass Fiber Market Share, by Region, 2019 & 2021 (USD Billion)
    3. 4.3. Global E-Glass Fiber Market Share, by Region, 2019 & 2021 ()
    4. 4.4. North America
      1. 4.4.1. North America E-Glass Fiber Market, 2020 – 2021 (USD Billion)
        1. 4.4.1.1. North America E-Glass Fiber Market, by Country, 2020 – 2021 (USD Billion)
      2. 4.4.2. North America Market, 2020 – 2021 ()
        1. 4.4.2.1. North America E-Glass Fiber Market, by Country, 2020 – 2021 ()
      3. 4.4.3. North America E-Glass Fiber Market, by Type, 2020 – 2021
        1. 4.4.3.1. North America E-Glass Fiber Market, by Type, 2020 – 2021 (USD Billion)
        2. 4.4.3.2. North America E-Glass Fiber Market, by Type, 2020 – 2021 ()
      4. 4.4.4. North America E-Glass Fiber Market, by Application, 2020 – 2021
        1. 4.4.4.1. North America E-Glass Fiber Market, by Application, 2020 – 2021 (USD Billion)
        2. 4.4.4.2. North America E-Glass Fiber Market, by Application, 2020 – 2021 ()
      5. 4.4.5. U.S.
        1. 4.4.5.1. U.S. E-Glass Fiber Market, 2020 – 2021 (USD Billion)
        2. 4.4.5.2. U.S. E-Glass Fiber Market, 2020 – 2021 ()
      6. 4.4.6. Canada
        1. 4.4.6.1. Canada E-Glass Fiber Market, 2020 – 2021 (USD Billion)
        2. 4.4.6.2. Canada E-Glass Fiber Market, 2020 – 2021 ()
    5. 4.5. Europe
      1. 4.5.1. Europe E-Glass Fiber Market, 2020 – 2021 (USD Billion)
        1. 4.5.1.1. Europe E-Glass Fiber Market, by Country, 2020 – 2021 (USD Billion)
      2. 4.5.2. Europe Market, 2020 – 2021 ()
        1. 4.5.2.1. Europe E-Glass Fiber Market, by Country, 2020 – 2021 ()
      3. 4.5.3. Europe E-Glass Fiber Market, by Type, 2020 – 2021
        1. 4.5.3.1. Europe E-Glass Fiber Market, by Type, 2020 – 2021 (USD Billion)
        2. 4.5.3.2. Europe E-Glass Fiber Market, by Type, 2020 – 2021 ()
      4. 4.5.4. Europe E-Glass Fiber Market, by Application, 2020 – 2021
        1. 4.5.4.1. Europe E-Glass Fiber Market, by Application, 2020 – 2021 (USD Billion)
        2. 4.5.4.2. Europe E-Glass Fiber Market, by Application, 2020 – 2021 ()
      5. 4.5.5. Germany
        1. 4.5.5.1. Germany E-Glass Fiber Market, 2020 – 2021 (USD Billion)
        2. 4.5.5.2. Germany E-Glass Fiber Market, 2020 – 2021 ()
      6. 4.5.6. France
        1. 4.5.6.1. France E-Glass Fiber Market, 2020 – 2021 (USD Billion)
        2. 4.5.6.2. France E-Glass Fiber Market, 2020 – 2021 ()
      7. 4.5.7. U.K.
        1. 4.5.7.1. U.K. E-Glass Fiber Market, 2020 – 2021 (USD Billion)
        2. 4.5.7.2. U.K. E-Glass Fiber Market, 2020 – 2021 ()
      8. 4.5.8. Italy
        1. 4.5.8.1. Italy E-Glass Fiber Market, 2020 – 2021 (USD Billion)
        2. 4.5.8.2. Italy E-Glass Fiber Market, 2020 – 2021 ()
      9. 4.5.9. Spain
        1. 4.5.9.1. Spain E-Glass Fiber Market, 2020 – 2021 (USD Billion)
        2. 4.5.9.2. Spain E-Glass Fiber Market, 2020 – 2021 ()
      10. 4.5.10. Rest of Europe
        1. 4.5.10.1. Rest of Europe E-Glass Fiber Market, 2020 – 2021 (USD Billion)
        2. 4.5.10.2. Rest of Europe E-Glass Fiber Market, 2020 – 2021 ()
    6. 4.6. Asia Pacific
      1. 4.6.1. Asia Pacific E-Glass Fiber Market, 2020 – 2021 (USD Billion)
        1. 4.6.1.1. Asia Pacific E-Glass Fiber Market, by Country, 2020 – 2021 (USD Billion)
      2. 4.6.2. Asia Pacific Market, 2020 – 2021 ()
        1. 4.6.2.1. Asia Pacific E-Glass Fiber Market, by Country, 2020 – 2021 ()
      3. 4.6.3. Asia Pacific E-Glass Fiber Market, by Type, 2020 – 2021
        1. 4.6.3.1. Asia Pacific E-Glass Fiber Market, by Type, 2020 – 2021 (USD Billion)
        2. 4.6.3.2. Asia Pacific E-Glass Fiber Market, by Type, 2020 – 2021 ()
      4. 4.6.4. Asia Pacific E-Glass Fiber Market, by Application, 2020 – 2021
        1. 4.6.4.1. Asia Pacific E-Glass Fiber Market, by Application, 2020 – 2021 (USD Billion)
        2. 4.6.4.2. Asia Pacific E-Glass Fiber Market, by Application, 2020 – 2021 ()
      5. 4.6.5. China
        1. 4.6.5.1. China E-Glass Fiber Market, 2020 – 2021 (USD Billion)
        2. 4.6.5.2. China E-Glass Fiber Market, 2020 – 2021 ()
      6. 4.6.6. Japan
        1. 4.6.6.1. Japan E-Glass Fiber Market, 2020 – 2021 (USD Billion)
        2. 4.6.6.2. Japan E-Glass Fiber Market, 2020 – 2021 ()
      7. 4.6.7. India
        1. 4.6.7.1. India E-Glass Fiber Market, 2020 – 2021 (USD Billion)
        2. 4.6.7.2. India E-Glass Fiber Market, 2020 – 2021 ()
      8. 4.6.8. South Korea
        1. 4.6.8.1. South Korea E-Glass Fiber Market, 2020 – 2021 (USD Billion)
        2. 4.6.8.2. South Korea E-Glass Fiber Market, 2020 – 2021 ()
      9. 4.6.9. South-East Asia
        1. 4.6.9.1. South-East Asia E-Glass Fiber Market, 2020 – 2021 (USD Billion)
        2. 4.6.9.2. South-East Asia E-Glass Fiber Market, 2020 – 2021 ()
      10. 4.6.10. Rest of Asia Pacific
        1. 4.6.10.1. Rest of Asia Pacific E-Glass Fiber Market, 2020 – 2021 (USD Billion)
        2. 4.6.10.2. Rest of Asia Pacific E-Glass Fiber Market, 2020 – 2021 ()
    7. 4.7. Latin America
      1. 4.7.1. Latin America E-Glass Fiber Market, 2020 – 2021 (USD Billion)
        1. 4.7.1.1. Latin America E-Glass Fiber Market, by Country, 2020 – 2021 (USD Billion)
      2. 4.7.2. Latin America Market, 2020 – 2021 ()
        1. 4.7.2.1. Latin America E-Glass Fiber Market, by Country, 2020 – 2021 ()
      3. 4.7.3. Latin America E-Glass Fiber Market, by Type, 2020 – 2021
        1. 4.7.3.1. Latin America E-Glass Fiber Market, by Type, 2020 – 2021 (USD Billion)
        2. 4.7.3.2. Latin America E-Glass Fiber Market, by Type, 2020 – 2021 ()
      4. 4.7.4. Latin America E-Glass Fiber Market, by Application, 2020 – 2021
        1. 4.7.4.1. Latin America E-Glass Fiber Market, by Application, 2020 – 2021 (USD Billion)
        2. 4.7.4.2. Latin America E-Glass Fiber Market, by Application, 2020 – 2021 ()
      5. 4.7.5. Brazil
        1. 4.7.5.1. Brazil E-Glass Fiber Market, 2020 – 2021 (USD Billion)
        2. 4.7.5.2. Brazil E-Glass Fiber Market, 2020 – 2021 ()
      6. 4.7.6. Mexico
        1. 4.7.6.1. Mexico E-Glass Fiber Market, 2020 – 2021 (USD Billion)
        2. 4.7.6.2. Mexico E-Glass Fiber Market, 2020 – 2021 ()
      7. 4.7.7. Rest of Latin America
        1. 4.7.7.1. Rest of Latin America E-Glass Fiber Market, 2020 – 2021 (USD Billion)
        2. 4.7.7.2. Rest of Latin America E-Glass Fiber Market, 2020 – 2021 ()
    8. 4.8. The Middle-East and Africa
      1. 4.8.1. The Middle-East and Africa E-Glass Fiber Market, 2020 – 2021 (USD Billion)
        1. 4.8.1.1. The Middle-East and Africa E-Glass Fiber Market, by Country, 2020 – 2021 (USD Billion)
      2. 4.8.2. The Middle-East and Africa Market, 2020 – 2021 ()
        1. 4.8.2.1. The Middle-East and Africa E-Glass Fiber Market, by Country, 2020 – 2021 ()
      3. 4.8.3. The Middle-East and Africa E-Glass Fiber Market, by Type, 2020 – 2021
        1. 4.8.3.1. The Middle-East and Africa E-Glass Fiber Market, by Type, 2020 – 2021 (USD Billion)
        2. 4.8.3.2. The Middle-East and Africa E-Glass Fiber Market, by Type, 2020 – 2021 ()
      4. 4.8.4. The Middle-East and Africa E-Glass Fiber Market, by Application, 2020 – 2021
        1. 4.8.4.1. The Middle-East and Africa E-Glass Fiber Market, by Application, 2020 – 2021 (USD Billion)
        2. 4.8.4.2. The Middle-East and Africa E-Glass Fiber Market, by Application, 2020 – 2021 ()
      5. 4.8.5. GCC Countries
        1. 4.8.5.1. GCC Countries E-Glass Fiber Market, 2020 – 2021 (USD Billion)
        2. 4.8.5.2. GCC Countries E-Glass Fiber Market, 2020 – 2021 ()
      6. 4.8.6. South Africa
        1. 4.8.6.1. South Africa E-Glass Fiber Market, 2020 – 2021 (USD Billion)
        2. 4.8.6.2. South Africa E-Glass Fiber Market, 2020 – 2021 ()
      7. 4.8.7. Rest of Middle-East Africa
        1. 4.8.7.1. Rest of Middle-East Africa E-Glass Fiber Market, 2020 – 2021 (USD Billion)
        2. 4.8.7.2. Rest of Middle-East Africa E-Glass Fiber Market, 2020 – 2021 ()
  5. Chapter 5 E-Glass Fiber Production, Consumption, Export, Import by Regions
    1. 5.1. Global E-Glass Fiber Production and Consumption, 2020 – 2021 ()
    2. 5.2. Global Import and Export Analysis, by Region
  6. Chapter 6 E-Glass Fiber Market – Competitive Landscape
    1. 6.1. Competitor Market Share – Revenue
    2. 6.2. Market Concentration Rate Analysis, Top 3 and Top 5 Players
    3. 6.3. Competitor Market Share – Volume
    4. 6.4. Strategic Developments
      1. 6.4.1. Acquisitions and Mergers
      2. 6.4.2. New Products
      3. 6.4.3. Research & Development Activities
  7. Chapter 7 Company Profiles
    1. 7.1. Taishan Fiberglass
      1. 7.1.1. Company Overview
      2. 7.1.2. Product/Service Portfolio
      3. 7.1.3. Taishan Fiberglass Sales, Revenue, Price, and Gross Margin
      4. 7.1.4. Taishan Fiberglass Revenue and Growth Rate
      5. 7.1.5. Taishan Fiberglass Market Share
      6. 7.1.6. Recent Initiatives, Funding/VC Activities, and Technological Innovations
    2. 7.2. Changzhou Tianma Group
      1. 7.2.1. Company Overview
      2. 7.2.2. Product/Service Portfolio
      3. 7.2.3. Changzhou Tianma Group Sales, Revenue, Price, and Gross Margin
      4. 7.2.4. Changzhou Tianma Group Revenue and Growth Rate
      5. 7.2.5. Changzhou Tianma Group Market Share
      6. 7.2.6. Recent Initiatives, Funding/VC Activities, and Technological Innovations
    3. 7.3. Jushi Group
      1. 7.3.1. Company Overview
      2. 7.3.2. Product/Service Portfolio
      3. 7.3.3. Jushi Group Sales, Revenue, Price, and Gross Margin
      4. 7.3.4. Jushi Group Revenue and Growth Rate
      5. 7.3.5. Jushi Group Market Share
      6. 7.3.6. Recent Initiatives, Funding/VC Activities, and Technological Innovations
    4. 7.4. Owens Corning Corporation
      1. 7.4.1. Company Overview
      2. 7.4.2. Product/Service Portfolio
      3. 7.4.3. Owens Corning Corporation Sales, Revenue, Price, and Gross Margin
      4. 7.4.4. Owens Corning Corporation Revenue and Growth Rate
      5. 7.4.5. Owens Corning Corporation Market Share
      6. 7.4.6. Recent Initiatives, Funding/VC Activities, and Technological Innovations
    5. 7.5. Nippon Electric Glass
      1. 7.5.1. Company Overview
      2. 7.5.2. Product/Service Portfolio
      3. 7.5.3. Nippon Electric Glass Sales, Revenue, Price, and Gross Margin
      4. 7.5.4. Nippon Electric Glass Revenue and Growth Rate
      5. 7.5.5. Nippon Electric Glass Market Share
      6. 7.5.6. Recent Initiatives, Funding/VC Activities, and Technological Innovations
    6. 7.6. Vetrotex
      1. 7.6.1. Company Overview
      2. 7.6.2. Product/Service Portfolio
      3. 7.6.3. Vetrotex Sales, Revenue, Price, and Gross Margin
      4. 7.6.4. Vetrotex Revenue and Growth Rate
      5. 7.6.5. Vetrotex Market Share
      6. 7.6.6. Recent Initiatives, Funding/VC Activities, and Technological Innovations
    7. 7.7. Lanxess
      1. 7.7.1. Company Overview
      2. 7.7.2. Product/Service Portfolio
      3. 7.7.3. Lanxess Sales, Revenue, Price, and Gross Margin
      4. 7.7.4. Lanxess Revenue and Growth Rate
      5. 7.7.5. Lanxess Market Share
      6. 7.7.6. Recent Initiatives, Funding/VC Activities, and Technological Innovations
    8. 7.8. Johns Manville
      1. 7.8.1. Company Overview
      2. 7.8.2. Product/Service Portfolio
      3. 7.8.3. Johns Manville Sales, Revenue, Price, and Gross Margin
      4. 7.8.4. Johns Manville Revenue and Growth Rate
      5. 7.8.5. Johns Manville Market Share
      6. 7.8.6. Recent Initiatives, Funding/VC Activities, and Technological Innovations
    9. 7.9. Sichuan Weibo New Material Group
      1. 7.9.1. Company Overview
      2. 7.9.2. Product/Service Portfolio
      3. 7.9.3. Sichuan Weibo New Material Group Sales, Revenue, Price, and Gross Margin
      4. 7.9.4. Sichuan Weibo New Material Group Revenue and Growth Rate
      5. 7.9.5. Sichuan Weibo New Material Group Market Share
      6. 7.9.6. Recent Initiatives, Funding/VC Activities, and Technological Innovations
    10. 7.10. Ahlstrom
      1. 7.10.1. Company Overview
      2. 7.10.2. Product/Service Portfolio
      3. 7.10.3. Ahlstrom Sales, Revenue, Price, and Gross Margin
      4. 7.10.4. Ahlstrom Revenue and Growth Rate
      5. 7.10.5. Ahlstrom Market Share
      6. 7.10.6. Recent Initiatives, Funding/VC Activities, and Technological Innovations
    11. 7.11. PPG Industries
      1. 7.11.1. Company Overview
      2. 7.11.2. Product/Service Portfolio
      3. 7.11.3. PPG Industries Sales, Revenue, Price, and Gross Margin
      4. 7.11.4. PPG Industries Revenue and Growth Rate
      5. 7.11.5. PPG Industries Market Share
      6. 7.11.6. Recent Initiatives, Funding/VC Activities, and Technological Innovations
  8. Chapter 8 E-Glass Fiber — Industry Analysis
    1. 8.1. Introduction and Taxonomy
    2. 8.2. E-Glass Fiber Market – Key Trends
      1. 8.2.1. Market Drivers
      2. 8.2.2. Market Restraints
      3. 8.2.3. Market Opportunities
    3. 8.3. Value Chain Analysis
    4. 8.4. Key Mandates and Regulations
    5. 8.5. Technology Roadmap and Timeline
    6. 8.6. E-Glass Fiber Market – Attractiveness Analysis
      1. 8.6.1. By Type
      2. 8.6.2. By Application
      3. 8.6.3. By Region
  9. Chapter 9 Raw Material Analysis
    1. 9.1. E-Glass Fiber Key Raw Material Analysis
      1. 9.1.1. Key Raw Materials
      2. 9.1.2. Price Trend of Key Raw Materials
    2. 9.2. Key Suppliers of Raw Materials
    3. 9.3. Proportion of Manufacturing Cost Structure
      1. 9.3.1. Raw Materials Cost
      2. 9.3.2. Labor Cost
      3. 9.3.3. Manufacturing Expenses
      4. 9.3.4. Miscellaneous Expenses
    4. 9.4. Manufacturing Cost Analysis of E-Glass Fiber
  10. Chapter 10 Industrial Chain, Sourcing Strategy, and Downstream Buyers
    1. 10.1. E-Glass Fiber Industrial Chain Analysis
    2. 10.2. Upstream Raw Materials Sourcing
      1. 10.2.1. Risk Mitigation:
      2. 10.2.2. Supplier Relationships:
      3. 10.2.3. Business Processes:
      4. 10.2.4. Securing the Product:
    3. 10.3. Raw Materials Sources of E-Glass Fiber Major Manufacturers
    4. 10.4. Downstream Buyers
    5. 10.5. Distributors/Traders List
  11. Chapter 11 Marketing Strategy Analysis, Distributors
    1. 11.1. Marketing Channel
    2. 11.2. Direct Marketing
    3. 11.3. Indirect Marketing
    4. 11.4. Marketing Channel Development Trends
    5. 11.5. Economic/Political Environmental Change
  12. Chapter 12 Report Conclusion & Key Insights
    1. 12.1. Key Insights from Primary Interviews & Surveys Respondents
    2. 12.2. Key Takeaways from Analysts, Consultants, and Industry Leaders
  13. Chapter 13 Research Approach & Methodology
    1. 13.1. Report Description
    2. 13.2. Research Scope
    3. 13.3. Research Methodology
      1. 13.3.1. Secondary Research
      2. 13.3.2. Primary Research
      3. 13.3.3. Statistical Models
        1. 13.3.3.1. Company Share Analysis Model
        2. 13.3.3.2. Revenue Based Modeling
      4. 13.3.4. Research Limitations

      List of Figures

      Fig.1	Product Picture of E-Glass Fiber
      Fig.2	Global E-Glass Fiber Market, 2020 – 2021 (USD Billion)
      Fig.3	Global E-Glass Fiber Market, 2020 – 2021 ()
      Fig.4	Global E-Glass Fiber Market Absolute Revenue Opportunity, 2020 – 2021 (USD Billion)
      Fig.5	Global E-Glass Fiber Market Incremental Revenue Opportunity, 2020 – 2021 (USD Billion)
      Fig.6	Global E-Glass Fiber Market Share, by Type, 2019 & 2021 (USD Billion)
      Fig.7	Global E-Glass Fiber Market Share, by Type, 2019 & 2021 ()
      Fig.8	Global General-Purpose Glass Fiber E-Glass Fiber Market, 2020 – 2021 (USD Billion)
      Fig.9	Global General-Purpose Glass Fiber E-Glass Fiber Market, 2020 – 2021 ()
      Fig.10	Global Special-Purpose Glass Fiber E-Glass Fiber Market, 2020 – 2021 (USD Billion)
      Fig.11	Global Special-Purpose Glass Fiber E-Glass Fiber Market, 2020 – 2021 ()
      Fig.12	Global E-Glass Fiber Market Share, by Application, 2019 & 2021 (USD Billion)
      Fig.13	Global E-Glass Fiber Market Share, by Application, 2019 & 2021 ()
      Fig.14	Global Construction E-Glass Fiber Market, 2020 – 2021 (USD Billion)
      Fig.15	Global Construction E-Glass Fiber Market, 2020 – 2021 ()
      Fig.16	Global Transportation E-Glass Fiber Market, 2020 – 2021 (USD Billion)
      Fig.17	Global Transportation E-Glass Fiber Market, 2020 – 2021 ()
      Fig.18	Global Industrial E-Glass Fiber Market, 2020 – 2021 (USD Billion)
      Fig.19	Global Industrial E-Glass Fiber Market, 2020 – 2021 ()
      Fig.20	Global Consumer E-Glass Fiber Market, 2020 – 2021 (USD Billion)
      Fig.21	Global Consumer E-Glass Fiber Market, 2020 – 2021 ()
      Fig.22	Global Wind E-Glass Fiber Market, 2020 – 2021 (USD Billion)
      Fig.23	Global Wind E-Glass Fiber Market, 2020 – 2021 ()
      Fig.24	Global E-Glass Fiber Market Share, by Region, 2019 & 2021 (USD Billion)
      Fig.25	Global E-Glass Fiber Market Share, by Region, 2019 & 2021 ()
      Fig.26	North America E-Glass Fiber Market, 2020 – 2021 (USD Billion)
      Fig.27	North America E-Glass Fiber Market, 2020 – 2021 ()
      Fig.28	U.S. E-Glass Fiber Market, 2020 – 2021 (USD Billion)
      Fig.29	U.S. E-Glass Fiber  Market, 2020 – 2021 ()
      Fig.30	Canada E-Glass Fiber Market, 2020 – 2021 (USD Billion)
      Fig.31	Canada E-Glass Fiber  Market, 2020 – 2021 ()
      Fig.32	Europe E-Glass Fiber Market, 2020 – 2021 (USD Billion)
      Fig.33	Europe E-Glass Fiber Market, 2020 – 2021 ()
      Fig.34	Germany E-Glass Fiber Market, 2020 – 2021 (USD Billion)
      Fig.35	Germany E-Glass Fiber  Market, 2020 – 2021 ()
      Fig.36	France E-Glass Fiber Market, 2020 – 2021 (USD Billion)
      Fig.37	France E-Glass Fiber  Market, 2020 – 2021 ()
      Fig.38	U.K. E-Glass Fiber Market, 2020 – 2021 (USD Billion)
      Fig.39	U.K. E-Glass Fiber  Market, 2020 – 2021 ()
      Fig.40	Italy E-Glass Fiber Market, 2020 – 2021 (USD Billion)
      Fig.41	Italy E-Glass Fiber  Market, 2020 – 2021 ()
      Fig.42	Spain E-Glass Fiber Market, 2020 – 2021 (USD Billion)
      Fig.43	Spain E-Glass Fiber  Market, 2020 – 2021 ()
      Fig.44	Rest of Europe E-Glass Fiber Market, 2020 – 2021 (USD Billion)
      Fig.45	Rest of Europe E-Glass Fiber  Market, 2020 – 2021 ()
      Fig.46	Asia Pacific E-Glass Fiber Market, 2020 – 2021 (USD Billion)
      Fig.47	Asia Pacific E-Glass Fiber Market, 2020 – 2021 ()
      Fig.48	China E-Glass Fiber Market, 2020 – 2021 (USD Billion)
      Fig.49	China E-Glass Fiber  Market, 2020 – 2021 ()
      Fig.50	Japan E-Glass Fiber Market, 2020 – 2021 (USD Billion)
      Fig.51	Japan E-Glass Fiber  Market, 2020 – 2021 ()
      Fig.52	India E-Glass Fiber Market, 2020 – 2021 (USD Billion)
      Fig.53	India E-Glass Fiber  Market, 2020 – 2021 ()
      Fig.54	South  Korea E-Glass Fiber Market, 2020 – 2021 (USD Billion)
      Fig.55	South  Korea E-Glass Fiber  Market, 2020 – 2021 ()
      Fig.56	South-East Asia E-Glass Fiber Market, 2020 – 2021 (USD Billion)
      Fig.57	South-East Asia E-Glass Fiber  Market, 2020 – 2021 ()
      Fig.58	Rest of Asia Pacific E-Glass Fiber Market, 2020 – 2021 (USD Billion)
      Fig.59	Rest of Asia Pacific E-Glass Fiber  Market, 2020 – 2021 ()
      Fig.60	Latin America E-Glass Fiber Market, 2020 – 2021 (USD Billion)
      Fig.61	Latin America E-Glass Fiber Market, 2020 – 2021 ()
      Fig.62	Brazil E-Glass Fiber Market, 2020 – 2021 (USD Billion)
      Fig.63	Brazil E-Glass Fiber  Market, 2020 – 2021 ()
      Fig.64	Mexico E-Glass Fiber Market, 2020 – 2021 (USD Billion)
      Fig.65	Mexico E-Glass Fiber  Market, 2020 – 2021 ()
      Fig.66	Rest of Latin America E-Glass Fiber Market, 2020 – 2021 (USD Billion)
      Fig.67	Rest of Latin America E-Glass Fiber  Market, 2020 – 2021 ()
      Fig.68	The Middle-East and Africa E-Glass Fiber Market, 2020 – 2021 (USD Billion)
      Fig.69	The Middle-East and Africa E-Glass Fiber Market, 2020 – 2021 ()
      Fig.70	GCC Countries E-Glass Fiber Market, 2020 – 2021 (USD Billion)
      Fig.71	GCC Countries E-Glass Fiber  Market, 2020 – 2021 ()
      Fig.72	South Africa E-Glass Fiber Market, 2020 – 2021 (USD Billion)
      Fig.73	South Africa E-Glass Fiber  Market, 2020 – 2021 ()
      Fig.74	Rest of Middle-East Africa E-Glass Fiber Market, 2020 – 2021 (USD Billion)
      Fig.75	Rest of Middle-East Africa E-Glass Fiber  Market, 2020 – 2021 ()
      Fig.76	Global E-Glass Fiber Production and Consumption, 2020 – 2021 ()
      Fig.77	North America E-Glass Fiber Production and Consumption, 2020 – 2021 (USD Billion) ()
      Fig.78	Europe E-Glass Fiber Production and Consumption, 2020 – 2021 (USD Billion) ()
      Fig.79	Asia Pacific E-Glass Fiber Production and Consumption, 2020 – 2021 (USD Billion) ()
      Fig.80	Latin America E-Glass Fiber Production and Consumption, 2020 – 2021 (USD Billion) ()
      Fig.81	The Middle-East and Africa E-Glass Fiber Production and Consumption, 2020 – 2021 (USD Billion) ()
      Fig.82	Competitor Market Share – Revenue
      Fig.83	Competitor Market Share – Volume
      Fig.84	Taishan Fiberglass Revenue and Growth Rate
      Fig.85	Taishan Fiberglass Market Share
      Fig.86	Changzhou Tianma Group Revenue and Growth Rate
      Fig.87	Changzhou Tianma Group Market Share
      Fig.88	Jushi Group Revenue and Growth Rate
      Fig.89	Jushi Group Market Share
      Fig.90	Owens Corning Corporation Revenue and Growth Rate
      Fig.91	Owens Corning Corporation Market Share
      Fig.92	Nippon Electric Glass Revenue and Growth Rate
      Fig.93	Nippon Electric Glass Market Share
      Fig.94	Vetrotex Revenue and Growth Rate
      Fig.95	Vetrotex Market Share
      Fig.96	Lanxess Revenue and Growth Rate
      Fig.97	Lanxess Market Share
      Fig.98	Johns Manville Revenue and Growth Rate
      Fig.99	Johns Manville Market Share
      Fig.100	Sichuan Weibo New Material Group Revenue and Growth Rate
      Fig.101	Sichuan Weibo New Material Group Market Share
      Fig.102	Ahlstrom Revenue and Growth Rate
      Fig.103	Ahlstrom Market Share
      Fig.104	PPG Industries Revenue and Growth Rate
      Fig.105	PPG Industries Market Share
      Fig.106	Market Dynamics
      Fig.107	Global E-Glass Fiber – Value Chain Analysis
      Fig.108	Key Mandates and Regulations
      Fig.109	Technology Roadmap and Timeline
      Fig.110	Market Attractiveness Analysis – By Type
      Fig.111	Market Attractiveness Analysis – By Application
      Fig.112	Market Attractiveness Analysis – By Region
      Fig.113	Manufacturing Cost Structure of E-Glass Fiber
      Fig.114	E-Glass Fiber Industrial Chain Analysis
      Fig.115	Market Channels
      Fig.116	Marketing Channel Development Trend
      Fig.117	Growth in World Gross Product, 2008-2018
      

      List of Tables

      Table 1	Global E-Glass Fiber Market, 2019 & 2021 (USD Billion)
      Table 2	Global E-Glass Fiber Market, by Type, 2020 – 2021 (USD Billion)
      Table 3	Global E-Glass Fiber Market, by Type, 2020 – 2021 ()
      Table 4	Global E-Glass Fiber Market, by Application, 2020 – 2021 (USD Billion)
      Table 5	Global E-Glass Fiber Market, by Application, 2020 – 2021 ()
      Table 6	Global E-Glass Fiber Market, by Region, 2020 – 2021 (USD Billion)
      Table 7	Global E-Glass Fiber Market, by Region, 2020 – 2021 ()
      Table 8	North America E-Glass Fiber Market, by Country, 2020 – 2021 (USD Billion)
      Table 9	North America E-Glass Fiber Market, by Country, 2020 – 2021 ()
      Table 10 North America E-Glass Fiber Market, by Type, 2020 – 2021 (USD Billion)
      Table 11 North America E-Glass Fiber Market, by Type, 2020 – 2021 ()
      Table 12 North America E-Glass Fiber Market, by Application, 2020 – 2021 (USD Billion)
      Table 13 North America E-Glass Fiber Market, by Application, 2020 – 2021 ()
      Table 14 Europe E-Glass Fiber Market, by Country, 2020 – 2021 (USD Billion)
      Table 15 Europe E-Glass Fiber Market, by Country, 2020 – 2021 ()
      Table 16 Europe E-Glass Fiber Market, by Type, 2020 – 2021 (USD Billion)
      Table 17 Europe E-Glass Fiber Market, by Type, 2020 – 2021 ()
      Table 18 Europe E-Glass Fiber Market, by Application, 2020 – 2021 (USD Billion)
      Table 19 Europe E-Glass Fiber Market, by Application, 2020 – 2021 ()
      Table 20 Asia Pacific E-Glass Fiber Market, by Country, 2020 – 2021 (USD Billion)
      Table 21 Asia Pacific E-Glass Fiber Market, by Country, 2020 – 2021 ()
      Table 22 Asia Pacific E-Glass Fiber Market, by Type, 2020 – 2021 (USD Billion)
      Table 23 Asia Pacific E-Glass Fiber Market, by Type, 2020 – 2021 ()
      Table 24 Asia Pacific E-Glass Fiber Market, by Application, 2020 – 2021 (USD Billion)
      Table 25 Asia Pacific E-Glass Fiber Market, by Application, 2020 – 2021 ()
      Table 26 Latin America E-Glass Fiber Market, by Country, 2020 – 2021 (USD Billion)
      Table 27 Latin America E-Glass Fiber Market, by Country, 2020 – 2021 ()
      Table 28 Latin America E-Glass Fiber Market, by Type, 2020 – 2021 (USD Billion)
      Table 29 Latin America E-Glass Fiber Market, by Type, 2020 – 2021 ()
      Table 30 Latin America E-Glass Fiber Market, by Application, 2020 – 2021 (USD Billion)
      Table 31 Latin America E-Glass Fiber Market, by Application, 2020 – 2021 ()
      Table 32 The Middle-East and Africa E-Glass Fiber Market, by Country, 2020 – 2021 (USD Billion)
      Table 33 The Middle-East and Africa E-Glass Fiber Market, by Country, 2020 – 2021 ()
      Table 34 The Middle-East and Africa E-Glass Fiber Market, by Type, 2020 – 2021 (USD Billion)
      Table 35 The Middle-East and Africa E-Glass Fiber Market, by Type, 2020 – 2021 ()
      Table 36 The Middle-East and Africa E-Glass Fiber Market, by Application, 2020 – 2021 (USD Billion)
      Table 37 The Middle-East and Africa E-Glass Fiber Market, by Application, 2020 – 2021 ()
      Table 38 North America E-Glass Fiber Production, Consumption, Export, Import, 2020 – 2019
      Table 39 Europe E-Glass Fiber Production, Consumption, Export, Import, 2020 – 2019
      Table 40 Asia Pacific E-Glass Fiber Production, Consumption, Export, Import, 2020 – 2019
      Table 41 Latin America E-Glass Fiber Production, Consumption, Export, Import, 2020 – 2019
      Table 42 The Middle-East and Africa E-Glass Fiber Production, Consumption, Export, Import, 2020 – 2019
      Table 43 Global E-Glass Fiber Market - Company Revenue Analysis, 2016 – 2019 (USD Billion)
      Table 44 Global E-Glass Fiber Market - Company Revenue Share Analysis, 2016 – 2019 (%)
      Table 45 Global E-Glass Fiber Market - Company Volume Analysis, 2020 – 2019 ()
      Table 46 Global E-Glass Fiber Market - Company Volume Share Analysis, 2020 – 2019 (%)
      Table 47 Acquisitions and Mergers
      Table 48 Market Drivers – Impact Analysis
      Table 49 Market Restraints
      Table 50 Market Opportunities
      Table 51 Production Base and Market Concentration Rate of Raw Material
      Table 52 Key Suppliers of Raw Materials
      Table 53 Raw Materials Sources of E-Glass Fiber Major Manufacturers
      Table 54 Major Buyers of E-Glass Fiber
      Table 55 Distributors/Traders of E-Glass Fiber by Region
      

Industry Major Market Players

  • Taishan Fiberglass
  • Changzhou Tianma Group
  • Jushi Group
  • Owens Corning Corporation
  • Nippon Electric Glass