Search Market Research Report

Discover Our Latest Reports
Discover Our Featured Reports
Discover Top Selling Reports

Docking Station Market Size, Share Global Analysis Report, 2021 – 2026

report img

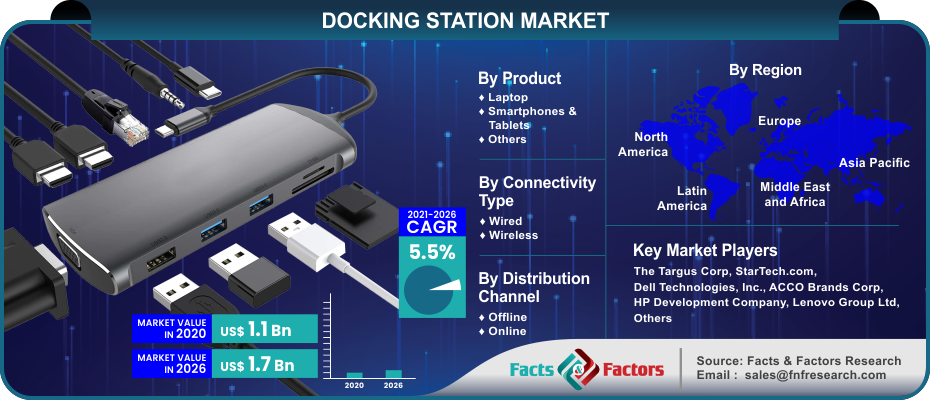
Docking Station Market By Product (Laptop, Smartphones & Tablets, & Others), By Connectivity Type (Wired & Wireless), By Distribution Channel (Offline & Online), And By Regions - Global & Regional Industry Perspective, Comprehensive Analysis, and Forecast 2021 – 2026

Industry Insights

[205+ Pages Report] The latest finding surrounding the “Global Docking Station Market” published by Facts & Factors offers a neatly packaged and comprehensive read. In this report, the global docking station market will reach a projected value of USD 1.7 Billion in the year 2026 with a growth rate of 5.5% CAGR from an initial value of USD 1.1 Billion in the year 2020.

logoMarket Overview

Docking stations are a form of charging station where portable devices such as computers, iPads, and mobile devices can be recharged. These stations are often installed at outdoor places where huge migration of people takes place. Docking stations are further designed for models of various products due to the limited number of connectors for a wider range of available devices. They also feature multiple slots for storage devices and peripheral devices such as printers and monitors.

logoIndustry Growth Factors

The primary driving factors for the global docking station market include the increased importance of mobile devices due to the rising number of applications such as communication, data collection, inventory management, vehicle tracking, and merchandising coupled with the rising popularity of bring-your-own-device (BYOD) to name a few. Additionally, rising demands for cutting work-related expenses and increasing flexibility and efficiency measures will boost the growth of the global docking station market during the advent of the forecast period. Moreover, the rising need for rapid data transfer coupled with the development of technologies such as USB-C, USB 3.0, and thunderbolt charging will further increase the footprint of the global docking station market during the advent of the forecast period.

The global docking station market is driven by increasing digitalization solutions coupled with the integration of multi-channel charging stations to name a few. A rising quantity of office spaces in developed and developing areas coupled with rising convenience will fuel the growth of the global docking station market during the advent of the forecast period. However, the non-portability of these devices coupled with irregular charging costs will hamper the growth of the global docking station market during the advent of the forecast period to some extent.

Docking Station Market

To know more about this report | Request Free Sample Copy

logoSegmentation Analysis

The global docking station market is segmented into product, connectivity type, distribution channel, and regions.

On the basis of product, the global docking station market is categorized into laptops, smartphones & tablets, and others. The segment pertaining to laptops is expected to witness the largest market share during the advent of the forecast period owing to the integration of universal port replicators for charging monitors, speakers, keyboards, and external USB hard drives coupled with rising computability toward Mac, PC, chrome-based OS, android, and Linux to name a few. On the basis of connectivity type, the global docking station market is divided into wired and wireless. The wired segment is expected to witness the largest market share during the advent of the forecast period owing to better charging capability due to direct connectivity measures such as HMDI cables and DisplayPort coupled with reduced channel congestion and internet efficiency to name a few. On the basis of distribution channels, the global docking station market is fragmented into offline and online. The segment pertaining to offline distribution is expected to witness the largest market share during the advent of the forecast period owing to a hands-on product experience before buying and after-sales services to name a few.

logo Report Scope

Report Attribute

Details

Market Size in 2020

USD 1.1 Billion

Projected Market Size in 2026

USD 1.7 Billion

CAGR Growth Rate

5.5% CAGR

Base Year

2020

Forecast Years

2021-2026

Key Market Players

The Targus Corp, StarTech.com, Dell Technologies, Inc., ACCO Brands Corp, HP Development Company, Lenovo Group Ltd., Plugable Technologies, Toshiba Corp, and Apple, Inc., among others.

Key Segment

Product, Connectivity Type, Distribution Channel, and Region

Major Regions Covered

North America, Europe, Asia Pacific, Latin America, and Middle East & Africa

Purchase Options

Request customized purchase options to meet your research needs. Explore purchase options

logo Regional Analysis

North America is expected to witness the largest market share during the advent of the forecast period owing to rising usage of docking stations owing to a rapidly expanding IT sector coupled with the increasing popularity of BYOD to name a few. Additionally, rising infrastructure spending coupled with favorable policies for an expanding nature will increase the footprint of the docking station market during the advent of the forecast period. Asia-Pacific is expected to witness the fastest growing CAGR growth during the forecast duration owing to the rising penetration of IT firms in emerging economies such as China, India, and Japan coupled with rising product demand to name a few. Moreover, increased usage of smartphones and rising purchasing power among users will boost the growth of the docking station market during the forecast period.

logo Competitive Players

The key market participants for the global docking station market are :

  • The Targus Corp
  • StarTech.com
  • Dell Technologies Inc.
  • ACCO Brands Corp
  • HP Development Company
  • Lenovo Group Ltd.
  • Plugable Technologies
  • Toshiba Corp
  • Apple Inc.

logo By Product Segment Analysis

  • Laptop
  • Smartphones & Tablets
  • Others

logo By Connectivity Type Segment Analysis

  • Wired
  • Wireless

logo By Distribution Channel Segment Analysis

  • Offline
  • Online

logo By Regional Segment Analysis

  • North America
    • U.S.
    • Canada
  • Europe
    • UK
    • France
    • Germany
    • Italy
    • Spain
    • Rest of Europe
  • Asia Pacific
    • China
    • Japan
    • India
    • South Korea
    • Southeast Asia
    • Rest of Asia Pacific
  • Latin America
    • Brazil
    • Mexico
    • Rest of Latin America
  • Middle East and Africa
    • GCC Countries
    • South Africa
    • Rest of MEA

Table of Content

  1. Chapter 1 Executive Summary
    1. 1.1. Introduction of Docking Station
    2. 1.2. Global Docking Station Market, 2019 & 2026 (USD Billion)
    3. 1.3. Global Docking Station Market, 2016 – 2026 (USD Billion)
    4. 1.4. Global Docking Station Market Absolute Revenue Opportunity, 2016 – 2026 (USD Billion)
    5. 1.5. Global Docking Station Market Incremental Revenue Opportunity, 2020 – 2026 (USD Billion)
  2. Chapter 2 Docking Station Market – Product Analysis
    1. 2.1. Global Docking Station Market – Product Overview
    2. 2.2. Global Docking Station Market Share, by Product, 2019 & 2026 (USD Billion)
    3. 2.3. Laptop
      1. 2.3.1. Global Laptop Docking Station Market, 2016 – 2026 (USD Billion)
    4. 2.4. Smartphones & Tablets
      1. 2.4.1. Global Smartphones & Tablets Docking Station Market, 2016 – 2026 (USD Billion)
    5. 2.5. Others
      1. 2.5.1. Global Others Docking Station Market, 2016 – 2026 (USD Billion)
  3. Chapter 3 Docking Station Market – Connectivity Type Analysis
    1. 3.1. Global Docking Station Market – Connectivity Type Overview
    2. 3.2. Global Docking Station Market Share, by Connectivity Type, 2019 & 2026 (USD Billion)
    3. 3.3. Wired
      1. 3.3.1. Global Wired Docking Station Market, 2016 – 2026 (USD Billion)
    4. 3.4. Wireless
      1. 3.4.1. Global Wireless Docking Station Market, 2016 – 2026 (USD Billion)
  4. Chapter 4 Docking Station Market – Distribution Channel Analysis
    1. 4.1. Global Docking Station Market – Distribution Channel Overview
    2. 4.2. Global Docking Station Market Share, by Distribution Channel, 2019 & 2026 (USD Billion)
    3. 4.3. Offline
      1. 4.3.1. Global Offline Docking Station Market, 2016 – 2026 (USD Billion)
    4. 4.4. Online
      1. 4.4.1. Global Online Docking Station Market, 2016 – 2026 (USD Billion)
  5. Chapter 5 Docking Station Market – Regional Analysis
    1. 5.1. Global Docking Station Market Regional Overview
    2. 5.2. Global Docking Station Market Share, by Region, 2019 & 2026 (USD Billion)
    3. 5.3. North America
      1. 5.3.1. North America Docking Station Market, 2016 – 2026 (USD Billion)
        1. 5.3.1.1. North America Docking Station Market, by Country, 2016 - 2026 (USD Billion)
      2. 5.3.2. North America Docking Station Market, by Product, 2016 – 2026
        1. 5.3.2.1. North America Docking Station Market, by Product, 2016 – 2026 (USD Billion)
      3. 5.3.3. North America Docking Station Market, by Connectivity Type, 2016 – 2026
        1. 5.3.3.1. North America Docking Station Market, by Connectivity Type, 2016 – 2026 (USD Billion)
      4. 5.3.4. North America Docking Station Market, by Distribution Channel, 2016 – 2026
        1. 5.3.4.1. North America Docking Station Market, by Distribution Channel, 2016 – 2026 (USD Billion)
      5. 5.3.5. U.S.
        1. 5.3.5.1. U.S. Docking Station Market, 2016 – 2026 (USD Billion)
      6. 5.3.6. Canada
        1. 5.3.6.1. Canada Docking Station Market, 2016 – 2026 (USD Billion)
    4. 5.4. Europe
      1. 5.4.1. Europe Docking Station Market, 2016 – 2026 (USD Billion)
        1. 5.4.1.1. Europe Docking Station Market, by Country, 2016 - 2026 (USD Billion)
      2. 5.4.2. Europe Docking Station Market, by Product, 2016 – 2026
        1. 5.4.2.1. Europe Docking Station Market, by Product, 2016 – 2026 (USD Billion)
      3. 5.4.3. Europe Docking Station Market, by Connectivity Type, 2016 – 2026
        1. 5.4.3.1. Europe Docking Station Market, by Connectivity Type, 2016 – 2026 (USD Billion)
      4. 5.4.4. Europe Docking Station Market, by Distribution Channel, 2016 – 2026
        1. 5.4.4.1. Europe Docking Station Market, by Distribution Channel, 2016 – 2026 (USD Billion)
      5. 5.4.5. Germany
        1. 5.4.5.1. Germany Docking Station Market, 2016 – 2026 (USD Billion)
      6. 5.4.6. France
        1. 5.4.6.1. France Docking Station Market, 2016 – 2026 (USD Billion)
      7. 5.4.7. U.K.
        1. 5.4.7.1. U.K. Docking Station Market, 2016 – 2026 (USD Billion)
      8. 5.4.8. Italy
        1. 5.4.8.1. Italy Docking Station Market, 2016 – 2026 (USD Billion)
      9. 5.4.9. Spain
        1. 5.4.9.1. Spain Docking Station Market, 2016 – 2026 (USD Billion)
      10. 5.4.10. Rest of Europe
        1. 5.4.10.1. Rest of Europe Docking Station Market, 2016 – 2026 (USD Billion)
    5. 5.5. Asia Pacific
      1. 5.5.1. Asia Pacific Docking Station Market, 2016 – 2026 (USD Billion)
        1. 5.5.1.1. Asia Pacific Docking Station Market, by Country, 2016 - 2026 (USD Billion)
      2. 5.5.2. Asia Pacific Docking Station Market, by Product, 2016 – 2026
        1. 5.5.2.1. Asia Pacific Docking Station Market, by Product, 2016 – 2026 (USD Billion)
      3. 5.5.3. Asia Pacific Docking Station Market, by Connectivity Type, 2016 – 2026
        1. 5.5.3.1. Asia Pacific Docking Station Market, by Connectivity Type, 2016 – 2026 (USD Billion)
      4. 5.5.4. Asia Pacific Docking Station Market, by Distribution Channel, 2016 – 2026
        1. 5.5.4.1. Asia Pacific Docking Station Market, by Distribution Channel, 2016 – 2026 (USD Billion)
      5. 5.5.5. China
        1. 5.5.5.1. China Docking Station Market, 2016 – 2026 (USD Billion)
      6. 5.5.6. Japan
        1. 5.5.6.1. Japan Docking Station Market, 2016 – 2026 (USD Billion)
      7. 5.5.7. India
        1. 5.5.7.1. India Docking Station Market, 2016 – 2026 (USD Billion)
      8. 5.5.8. South Korea
        1. 5.5.8.1. South Korea Docking Station Market, 2016 – 2026 (USD Billion)
      9. 5.5.9. South-East Asia
        1. 5.5.9.1. South-East Asia Docking Station Market, 2016 – 2026 (USD Billion)
      10. 5.5.10. Rest of Asia Pacific
        1. 5.5.10.1. Rest of Asia Pacific Docking Station Market, 2016 – 2026 (USD Billion)
    6. 5.6. Latin America
      1. 5.6.1. Latin America Docking Station Market, 2016 – 2026 (USD Billion)
        1. 5.6.1.1. Latin America Docking Station Market, by Country, 2016 - 2026 (USD Billion)
      2. 5.6.2. Latin America Docking Station Market, by Product, 2016 – 2026
        1. 5.6.2.1. Latin America Docking Station Market, by Product, 2016 – 2026 (USD Billion)
      3. 5.6.3. Latin America Docking Station Market, by Connectivity Type, 2016 – 2026
        1. 5.6.3.1. Latin America Docking Station Market, by Connectivity Type, 2016 – 2026 (USD Billion)
      4. 5.6.4. Latin America Docking Station Market, by Distribution Channel, 2016 – 2026
        1. 5.6.4.1. Latin America Docking Station Market, by Distribution Channel, 2016 – 2026 (USD Billion)
      5. 5.6.5. Brazil
        1. 5.6.5.1. Brazil Docking Station Market, 2016 – 2026 (USD Billion)
      6. 5.6.6. Mexico
        1. 5.6.6.1. Mexico Docking Station Market, 2016 – 2026 (USD Billion)
      7. 5.6.7. Rest of Latin America
        1. 5.6.7.1. Rest of Latin America Docking Station Market, 2016 – 2026 (USD Billion)
    7. 5.7. The Middle-East and Africa
      1. 5.7.1. The Middle-East and Africa Docking Station Market, 2016 – 2026 (USD Billion)
        1. 5.7.1.1. The Middle-East and Africa Docking Station Market, by Country, 2016 - 2026 (USD Billion)
      2. 5.7.2. The Middle-East and Africa Docking Station Market, by Product, 2016 – 2026
        1. 5.7.2.1. The Middle-East and Africa Docking Station Market, by Product, 2016 – 2026 (USD Billion)
      3. 5.7.3. The Middle-East and Africa Docking Station Market, by Connectivity Type, 2016 – 2026
        1. 5.7.3.1. The Middle-East and Africa Docking Station Market, by Connectivity Type, 2016 – 2026 (USD Billion)
      4. 5.7.4. The Middle-East and Africa Docking Station Market, by Distribution Channel, 2016 – 2026
        1. 5.7.4.1. The Middle-East and Africa Docking Station Market, by Distribution Channel, 2016 – 2026 (USD Billion)
      5. 5.7.5. GCC Countries
        1. 5.7.5.1. GCC Countries Docking Station Market, 2016 – 2026 (USD Billion)
      6. 5.7.6. South Africa
        1. 5.7.6.1. South Africa Docking Station Market, 2016 – 2026 (USD Billion)
      7. 5.7.7. Rest of Middle-East Africa
        1. 5.7.7.1. Rest of Middle-East Africa Docking Station Market, 2016 – 2026 (USD Billion)
  6. Chapter 6 Docking Station Market – Competitive Landscape
    1. 6.1. Competitor Market Share – Revenue
    2. 6.2. Market Concentration Rate Analysis, Top 3 and Top 5 Players
    3. 6.3. Strategic Developments
      1. 6.3.1. Acquisitions and Mergers
      2. 6.3.2. New Products
      3. 6.3.3. Research & Development Activities
  7. Chapter 7 Company Profiles
    1. 7.1. The Targus Corp
      1. 7.1.1. Company Overview
      2. 7.1.2. Product/Service Portfolio
      3. 7.1.3. The Targus Corp Sales, Revenue, and Gross Margin
      4. 7.1.4. The Targus Corp Revenue and Growth Rate
      5. 7.1.5. The Targus Corp Market Share
      6. 7.1.6. Recent Initiatives, Funding/VC Activities, and Technological Innovations
      7. 7.2. StarTech.com
      8. 7.2.1. Company Overview
      9. 7.2.2. Product/Service Portfolio
        1. 7.2.3. StarTech.com Sales, Revenue, and Gross Margin
        2. 7.2.4. StarTech.com Revenue and Growth Rate
        3. 7.2.5. StarTech.com Market Share
      10. 7.2.6. Recent Initiatives, Funding/VC Activities, and Technological Innovations
    2. 7.3. Dell Technologies Inc
      1. 7.3.1. Company Overview
      2. 7.3.2. Product/Service Portfolio
      3. 7.3.3. Dell Technologies Inc Sales, Revenue, and Gross Margin
      4. 7.3.4. Dell Technologies Inc Revenue and Growth Rate
      5. 7.3.5. Dell Technologies Inc Market Share
      6. 7.3.6. Recent Initiatives, Funding/VC Activities, and Technological Innovations
    3. 7.4. ACCO Brands Corp
      1. 7.4.1. Company Overview
      2. 7.4.2. Product/Service Portfolio
      3. 7.4.3. ACCO Brands Corp Sales, Revenue, and Gross Margin
      4. 7.4.4. ACCO Brands Corp Revenue and Growth Rate
      5. 7.4.5. ACCO Brands Corp Market Share
      6. 7.4.6. Recent Initiatives, Funding/VC Activities, and Technological Innovations
    4. 7.5. HP Development Company
      1. 7.5.1. Company Overview
      2. 7.5.2. Product/Service Portfolio
      3. 7.5.3. HP Development Company Sales, Revenue, and Gross Margin
      4. 7.5.4. HP Development Company Revenue and Growth Rate
      5. 7.5.5. HP Development Company Market Share
      6. 7.5.6. Recent Initiatives, Funding/VC Activities, and Technological Innovations
    5. 7.6. Lenovo Group Ltd
      1. 7.6.1. Company Overview
      2. 7.6.2. Product/Service Portfolio
      3. 7.6.3. Lenovo Group Ltd Sales, Revenue, and Gross Margin
      4. 7.6.4. Lenovo Group Ltd Revenue and Growth Rate
      5. 7.6.5. Lenovo Group Ltd Market Share
      6. 7.6.6. Recent Initiatives, Funding/VC Activities, and Technological Innovations
    6. 7.7. Plugable Technologies
      1. 7.7.1. Company Overview
      2. 7.7.2. Product/Service Portfolio
      3. 7.7.3. Plugable Technologies Sales, Revenue, and Gross Margin
      4. 7.7.4. Plugable Technologies Revenue and Growth Rate
      5. 7.7.5. Plugable Technologies Market Share
      6. 7.7.6. Recent Initiatives, Funding/VC Activities, and Technological Innovations
    7. 7.8. Toshiba Corp
      1. 7.8.1. Company Overview
      2. 7.8.2. Product/Service Portfolio
      3. 7.8.3. Toshiba Corp Sales, Revenue, and Gross Margin
      4. 7.8.4. Toshiba Corp Revenue and Growth Rate
      5. 7.8.5. Toshiba Corp Market Share
      6. 7.8.6. Recent Initiatives, Funding/VC Activities, and Technological Innovations
    8. 7.9. Apple Inc
      1. 7.9.1. Company Overview
      2. 7.9.2. Product/Service Portfolio
      3. 7.9.3. Apple Inc Sales, Revenue, and Gross Margin
      4. 7.9.4. Apple Inc Revenue and Growth Rate
      5. 7.9.5. Apple Inc Market Share
      6. 7.9.6. Recent Initiatives, Funding/VC Activities, and Technological Innovations
  8. Chapter 8 Docking Station — Industry Analysis
    1. 8.1. Introduction and Taxonomy
    2. 8.2. Docking Station Market – Key Trends
      1. 8.2.1. Market Drivers
      2. 8.2.2. Market Restraints
      3. 8.2.3. Market Opportunities
    3. 8.3. Value Chain Analysis
    4. 8.4. Key Mandates and Regulations
    5. 8.5. Technology Roadmap and Timeline
    6. 8.6. Docking Station Market – Attractiveness Analysis
      1. 8.6.1. By Product
      2. 8.6.2. By Connectivity Type
      3. 8.6.3. By Distribution Channel
      4. 8.6.4. By Region
  9. Chapter 9 Industrial Chain, Sourcing Strategy, and Downstream Buyers
    1. 9.1. Docking Station Industrial Chain Analysis
    2. 9.2. Downstream Buyers
    3. 9.3. Distributors/Traders List
  10. Chapter 10 Marketing Strategy Analysis
    1. 10.1. Marketing Channel
    2. 10.2. Direct Marketing
    3. 10.3. Indirect Marketing
    4. 10.4. Marketing Channel Development Trends
    5. 10.5. Economic/Political Environmental Change
  11. Chapter 11 Report Conclusion & Key Insights
    1. 11.1. Key Insights from Primary Interviews & Surveys Respondents
    2. 11.2. Key Takeaways from Analysts, Consultants, and Industry Leaders
  12. Chapter 12 Research Approach & Methodology
    1. 12.1. Report Description
    2. 12.2. Research Scope
    3. 12.3. Research Methodology
      1. 12.3.1. Secondary Research
      2. 12.3.2. Primary Research
      3. 12.3.3. Statistical Models
        1. 12.3.3.1. Company Share Analysis Model
        2. 12.3.3.2. Revenue Based Modeling
      4. 12.3.4. Research Limitations

      List of Figures

      Fig.1	Product Picture of Docking Station
      Fig.2	Global Docking Station Market, 2016 – 2026 (USD Billion)
      Fig.3	Global Docking Station Market Absolute Revenue Opportunity, 2016 – 2026 (USD Billion)
      Fig.4	Global Docking Station Market Incremental Revenue Opportunity, 2020 – 2026 (USD Billion)
      Fig.5	Global Docking Station Market Share, by Product, 2019 & 2026 (USD Billion)
      Fig.6	Global Laptop  Docking Station Market, 2016 – 2026 (USD Billion)
      Fig.7	Global Smartphones & Tablets  Docking Station Market, 2016 – 2026 (USD Billion)
      Fig.8	Global Others Docking Station Market, 2016 – 2026 (USD Billion)
      Fig.9	Global Docking Station Market Share, by Connectivity Type, 2019 & 2026 (USD Billion)
      Fig.10	Global Wired Docking Station Market, 2016 – 2026 (USD Billion)
      Fig.11	Global Wireless Docking Station Market, 2016 – 2026 (USD Billion)
      Fig.12	Global Docking Station Market Share, by Distribution Channel, 2019 & 2026 (USD Billion)
      Fig.13	Global Offline  Docking Station Market, 2016 – 2026 (USD Billion)
      Fig.14	Global Online Docking Station Market, 2016 – 2026 (USD Billion)
      Fig.15	Global Docking Station Market Share, by Region, 2019 & 2026 (USD Billion)
      Fig.16	North America Docking Station Market, 2016 – 2026 (USD Billion)
      Fig.17	U.S. Docking Station Market, 2016 – 2026 (USD Billion)
      Fig.18	Canada Docking Station Market, 2016 – 2026 (USD Billion)
      Fig.19	Europe Docking Station Market, 2016 – 2026 (USD Billion)
      Fig.20	Germany Docking Station Market, 2016 – 2026 (USD Billion)
      Fig.21	France Docking Station Market, 2016 – 2026 (USD Billion)
      Fig.22	U.K. Docking Station Market, 2016 – 2026 (USD Billion)
      Fig.23	Italy Docking Station Market, 2016 – 2026 (USD Billion)
      Fig.24	Spain Docking Station Market, 2016 – 2026 (USD Billion)
      Fig.25	Rest of Europe Docking Station Market, 2016 – 2026 (USD Billion)
      Fig.26	Asia Pacific Docking Station Market, 2016 – 2026 (USD Billion)
      Fig.27	China Docking Station Market, 2016 – 2026 (USD Billion)
      Fig.28	Japan Docking Station Market, 2016 – 2026 (USD Billion)
      Fig.29	India Docking Station Market, 2016 – 2026 (USD Billion)
      Fig.30	South  Korea Docking Station Market, 2016 – 2026 (USD Billion)
      Fig.31	South-East Asia Docking Station Market, 2016 – 2026 (USD Billion)
      Fig.32	Rest of Asia Pacific Docking Station Market, 2016 – 2026 (USD Billion)
      Fig.33	Latin America Docking Station Market, 2016 – 2026 (USD Billion)
      Fig.34	Brazil Docking Station Market, 2016 – 2026 (USD Billion)
      Fig.35	Mexico Docking Station Market, 2016 – 2026 (USD Billion)
      Fig.36	Rest of Latin America Docking Station Market, 2016 – 2026 (USD Billion)
      Fig.37	The Middle-East and Africa Docking Station Market, 2016 – 2026 (USD Billion)
      Fig.38	GCC Countries Docking Station Market, 2016 – 2026 (USD Billion)
      Fig.39	South Africa Docking Station Market, 2016 – 2026 (USD Billion)
      Fig.40	Rest of Middle-East Africa Docking Station Market, 2016 – 2026 (USD Billion)
      Fig.41	Competitor Market Share – Revenue
      Fig.42	The Targus Corp Revenue and Growth Rate
      Fig.43	The Targus Corp Market Share
      Fig.44	StarTech.com Revenue and Growth Rate
      Fig.45	StarTech.com Market Share
      Fig.46	Dell Technologies Inc Revenue and Growth Rate
      Fig.47	Dell Technologies Inc Market Share
      Fig.48	ACCO Brands Corp Revenue and Growth Rate
      Fig.49	ACCO Brands Corp Market Share
      Fig.50	HP Development Company Revenue and Growth Rate
      Fig.51	HP Development Company Market Share
      Fig.52	Lenovo Group Ltd Revenue and Growth Rate
      Fig.53	Lenovo Group Ltd Market Share
      Fig.54	Plugable Technologies Revenue and Growth Rate
      Fig.55	Plugable Technologies Market Share
      Fig.56	Toshiba Corp Revenue and Growth Rate
      Fig.57	Toshiba Corp Market Share
      Fig.58	Apple Inc Revenue and Growth Rate
      Fig.59	Apple Inc Market Share
      Fig.60	Market Dynamics
      Fig.61	Global Docking Station – Value Chain Analysis
      Fig.62	Key Mandates and Regulations
      Fig.63	Technology Roadmap and Timeline
      Fig.64	Market Attractiveness Analysis – By Product
      Fig.65	Market Attractiveness Analysis – By Connectivity Type
      Fig.66	Market Attractiveness Analysis – By Distribution Channel
      Fig.67	Market Attractiveness Analysis – By Region
      Fig.68	Docking Station Industrial Chain Analysis
      Fig.69	Market Channels
      Fig.70	Marketing Channel Development Trend
      Fig.71	Growth in World Gross Product, 2008-2018
      

      List of Tables

      Table 1	Global Docking Station Market, 2019 & 2026 (USD Billion)
      Table 2	Global Docking Station Market, by Product, 2016 – 2026 (USD Billion)
      Table 3	Global Docking Station Market, by Connectivity Type, 2016 – 2026 (USD Billion)
      Table 4	Global Docking Station Market, by Distribution Channel, 2016 – 2026 (USD Billion)
      Table 5	Global Docking Station Market, by Region, 2016 – 2026 (USD Billion)
      Table 6	North America Docking Station Market, by Country, 2016 – 2026 (USD Billion)
      Table 7	North America Docking Station Market, by Product, 2016 – 2026 (USD Billion)
      Table 8	North America Docking Station Market, by Connectivity Type, 2016 – 2026 (USD Billion)
      Table 9	North America Docking Station Market, by Distribution Channel, 2016 – 2026 (USD Billion)
      Table 10 Europe Docking Station Market, by Country, 2016 – 2026 (USD Billion)
      Table 11 Europe Docking Station Market, by Product, 2016 – 2026 (USD Billion)
      Table 12 Europe Docking Station Market, by Connectivity Type, 2016 – 2026 (USD Billion)
      Table 13 Europe Docking Station Market, by Distribution Channel, 2016 – 2026 (USD Billion)
      Table 14 Asia Pacific Docking Station Market, by Country, 2016 – 2026 (USD Billion)
      Table 15 Asia Pacific Docking Station Market, by Product, 2016 – 2026 (USD Billion)
      Table 16 Asia Pacific Docking Station Market, by Connectivity Type, 2016 – 2026 (USD Billion)
      Table 17 Asia Pacific Docking Station Market, by Distribution Channel, 2016 – 2026 (USD Billion)
      Table 18 Latin America Docking Station Market, by Country, 2016 – 2026 (USD Billion)
      Table 19 Latin America Docking Station Market, by Product, 2016 – 2026 (USD Billion)
      Table 20 Latin America Docking Station Market, by Connectivity Type, 2016 – 2026 (USD Billion)
      Table 21 Latin America Docking Station Market, by Distribution Channel, 2016 – 2026 (USD Billion)
      Table 22 The Middle-East and Africa Docking Station Market, by Country, 2016 – 2026 (USD Billion)
      Table 23 The Middle-East and Africa Docking Station Market, by Product, 2016 – 2026 (USD Billion)
      Table 24 The Middle-East and Africa Docking Station Market, by Connectivity Type, 2016 – 2026 (USD Billion)
      Table 25 The Middle-East and Africa Docking Station Market, by Distribution Channel, 2016 – 2026 (USD Billion)
      Table 26 Global Docking Station Market - Company Revenue Analysis, 2016 – 2019 (USD Billion)
      Table 27 Global Docking Station Market - Company Revenue Share Analysis, 2016 – 2019 (%)
      Table 28 Acquisitions and Mergers
      Table 29 Market Drivers – Impact Analysis
      Table 30 Market Restraints
      Table 31 Market Opportunities
      Table 32 Major Buyers of Docking Station
      Table 33 Distributors/Traders of Docking Station by Region	
      

Industry Major Market Players

  • The Targus Corp
  • StarTech.com
  • Dell Technologies Inc.
  • ACCO Brands Corp
  • HP Development Company
  • Lenovo Group Ltd.
  • Plugable Technologies
  • Toshiba Corp
  • Apple Inc.