Search Market Research Report

Discover Our Latest Reports
Discover Our Featured Reports
Discover Top Selling Reports

DNA Forensics Market Size, Share Global Analysis Report, 2021 – 2027

report img

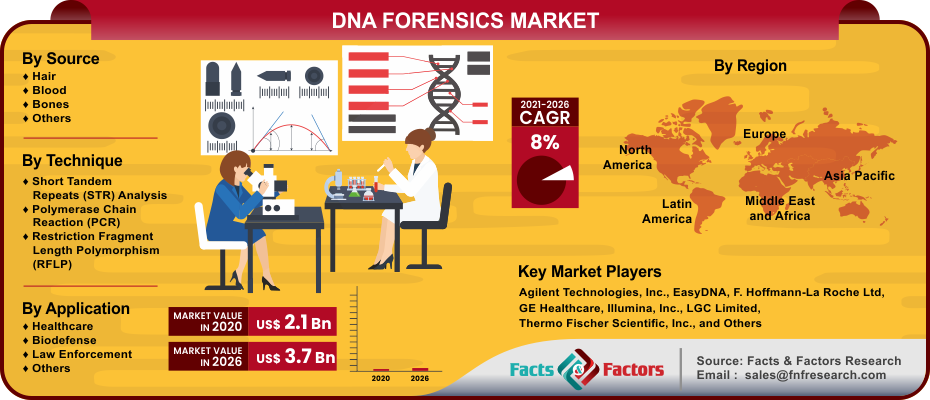
DNA Forensics Market By Source (Hair, Blood, Bones, and Others), By Technique (Short Tandem Repeats (STR) Analysis, Polymerase Chain Reaction (PCR), and Restriction Fragment Length Polymorphism (RFLP)), By Application (Healthcare, Biodefense, Law Enforcement, and Others), And Regions - Global & Regional Industry Perspective, Comprehensive Analysis, and Forecast 2021 – 2027

Industry Insights

[197+ Pages Report] Facts & Factors published a report on the global DNA Forensics Market that encompasses a complete market synopsis. The DNA Forensics market is expected to grow at a CAGR value of 8% from an initial value of USD 2.1 Billion in 2020 to USD 3.7 billion by 2027.

logoMarket Overview

The application of technology and genetics-related DNA knowledge in legal settings is referred to as DNA Forensics. There are huge DNA databases created in order to track, identify, and prosecute criminals. In DNA forensics, the genetic materials are scrutinized in criminal cases, human identification, and healthcare research. This study helps differentiate individuals on the basis of their genomes. The DNA samples are generally obtained from sources such as blood, saliva, semen, etc. Growing criminal cases and demand for human protection against violence are driving the DNA forensics market.

logoIndustry Growth Factors

Growing security concerns at the ports and national or international borders. Furthermore, the rising terrorist attacks across the globe are another factor bolstering the DNA forensics market during the forecast period.

The rising number of sexual crimes, kidnapping, homicides, and others also encourage the demand for the implementation of DNA forensics. Most importantly, growing government funding for the development of forensic testing kits and advancements in technologies in the field of DNA forensics is projected to help expand the global DNA forensics market over the forecast period. However, the high cost of DNA testing kits and demand for skilled professionals is likely to limit its usage in emerging regions.

DNA Forensics Market

To know more about this report | Request Free Sample Copy

logoSegmentation Analysis

The global DNA forensics market is segmented based on the source, technique, application, and regions.

Based on the source, the global DNA Forensics market is divided into hair, blood, bones, and others. By technique, the market is classified into short tandem repeats (STR) analysis, polymerase chain reaction (PCR), restriction fragment length polymorphism (RFLP). On the basis of application, the DNA forensics market is classified into healthcare, biodefense, law enforcement, and others. From the application segment, the law enforcement category is projected to hold the largest market share due to the growing demand for DNA analysis to identify and punish the perpetrators violating the norms of society.

logo Report Scope

Report Attribute

Details

Market Size in 2020

USD 2.1 Billion

Projected Market Size in 2027

USD 3.7 billion

CAGR Growth Rate

8% CAGR

Base Year

2020

Forecast Years

2021-2027

Key Market Players

Agilent Technologies, Inc., EasyDNA, F. Hoffmann-La Roche Ltd, GE Healthcare, Illumina, Inc., LGC Limited, Thermo Fischer Scientific, Inc., QIAGEN, Promega Corporation, and others.

Key Segment

By Source, By Technique, By Application, and Region

Major Regions Covered

North America, Europe, Asia Pacific, Latin America, and Middle East & Africa

Purchase Options

Request customized purchase options to meet your research needs. Explore purchase options

logo Regional Analysis

North America is projected to hold the highest market share. It is primarily due to the technological advancements in the field of forensics and growing consent for hi-end forensic techniques including DNA profiling. Additionally, the growing number of forensics laboratories equipped with the latest forensic tools are propelling the market in this region. The Asia Pacific is likely to experience faster growth due to the rising rate of crimes, government funding, and advancements in technologies.

logo Competitive Players

Some of the key players participating in the global DNA Forensics market include :

  • Agilent Technologies Inc.
  • EasyDNA
  • F. Hoffmann-La Roche Ltd
  • GE Healthcare
  • Illumina Inc.
  • LGC Limited
  • Thermo Fischer Scientific Inc.
  • QIAGEN
  • Promega Corporation

logo By Source Segment Analysis

  • Hair
  • Blood
  • Bones
  • Others

logo By Technique Segment Analysis

  • Short Tandem Repeats (STR) Analysis
  • Polymerase Chain Reaction (PCR)
  • Restriction Fragment Length Polymorphism (RFLP)

logo By Application Segment Analysis

  • Healthcare
  • Biodefense
  • Law Enforcement
  • Others

logo By Regional Segment Analysis

  • North America
    • U.S.
    • Canada
  • Europe
    • UK
    • France
    • Germany
    • Italy
    • Spain
    • Rest of Europe
  • Asia Pacific
    • China
    • Japan
    • India
    • South Korea
    • Southeast Asia
    • Rest of Asia Pacific
  • Latin America
    • Brazil
    • Mexico
    • Rest of Latin America
  • Middle East and Africa
    • GCC Countries
    • South Africa
    • Rest of MEA

Table of Content

  1. Chapter 1 Executive Summary
    1. 1.1. Introduction of DNA Forensics
    2. 1.2. Global DNA Forensics Market, 2019 & 2026 (USD Million)
    3. 1.3. Global DNA Forensics Market, 2016 – 2026 (USD Million)
    4. 1.4. Global DNA Forensics Market Absolute Revenue Opportunity, 2016 – 2026 (USD Million)
    5. 1.5. Global DNA Forensics Market Incremental Revenue Opportunity, 2020 – 2026 (USD Million)
  2. Chapter 2 DNA Forensics Market – Source Analysis
    1. 2.1. Global DNA Forensics Market – Source Overview
    2. 2.2. Global DNA Forensics Market Share, by Source, 2019 & 2026 (USD Million)
    3. 2.3. Hair
      1. 2.3.1. Global Hair DNA Forensics Market, 2016 – 2026 (USD Million)
    4. 2.4. Blood
      1. 2.4.1. Global Blood DNA Forensics Market, 2016 – 2026 (USD Million)
    5. 2.5. Bones
      1. 2.5.1. Global Bones DNA Forensics Market, 2016 – 2026 (USD Million)
    6. 2.6. Others
      1. 2.6.1. Global Others DNA Forensics Market, 2016 – 2026 (USD Million)
  3. Chapter 3 DNA Forensics Market – Technique Analysis
    1. 3.1. Global DNA Forensics Market – Technique Overview
    2. 3.2. Global DNA Forensics Market Share, by Technique, 2019 & 2026 (USD Million)
    3. 3.3. Short Tandem Repeats (STR) Analysis
      1. 3.3.1. Global Short Tandem Repeats (STR) Analysis DNA Forensics Market, 2016 – 2026 (USD Million)
    4. 3.4. Polymerase Chain Reaction (PCR)
      1. 3.4.1. Global Polymerase Chain Reaction (PCR) DNA Forensics Market, 2016 – 2026 (USD Million)
    5. 3.5. Restriction Fragment Length Polymorphism (RFLP)
      1. 3.5.1. Global Restriction Fragment Length Polymorphism (RFLP) DNA Forensics Market, 2016 – 2026 (USD Million)
  4. Chapter 4 DNA Forensics Market – Application Analysis
    1. 4.1. Global DNA Forensics Market – Application Overview
    2. 4.2. Global DNA Forensics Market Share, by Application, 2019 & 2026 (USD Million)
    3. 4.3. Healthcare
      1. 4.3.1. Global Healthcare DNA Forensics Market, 2016 – 2026 (USD Million)
    4. 4.4. Biodefense
      1. 4.4.1. Global Biodefense DNA Forensics Market, 2016 – 2026 (USD Million)
    5. 4.5. Law Enforcement
      1. 4.5.1. Global Law Enforcement DNA Forensics Market, 2016 – 2026 (USD Million)
    6. 4.6. Others
      1. 4.6.1. Global Others DNA Forensics Market, 2016 – 2026 (USD Million)
  5. Chapter 5 DNA Forensics Market – Regional Analysis
    1. 5.1. Global DNA Forensics Market Regional Overview
    2. 5.2. Global DNA Forensics Market Share, by Region, 2019 & 2026 (USD Million)
    3. 5.3. North America
      1. 5.3.1. North America DNA Forensics Market, 2016 – 2026 (USD Million)
        1. 5.3.1.1. North America DNA Forensics Market, by Country, 2016 - 2026 (USD Million)
      2. 5.3.2. North America DNA Forensics Market, by Source, 2016 – 2026
        1. 5.3.2.1. North America DNA Forensics Market, by Source, 2016 – 2026 (USD Million)
      3. 5.3.3. North America DNA Forensics Market, by Technique, 2016 – 2026
        1. 5.3.3.1. North America DNA Forensics Market, by Technique, 2016 – 2026 (USD Million)
      4. 5.3.4. North America DNA Forensics Market, by Application, 2016 – 2026
        1. 5.3.4.1. North America DNA Forensics Market, by Application, 2016 – 2026 (USD Million)
      5. 5.3.5. U.S.
        1. 5.3.5.1. U.S. DNA Forensics Market, 2016 – 2026 (USD Million)
      6. 5.3.6. Canada
        1. 5.3.6.1. Canada DNA Forensics Market, 2016 – 2026 (USD Million)
    4. 5.4. Europe
      1. 5.4.1. Europe DNA Forensics Market, 2016 – 2026 (USD Million)
        1. 5.4.1.1. Europe DNA Forensics Market, by Country, 2016 - 2026 (USD Million)
      2. 5.4.2. Europe DNA Forensics Market, by Source, 2016 – 2026
        1. 5.4.2.1. Europe DNA Forensics Market, by Source, 2016 – 2026 (USD Million)
      3. 5.4.3. Europe DNA Forensics Market, by Technique, 2016 – 2026
        1. 5.4.3.1. Europe DNA Forensics Market, by Technique, 2016 – 2026 (USD Million)
      4. 5.4.4. Europe DNA Forensics Market, by Application, 2016 – 2026
        1. 5.4.4.1. Europe DNA Forensics Market, by Application, 2016 – 2026 (USD Million)
      5. 5.4.5. Germany
        1. 5.4.5.1. Germany DNA Forensics Market, 2016 – 2026 (USD Million)
      6. 5.4.6. France
        1. 5.4.6.1. France DNA Forensics Market, 2016 – 2026 (USD Million)
      7. 5.4.7. U.K.
        1. 5.4.7.1. U.K. DNA Forensics Market, 2016 – 2026 (USD Million)
      8. 5.4.8. Italy
        1. 5.4.8.1. Italy DNA Forensics Market, 2016 – 2026 (USD Million)
      9. 5.4.9. Spain
        1. 5.4.9.1. Spain DNA Forensics Market, 2016 – 2026 (USD Million)
      10. 5.4.10. Rest of Europe
        1. 5.4.10.1. Rest of Europe DNA Forensics Market, 2016 – 2026 (USD Million)
    5. 5.5. Asia Pacific
      1. 5.5.1. Asia Pacific DNA Forensics Market, 2016 – 2026 (USD Million)
        1. 5.5.1.1. Asia Pacific DNA Forensics Market, by Country, 2016 - 2026 (USD Million)
      2. 5.5.2. Asia Pacific DNA Forensics Market, by Source, 2016 – 2026
        1. 5.5.2.1. Asia Pacific DNA Forensics Market, by Source, 2016 – 2026 (USD Million)
      3. 5.5.3. Asia Pacific DNA Forensics Market, by Technique, 2016 – 2026
        1. 5.5.3.1. Asia Pacific DNA Forensics Market, by Technique, 2016 – 2026 (USD Million)
      4. 5.5.4. Asia Pacific DNA Forensics Market, by Application, 2016 – 2026
        1. 5.5.4.1. Asia Pacific DNA Forensics Market, by Application, 2016 – 2026 (USD Million)
      5. 5.5.5. China
        1. 5.5.5.1. China DNA Forensics Market, 2016 – 2026 (USD Million)
      6. 5.5.6. Japan
        1. 5.5.6.1. Japan DNA Forensics Market, 2016 – 2026 (USD Million)
      7. 5.5.7. India
        1. 5.5.7.1. India DNA Forensics Market, 2016 – 2026 (USD Million)
      8. 5.5.8. South Korea
        1. 5.5.8.1. South Korea DNA Forensics Market, 2016 – 2026 (USD Million)
      9. 5.5.9. South-East Asia
        1. 5.5.9.1. South-East Asia DNA Forensics Market, 2016 – 2026 (USD Million)
      10. 5.5.10. Rest of Asia Pacific
        1. 5.5.10.1. Rest of Asia Pacific DNA Forensics Market, 2016 – 2026 (USD Million)
    6. 5.6. Latin America
      1. 5.6.1. Latin America DNA Forensics Market, 2016 – 2026 (USD Million)
        1. 5.6.1.1. Latin America DNA Forensics Market, by Country, 2016 - 2026 (USD Million)
      2. 5.6.2. Latin America DNA Forensics Market, by Source, 2016 – 2026
        1. 5.6.2.1. Latin America DNA Forensics Market, by Source, 2016 – 2026 (USD Million)
      3. 5.6.3. Latin America DNA Forensics Market, by Technique, 2016 – 2026
        1. 5.6.3.1. Latin America DNA Forensics Market, by Technique, 2016 – 2026 (USD Million)
      4. 5.6.4. Latin America DNA Forensics Market, by Application, 2016 – 2026
        1. 5.6.4.1. Latin America DNA Forensics Market, by Application, 2016 – 2026 (USD Million)
      5. 5.6.5. Brazil
        1. 5.6.5.1. Brazil DNA Forensics Market, 2016 – 2026 (USD Million)
      6. 5.6.6. Mexico
        1. 5.6.6.1. Mexico DNA Forensics Market, 2016 – 2026 (USD Million)
      7. 5.6.7. Rest of Latin America
        1. 5.6.7.1. Rest of Latin America DNA Forensics Market, 2016 – 2026 (USD Million)
    7. 5.7. The Middle-East and Africa
      1. 5.7.1. The Middle-East and Africa DNA Forensics Market, 2016 – 2026 (USD Million)
        1. 5.7.1.1. The Middle-East and Africa DNA Forensics Market, by Country, 2016 - 2026 (USD Million)
      2. 5.7.2. The Middle-East and Africa DNA Forensics Market, by Source, 2016 – 2026
        1. 5.7.2.1. The Middle-East and Africa DNA Forensics Market, by Source, 2016 – 2026 (USD Million)
      3. 5.7.3. The Middle-East and Africa DNA Forensics Market, by Technique, 2016 – 2026
        1. 5.7.3.1. The Middle-East and Africa DNA Forensics Market, by Technique, 2016 – 2026 (USD Million)
      4. 5.7.4. The Middle-East and Africa DNA Forensics Market, by Application, 2016 – 2026
        1. 5.7.4.1. The Middle-East and Africa DNA Forensics Market, by Application, 2016 – 2026 (USD Million)
      5. 5.7.5. GCC Countries
        1. 5.7.5.1. GCC Countries DNA Forensics Market, 2016 – 2026 (USD Million)
      6. 5.7.6. South Africa
        1. 5.7.6.1. South Africa DNA Forensics Market, 2016 – 2026 (USD Million)
      7. 5.7.7. Rest of Middle-East Africa
        1. 5.7.7.1. Rest of Middle-East Africa DNA Forensics Market, 2016 – 2026 (USD Million)
  6. Chapter 6 DNA Forensics Market – Competitive Landscape
    1. 6.1. Competitor Market Share – Revenue
    2. 6.2. Market Concentration Rate Analysis, Top 3 and Top 5 Players
    3. 6.3. Strategic Developments
      1. 6.3.1. Acquisitions and Mergers
      2. 6.3.2. New Products
      3. 6.3.3. Research & Development Activities
  7. Chapter 7 Company Profiles
    1. 7.1. Agilent Technologies Inc.
      1. 7.1.1. Company Overview
      2. 7.1.2. Product/Service Portfolio
      3. 7.1.3. Agilent Technologies Inc. Sales, Revenue, and Gross Margin
      4. 7.1.4. Agilent Technologies Inc. Revenue and Growth Rate
      5. 7.1.5. Agilent Technologies Inc. Market Share
      6. 7.1.6. Recent Initiatives, Funding/VC Activities, and Technological Innovations
    2. 7.2. EasyDNA
      1. 7.2.1. Company Overview
      2. 7.2.2. Product/Service Portfolio
      3. 7.2.3. EasyDNA Sales, Revenue, and Gross Margin
      4. 7.2.4. EasyDNA Revenue and Growth Rate
      5. 7.2.5. EasyDNA Market Share
      6. 7.2.6. Recent Initiatives, Funding/VC Activities, and Technological Innovations
      7. 7.3. F. Hoffmann-La Roche Ltd
      8. 7.3.1. Company Overview
      9. 7.3.2. Product/Service Portfolio
        1. 7.3.3. F. Hoffmann-La Roche Ltd Sales, Revenue, and Gross Margin
        2. 7.3.4. F. Hoffmann-La Roche Ltd Revenue and Growth Rate
        3. 7.3.5. F. Hoffmann-La Roche Ltd Market Share
      10. 7.3.6. Recent Initiatives, Funding/VC Activities, and Technological Innovations
    3. 7.4. GE Healthcare
      1. 7.4.1. Company Overview
      2. 7.4.2. Product/Service Portfolio
      3. 7.4.3. GE Healthcare Sales, Revenue, and Gross Margin
      4. 7.4.4. GE Healthcare Revenue and Growth Rate
      5. 7.4.5. GE Healthcare Market Share
      6. 7.4.6. Recent Initiatives, Funding/VC Activities, and Technological Innovations
    4. 7.5. Illumina Inc.
      1. 7.5.1. Company Overview
      2. 7.5.2. Product/Service Portfolio
      3. 7.5.3. Illumina Inc. Sales, Revenue, and Gross Margin
      4. 7.5.4. Illumina Inc. Revenue and Growth Rate
      5. 7.5.5. Illumina Inc. Market Share
      6. 7.5.6. Recent Initiatives, Funding/VC Activities, and Technological Innovations
    5. 7.6. LGC Limited
      1. 7.6.1. Company Overview
      2. 7.6.2. Product/Service Portfolio
      3. 7.6.3. LGC Limited Sales, Revenue, and Gross Margin
      4. 7.6.4. LGC Limited Revenue and Growth Rate
      5. 7.6.5. LGC Limited Market Share
      6. 7.6.6. Recent Initiatives, Funding/VC Activities, and Technological Innovations
    6. 7.7. Thermo Fischer Scientific Inc.
      1. 7.7.1. Company Overview
      2. 7.7.2. Product/Service Portfolio
      3. 7.7.3. Thermo Fischer Scientific Inc. Sales, Revenue, and Gross Margin
      4. 7.7.4. Thermo Fischer Scientific Inc. Revenue and Growth Rate
      5. 7.7.5. Thermo Fischer Scientific Inc. Market Share
      6. 7.7.6. Recent Initiatives, Funding/VC Activities, and Technological Innovations
    7. 7.8. QIAGEN
      1. 7.8.1. Company Overview
      2. 7.8.2. Product/Service Portfolio
      3. 7.8.3. QIAGEN Sales, Revenue, and Gross Margin
      4. 7.8.4. QIAGEN Revenue and Growth Rate
      5. 7.8.5. QIAGEN Market Share
      6. 7.8.6. Recent Initiatives, Funding/VC Activities, and Technological Innovations
    8. 7.9. Promega Corporation
      1. 7.9.1. Company Overview
      2. 7.9.2. Product/Service Portfolio
      3. 7.9.3. Promega Corporation Sales, Revenue, and Gross Margin
      4. 7.9.4. Promega Corporation Revenue and Growth Rate
      5. 7.9.5. Promega Corporation Market Share
      6. 7.9.6. Recent Initiatives, Funding/VC Activities, and Technological Innovations
  8. Chapter 8 DNA Forensics — Industry Analysis
    1. 8.1. Introduction and Taxonomy
    2. 8.2. DNA Forensics Market – Key Trends
      1. 8.2.1. Market Drivers
      2. 8.2.2. Market Restraints
      3. 8.2.3. Market Opportunities
    3. 8.3. Value Chain Analysis
    4. 8.4. Key Mandates and Regulations
    5. 8.5. Technology Roadmap and Timeline
    6. 8.6. DNA Forensics Market – Attractiveness Analysis
      1. 8.6.1. By Source
      2. 8.6.2. By Technique
      3. 8.6.3. By Application
      4. 8.6.4. By Region
  9. Chapter 9 Industrial Chain, Sourcing Strategy, and Downstream Buyers
    1. 9.1. DNA Forensics Industrial Chain Analysis
    2. 9.2. Downstream Buyers
    3. 9.3. Distributors/Traders List
  10. Chapter 10 Marketing Strategy Analysis
    1. 10.1. Marketing Channel
    2. 10.2. Direct Marketing
    3. 10.3. Indirect Marketing
    4. 10.4. Marketing Channel Development Trends
    5. 10.5. Economic/Political Environmental Change
  11. Chapter 11 Report Conclusion & Key Insights
    1. 11.1. Key Insights from Primary Interviews & Surveys Respondents
    2. 11.2. Key Takeaways from Analysts, Consultants, and Industry Leaders
  12. Chapter 12 Research Approach & Methodology
    1. 12.1. Report Description
    2. 12.2. Research Scope
    3. 12.3. Research Methodology
      1. 12.3.1. Secondary Research
      2. 12.3.2. Primary Research
      3. 12.3.3. Statistical Models
        1. 12.3.3.1. Company Share Analysis Model
        2. 12.3.3.2. Revenue Based Modeling
      4. 12.3.4. Research Limitations

      List of Figures

      Fig.1	Product Picture of DNA Forensics
      Fig.2	Global DNA Forensics Market, 2016 – 2026 (USD Million)
      Fig.3	Global DNA Forensics Market Absolute Revenue Opportunity, 2016 – 2026 (USD Million)
      Fig.4	Global DNA Forensics Market Incremental Revenue Opportunity, 2020 – 2026 (USD Million)
      Fig.5	Global DNA Forensics Market Share, by Source, 2019 & 2026 (USD Million)
      Fig.6	Global Hair DNA Forensics Market, 2016 – 2026 (USD Million)
      Fig.7	Global Blood DNA Forensics Market, 2016 – 2026 (USD Million)
      Fig.8	Global Bones DNA Forensics Market, 2016 – 2026 (USD Million)
      Fig.9	Global Others DNA Forensics Market, 2016 – 2026 (USD Million)
      Fig.10	Global DNA Forensics Market Share, by Technique, 2019 & 2026 (USD Million)
      Fig.11	Global Short Tandem Repeats (STR) Analysis DNA Forensics Market, 2016 – 2026 (USD Million)
      Fig.12	Global Polymerase Chain Reaction (PCR) DNA Forensics Market, 2016 – 2026 (USD Million)
      Fig.13	Global Restriction Fragment Length Polymorphism (RFLP) DNA Forensics Market, 2016 – 2026 (USD Million)
      Fig.14	Global DNA Forensics Market Share, by Application, 2019 & 2026 (USD Million)
      Fig.15	Global Healthcare DNA Forensics Market, 2016 – 2026 (USD Million)
      Fig.16	Global Biodefense DNA Forensics Market, 2016 – 2026 (USD Million)
      Fig.17	Global Law Enforcement DNA Forensics Market, 2016 – 2026 (USD Million)
      Fig.18	Global Others DNA Forensics Market, 2016 – 2026 (USD Million)
      Fig.19	Global DNA Forensics Market Share, by Region, 2019 & 2026 (USD Million)
      Fig.20	North America DNA Forensics Market, 2016 – 2026 (USD Million)
      Fig.21	U.S. DNA Forensics Market, 2016 – 2026 (USD Million)
      Fig.22	Canada DNA Forensics Market, 2016 – 2026 (USD Million)
      Fig.23	Europe DNA Forensics Market, 2016 – 2026 (USD Million)
      Fig.24	Germany DNA Forensics Market, 2016 – 2026 (USD Million)
      Fig.25	France DNA Forensics Market, 2016 – 2026 (USD Million)
      Fig.26	U.K. DNA Forensics Market, 2016 – 2026 (USD Million)
      Fig.27	Italy DNA Forensics Market, 2016 – 2026 (USD Million)
      Fig.28	Spain DNA Forensics Market, 2016 – 2026 (USD Million)
      Fig.29	Rest of Europe DNA Forensics Market, 2016 – 2026 (USD Million)
      Fig.30	Asia Pacific DNA Forensics Market, 2016 – 2026 (USD Million)
      Fig.31	China DNA Forensics Market, 2016 – 2026 (USD Million)
      Fig.32	Japan DNA Forensics Market, 2016 – 2026 (USD Million)
      Fig.33	India DNA Forensics Market, 2016 – 2026 (USD Million)
      Fig.34	South  Korea DNA Forensics Market, 2016 – 2026 (USD Million)
      Fig.35	South-East Asia DNA Forensics Market, 2016 – 2026 (USD Million)
      Fig.36	Rest of Asia Pacific DNA Forensics Market, 2016 – 2026 (USD Million)
      Fig.37	Latin America DNA Forensics Market, 2016 – 2026 (USD Million)
      Fig.38	Brazil DNA Forensics Market, 2016 – 2026 (USD Million)
      Fig.39	Mexico DNA Forensics Market, 2016 – 2026 (USD Million)
      Fig.40	Rest of Latin America DNA Forensics Market, 2016 – 2026 (USD Million)
      Fig.41	The Middle-East and Africa DNA Forensics Market, 2016 – 2026 (USD Million)
      Fig.42	GCC Countries DNA Forensics Market, 2016 – 2026 (USD Million)
      Fig.43	South Africa DNA Forensics Market, 2016 – 2026 (USD Million)
      Fig.44	Rest of Middle-East Africa DNA Forensics Market, 2016 – 2026 (USD Million)
      Fig.45	Competitor Market Share – Revenue
      Fig.46	Agilent Technologies Inc. Revenue and Growth Rate
      Fig.47	Agilent Technologies Inc. Market Share
      Fig.48	EasyDNA Revenue and Growth Rate
      Fig.49	EasyDNA Market Share
      Fig.50	F. Hoffmann-La Roche Ltd Revenue and Growth Rate
      Fig.51	F. Hoffmann-La Roche Ltd Market Share
      Fig.52	GE Healthcare Revenue and Growth Rate
      Fig.53	GE Healthcare Market Share
      Fig.54	Illumina Inc. Revenue and Growth Rate
      Fig.55	Illumina Inc. Market Share
      Fig.56	LGC Limited Revenue and Growth Rate
      Fig.57	LGC Limited Market Share
      Fig.58	Thermo Fischer Scientific Inc. Revenue and Growth Rate
      Fig.59	Thermo Fischer Scientific Inc. Market Share
      Fig.60	QIAGEN Revenue and Growth Rate
      Fig.61	QIAGEN Market Share
      Fig.62	Promega Corporation Revenue and Growth Rate
      Fig.63	Promega Corporation Market Share
      Fig.64	Market Dynamics
      Fig.65	Global DNA Forensics – Value Chain Analysis
      Fig.66	Key Mandates and Regulations
      Fig.67	Technology Roadmap and Timeline
      Fig.68	Market Attractiveness Analysis – By Source
      Fig.69	Market Attractiveness Analysis – By Technique
      Fig.70	Market Attractiveness Analysis – By Application
      Fig.71	Market Attractiveness Analysis – By Region
      Fig.72	DNA Forensics Industrial Chain Analysis
      Fig.73	Market Channels
      Fig.74	Marketing Channel Development Trend
      Fig.75	Growth in World Gross Product, 2008-2018
      

      List of Tables

      Table 1	Global DNA Forensics Market, 2019 & 2026 (USD Million)
      Table 2	Global DNA Forensics Market, by Source, 2016 – 2026 (USD Million)
      Table 3	Global DNA Forensics Market, by Technique, 2016 – 2026 (USD Million)
      Table 4	Global DNA Forensics Market, by Application, 2016 – 2026 (USD Million)
      Table 5	Global DNA Forensics Market, by Region, 2016 – 2026 (USD Million)
      Table 6	North America DNA Forensics Market, by Country, 2016 – 2026 (USD Million)
      Table 7	North America DNA Forensics Market, by Source, 2016 – 2026 (USD Million)
      Table 8	North America DNA Forensics Market, by Technique, 2016 – 2026 (USD Million)
      Table 9	North America DNA Forensics Market, by Application, 2016 – 2026 (USD Million)
      Table 10 Europe DNA Forensics Market, by Country, 2016 – 2026 (USD Million)
      Table 11 Europe DNA Forensics Market, by Source, 2016 – 2026 (USD Million)
      Table 12 Europe DNA Forensics Market, by Technique, 2016 – 2026 (USD Million)
      Table 13 Europe DNA Forensics Market, by Application, 2016 – 2026 (USD Million)
      Table 14 Asia Pacific DNA Forensics Market, by Country, 2016 – 2026 (USD Million)
      Table 15 Asia Pacific DNA Forensics Market, by Source, 2016 – 2026 (USD Million)
      Table 16 Asia Pacific DNA Forensics Market, by Technique, 2016 – 2026 (USD Million)
      Table 17 Asia Pacific DNA Forensics Market, by Application, 2016 – 2026 (USD Million)
      Table 18 Latin America DNA Forensics Market, by Country, 2016 – 2026 (USD Million)
      Table 19 Latin America DNA Forensics Market, by Source, 2016 – 2026 (USD Million)
      Table 20 Latin America DNA Forensics Market, by Technique, 2016 – 2026 (USD Million)
      Table 21 Latin America DNA Forensics Market, by Application, 2016 – 2026 (USD Million)
      Table 22 The Middle-East and Africa DNA Forensics Market, by Country, 2016 – 2026 (USD Million)
      Table 23 The Middle-East and Africa DNA Forensics Market, by Source, 2016 – 2026 (USD Million)
      Table 24 The Middle-East and Africa DNA Forensics Market, by Technique, 2016 – 2026 (USD Million)
      Table 25 The Middle-East and Africa DNA Forensics Market, by Application, 2016 – 2026 (USD Million)
      Table 26 Global DNA Forensics Market - Company Revenue Analysis, 2016 – 2019 (USD Million)
      Table 27 Global DNA Forensics Market - Company Revenue Share Analysis, 2016 – 2019 (%)
      Table 28 Acquisitions and Mergers
      Table 29 Market Drivers – Impact Analysis
      Table 30 Market Restraints
      Table 31 Market Opportunities
      Table 32 Major Buyers of DNA Forensics
      Table 33 Distributors/Traders of DNA Forensics by Region
      

Industry Major Market Players

  • Agilent Technologies Inc.
  • EasyDNA
  • F. Hoffmann-La Roche Ltd
  • GE Healthcare
  • Illumina Inc.
  • LGC Limited
  • Thermo Fischer Scientific Inc.
  • QIAGEN
  • Promega Corporation