Search Market Research Report

Discover Our Latest Reports
Discover Our Featured Reports
Discover Top Selling Reports

Dental Turbine Market Size, Share Global Analysis Report, , 2021 – 2026

report img

Dental Turbine Market By Product Type (Air-Driven Turbines, Electric Turbines, and Hybrid Air-Electric Turbines), By Speed (High-Speed Dental Turbines and Low-Speed Dental Turbines), By End-User (Hospitals, Dental Clinics, and Academic & Research Centers): Global & Regional Industry Perspective, Comprehensive Analysis, and Forecast, 2021 – 2026

Industry Insights

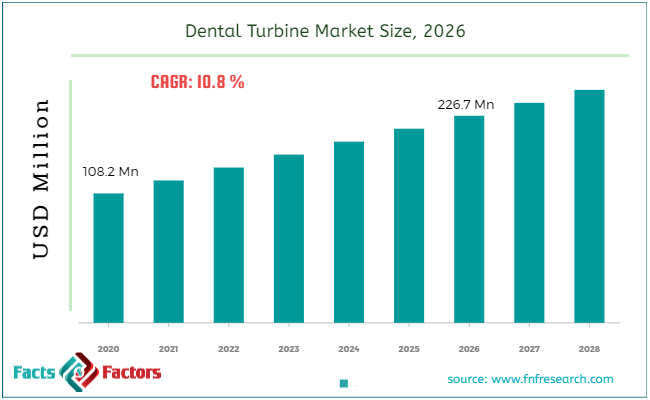
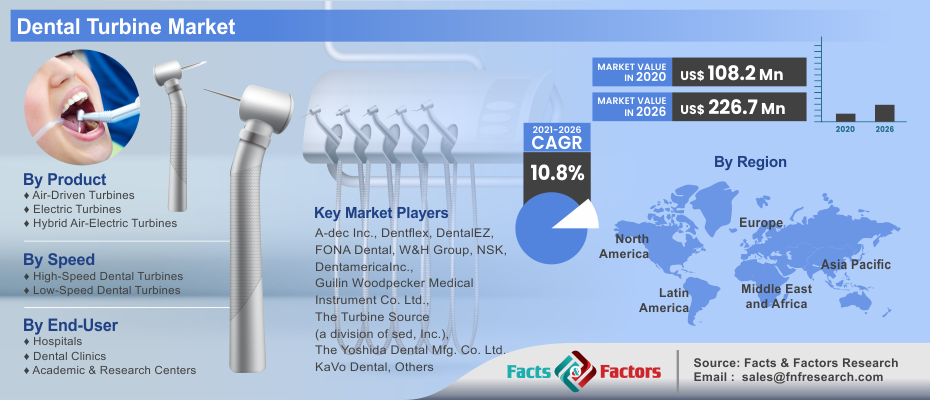
[187+ Pages Report] According to the report published by the Facts & Factors, the global dental turbine market was estimated at approximately USD 108.2 Million in 2020 and is expected to generate revenue of around USD 226.7 Million by end of 2026, growing at a CAGR of around 10.8% between 2021 and 2026.

Dental Turbine Market Size

To know more about this report | Request Free Sample Copy

logoMarket Overview

Dental turbines are instruments designed to perform dental procedures by combining precision parts that move in perfect synchronization the dental drill, also known as the dental handpiece, should be safe, effective, and available at a wide range of speeds, allowing for gross hard tissue removal, preparation refinement, and performance with minimal patient discomfort. For more than 30 years, dental turbines have been widely used in clinical dentistry.

Dental Turbine Market

To know more about this report | Request Free Sample Copy

logoIndustry Growth Factor

The rise in the incidence of dental disorders, as well as the increase in the number of specialized dental clinics, the adoption of advanced technologies by dentists, and rising aesthetic dental awareness, is driving the growth of the global dental turbines market. However, the high cost of dental handpiece devices, heavy materials, and brand loyalty are the factors impeding global deregulation and speed. These instruments are used to eliminate dental decay and restructure a tooth before a filling or crown is placed. During endodontic procedures, dental turbines are also utilized to clean or shape the root canal. Dental drills can rotate at speeds ranging from 100,000 to 400,000 revolutions per minute. Metal alloy bits, also known as burrs in dental turbines, can be made of steel coated with either tungsten carbide or diamond.

Bonding, implants, dental crowns, canalling, dental bridges, periodontal treatments, and maxillofacial procedures are among the most commonly performed dental procedures. As a result, the high demand for these dental treatments is expected to favor the growth of the dental turbine market. Furthermore, nearly 99.7 percent of adults believe that their smile is an important social asset, according to a survey conducted by the American Academy of Cosmetic Dentistry. While nearly 74.0 percent of adults believe that an unattractive smile can harm a person's chances of success in the workplace. People have chosen beautification and restorative procedures as a result of such factors. This, in turn, is likely to drive the dentistry market in the future and thereby favor the growth of the market for dental turbines.

logoSegmentation Analysis

The dental turbines market is divided into three categories: product type, speed, and end-user. The market based on product type is separated into air-driven turbines, electric turbines, and hybrid air-electric turbines. Air-driven turbines are less expensive than electric turbines; however, electric turbines provide more torque than air-driven turbines. Based on the speed, the market is classified into high-speed dental turbines and low-speed dental turbines. In procedures such as dental cuttings and finishing restoration, high-speed turbines are preferred. Based on the end-user, the dental turbines market is segmented into hospitals, dental clinics, and academic & research centers. Hospitals and dental clinics are likely to drive in this segment in the coming years.

logoReport Scope

Report Attribute

Details

Market Size in 2020

USD 108.2 Million

Projected Market Size in 2026

USD 226.7 Million

CAGR Growth Rate

10.8% CAGR

Base Year

2020

Forecast Years

2021-2026

Key Market Players

A-dec Inc., Dentflex, DentalEZ, FONA Dental, W&H Group, NSK, DentamericaInc., Guilin Woodpecker Medical Instrument Co. Ltd., The Turbine Source (a division of sed, Inc.), The Yoshida Dental     Mfg. Co. Ltd., KaVo Dental, Cefla S.C., and DentsplySirona Inc.

Key Segment

By Product Type, Speed, End-User, and Region

Major Regions Covered

North America, Europe, Asia Pacific, Latin America, and the Middle East & Africa

Purchase Options

Request customized purchase options to meet your research needs. Explore purchase options

logo Regional Analysis

The dental turbines market can be divided into North America, Europe, Asia Pacific, Latin America, and the Middle East and Africa. North America leads the global dental turbines market due to an increase in dental visits, technological advancements, and the availability of world-class and specialized dental hospitals and clinics. Europe is the second-largest market for dental turbines, owing to the population's high awareness of oral health. Due to an increase in the number of patients with dental disorders and the adoption of novel dental technologies by dentists in emerging countries such as India and China, Asia Pacific is expected to be the most lucrative market for dental turbines.

logo Competitive Players

Major companies in the dental turbine market include :

  • A-dec Inc.
  • Dentflex
  • DentalEZ
  • FONA Dental
  • W&H Group
  • NSK
  • Dentamerica Inc.
  • Guilin Woodpecker Medical Instrument Co. Ltd.
  • The Turbine Source (a division of sed, Inc.)
  • The Yoshida Dental Mfg. Co. Ltd.
  • KaVo Dental
  • Cefla S.C.
  • DentsplySirona Inc.

For example, KaVo Kerr is a dental equipment manufacturer group that was spun off from Danaher Corporation. In 2014, Kerr acquired DUX Dental and Vettec Inc. and In 2015, Total Care, Axis SybronEndo, and Kerr reorganized into a unilateral organization: Kerr Dental.

logo By Product Type

  • Air-Driven Turbines
  • Electric Turbines
  • Hybrid Air-Electric Turbines

logo By Speed

  • High-Speed Dental Turbines
  • Low-Speed Dental Turbines

logo By End-User

  • Hospitals
  • Dental Clinics
  • Academic & Research Centers

logo Regional Segmentation Analysis

  • North America
    • The U.S.
    • Canada
  • Europe
    • France
    • The UK
    • Spain
    • Germany
    • Italy
    • Rest of Europe
  • Asia Pacific
    • China
    • Japan
    • India
    • South Korea
    • Southeast Asia
    • Rest of Asia Pacific
  • Latin America
    • Brazil
    • Mexico
    • Rest of Latin America
  • Middle East & Africa
    • GCC
    • South Africa
    • Rest of the Middle East & Africa

Table of Content

  1. Chapter 1 Executive Summary
    1. 1.1. Introduction of Dental Turbine
    2. 1.2. Global Dental`, 2020 & 2026 (USD Million)
    3. 1.3. Global Dental Turbine Market, 2016 – 2026(USD Million)
    4. 1.4. Global Dental Turbine MarketAbsolute Revenue Opportunity, 2016 – 2026(USD Million)
    5. 1.5. Global Dental Turbine MarketIncremental Revenue Opportunity, 2020 – 2026(USD Million)
  2. Chapter 2 DentalTurbine Market – Type Analysis
    1. 2.1. Global Dental Turbine Market – Type Overview
    2. 2.2. Global Dental Turbine Market Share, by Type, 2020 & 2026(USD Million)
    3. 2.3. Air-Driven Turbines
      1. 2.3.1. Global Air-Driven Turbines Dental Turbine Market, 2016 – 2026(USD Million)
    4. 2.4. Electric Turbines
      1. 2.4.1. Global Electric Turbines Dental Turbine Market, 2016 – 2026(USD Million)
    5. 2.5. Hybrid Air-Electric Turbines
      1. 2.5.1. Global Hybrid Air-Electric Turbines Dental Turbine Market, 2016 – 2026(USD Million)
  3. Chapter 3 DentalTurbine Market – Speed Analysis
    1. 3.1. Global Dental Turbine Market – Speed Overview
    2. 3.2. Global Dental Turbine Market Share, by Speed, 2020 & 2026(USD Million)
    3. 3.3. High-Speed Dental Turbines
      1. 3.3.1. Global High-Speed Dental Turbines Dental Turbine Market, 2016 – 2026(USD Million)
    4. 3.4. Low-Speed Dental Turbines
      1. 3.4.1. Global Low-Speed Dental Turbines Dental Turbine Market, 2016 – 2026(USD Million)
  4. Chapter 4 DentalTurbine Market – Ens-User Analysis
    1. 4.1. Global Dental Turbine Market – Ens-User Overview
    2. 4.2. Global Dental Turbine Market Share, by Ens-User, 2020 & 2026(USD Million)
    3. 4.3. Hospitals
      1. 4.3.1. Global Hospitals Dental Turbine Market, 2016 – 2026(USD Million)
    4. 4.4. Dental Clinics
      1. 4.4.1. Global Dental Clinics Dental Turbine Market, 2016 – 2026(USD Million)
    5. 4.5. Academic & Research Centers
      1. 4.5.1. Global Academic & Research Centers Dental Turbine Market, 2016 – 2026(USD Million)
  5. Chapter 5 DentalTurbine Market – Regional Analysis
    1. 5.1. Global Dental Turbine Market Regional Overview
    2. 5.2. Global Dental Turbine Market Share, by Region, 2020 & 2026(USD Million)
    3. 5.3. North America
      1. 5.3.1. North America Dental Turbine Market, 2016 – 2026(USD Million)
        1. 5.3.1.1. North America Dental Turbine Market, by Country, 2016 - 2026(USD Million)
      2. 5.3.2. North America Dental Turbine Market, by Type, 2016 – 2026
        1. 5.3.2.1. North America Dental Turbine Market, by Type, 2016 – 2026(USD Million)
      3. 5.3.3. North America Dental Turbine Market, by Speed, 2016 – 2026
        1. 5.3.3.1. North America Dental Turbine Market, by Speed, 2016 – 2026(USD Million)
      4. 5.3.4. North America Dental Turbine Market, by Ens-User, 2016 – 2026
        1. 5.3.4.1. North America Dental Turbine Market, by Ens-User, 2016 – 2026(USD Million)
      5. 5.3.5. U.S.
        1. 5.3.5.1. U.S. DentalTurbine Market, 2016 – 2026(USD Million)
      6. 5.3.6. Canada
        1. 5.3.6.1. Canada DentalTurbine Market, 2016 – 2026(USD Million)
    4. 5.4. Europe
      1. 5.4.1. Europe Dental Turbine Market, 2016 – 2026(USD Million)
        1. 5.4.1.1. Europe Dental Turbine Market, by Country, 2016 - 2026(USD Million)
      2. 5.4.2. Europe Dental Turbine Market, by Type, 2016 – 2026
        1. 5.4.2.1. Europe Dental Turbine Market, by Type, 2016 – 2026(USD Million)
      3. 5.4.3. Europe Dental Turbine Market, by Speed, 2016 – 2026
        1. 5.4.3.1. Europe Dental Turbine Market, by Speed, 2016 – 2026(USD Million)
      4. 5.4.4. Europe Dental Turbine Market, by Ens-User, 2016 – 2026
        1. 5.4.4.1. Europe Dental Turbine Market, by Ens-User, 2016 – 2026(USD Million)
      5. 5.4.5. Germany
        1. 5.4.5.1. Germany DentalTurbine Market, 2016 – 2026(USD Million)
      6. 5.4.6. France
        1. 5.4.6.1. France DentalTurbine Market, 2016 – 2026(USD Million)
      7. 5.4.7. U.K.
        1. 5.4.7.1. U.K. DentalTurbine Market, 2016 – 2026(USD Million)
      8. 5.4.8. Italy
        1. 5.4.8.1. Italy DentalTurbine Market, 2016 – 2026(USD Million)
      9. 5.4.9. Spain
        1. 5.4.9.1. Spain DentalTurbine Market, 2016 – 2026(USD Million)
      10. 5.4.10. Rest of Europe
        1. 5.4.10.1. Rest of Europe DentalTurbine Market, 2016 – 2026(USD Million)
    5. 5.5. Asia Pacific
      1. 5.5.1. Asia Pacific Dental Turbine Market, 2016 – 2026(USD Million)
        1. 5.5.1.1. Asia Pacific Dental Turbine Market, by Country, 2016 - 2026(USD Million)
      2. 5.5.2. Asia Pacific Dental Turbine Market, by Type, 2016 – 2026
        1. 5.5.2.1. Asia Pacific Dental Turbine Market, by Type, 2016 – 2026(USD Million)
      3. 5.5.3. Asia Pacific Dental Turbine Market, by Speed, 2016 – 2026
        1. 5.5.3.1. Asia Pacific Dental Turbine Market, by Speed, 2016 – 2026(USD Million)
      4. 5.5.4. Asia Pacific Dental Turbine Market, by Ens-User, 2016 – 2026
        1. 5.5.4.1. Asia Pacific Dental Turbine Market, by Ens-User, 2016 – 2026(USD Million)
      5. 5.5.5. China
        1. 5.5.5.1. China DentalTurbine Market, 2016 – 2026(USD Million)
      6. 5.5.6. Japan
        1. 5.5.6.1. Japan DentalTurbine Market, 2016 – 2026(USD Million)
      7. 5.5.7. India
        1. 5.5.7.1. India DentalTurbine Market, 2016 – 2026(USD Million)
      8. 5.5.8. South Korea
        1. 5.5.8.1. South Korea DentalTurbine Market, 2016 – 2026(USD Million)
      9. 5.5.9. South-East Asia
        1. 5.5.9.1. South-East Asia DentalTurbine Market, 2016 – 2026(USD Million)
      10. 5.5.10. Rest of Asia Pacific
        1. 5.5.10.1. Rest of Asia Pacific DentalTurbine Market, 2016 – 2026(USD Million)
    6. 5.6. Latin America
      1. 5.6.1. Latin America Dental Turbine Market, 2016 – 2026(USD Million)
        1. 5.6.1.1. Latin America Dental Turbine Market, by Country, 2016 - 2026(USD Million)
      2. 5.6.2. Latin America Dental Turbine Market, by Type, 2016 – 2026
        1. 5.6.2.1. Latin America Dental Turbine Market, by Type, 2016 – 2026(USD Million)
      3. 5.6.3. Latin America Dental Turbine Market, by Speed, 2016 – 2026
        1. 5.6.3.1. Latin America Dental Turbine Market, by Speed, 2016 – 2026(USD Million)
      4. 5.6.4. Latin America Dental Turbine Market, by Ens-User, 2016 – 2026
        1. 5.6.4.1. Latin America Dental Turbine Market, by Ens-User, 2016 – 2026(USD Million)
      5. 5.6.5. Brazil
        1. 5.6.5.1. Brazil DentalTurbine Market, 2016 – 2026(USD Million)
      6. 5.6.6. Mexico
        1. 5.6.6.1. Mexico DentalTurbine Market, 2016 – 2026(USD Million)
      7. 5.6.7. Rest of Latin America
        1. 5.6.7.1. Rest of Latin America DentalTurbine Market, 2016 – 2026(USD Million)
    7. 5.7. The Middle-East and Africa
      1. 5.7.1. The Middle-East and Africa Dental Turbine Market, 2016 – 2026(USD Million)
        1. 5.7.1.1. The Middle-East and Africa Dental Turbine Market, by Country, 2016 - 2026(USD Million)
      2. 5.7.2. The Middle-East and Africa Dental Turbine Market, by Type, 2016 – 2026
        1. 5.7.2.1. The Middle-East and Africa Dental Turbine Market, by Type, 2016 – 2026(USD Million)
      3. 5.7.3. The Middle-East and Africa Dental Turbine Market, by Speed, 2016 – 2026
        1. 5.7.3.1. The Middle-East and Africa Dental Turbine Market, by Speed, 2016 – 2026(USD Million)
      4. 5.7.4. The Middle-East and Africa Dental Turbine Market, by Ens-User, 2016 – 2026
        1. 5.7.4.1. The Middle-East and Africa Dental Turbine Market, by Ens-User, 2016 – 2026(USD Million)
      5. 5.7.5. GCC Countries
        1. 5.7.5.1. GCC Countries DentalTurbine Market, 2016 – 2026(USD Million)
      6. 5.7.6. South Africa
        1. 5.7.6.1. South Africa DentalTurbine Market, 2016 – 2026(USD Million)
      7. 5.7.7. Rest of Middle-East Africa
        1. 5.7.7.1. Rest of Middle-East Africa DentalTurbine Market, 2016 – 2026(USD Million)
  6. Chapter 6 DentalTurbine Market – Competitive Landscape
    1. 6.1. Competitor Market Share – Revenue
    2. 6.2. Market Concentration Rate Analysis, Top 3 and Top 5 Players
    3. 6.3. Strategic Developments
      1. 6.3.1. Acquisitions and Mergers
      2. 6.3.2. New Products
      3. 6.3.3. Research & Development Activities
  7. Chapter 7 Company Profiles
    1. 7.1. A-dec Inc.
      1. 7.1.1. Company Overview
      2. 7.1.2. Product/ServicePortfolio
      3. 7.1.3. A-dec Inc. Sales, Revenue, and Gross Margin
      4. 7.1.4. A-dec Inc. Revenue and Growth Rate
      5. 7.1.5. A-dec Inc. Market Share
      6. 7.1.6. Recent Initiatives, Funding/VC Activities, and Technological Innovations
    2. 7.2. Dentflex
      1. 7.2.1. Company Overview
      2. 7.2.2. Product/ServicePortfolio
      3. 7.2.3. Dentflex Sales, Revenue, and Gross Margin
      4. 7.2.4. Dentflex Revenue and Growth Rate
      5. 7.2.5. Dentflex Market Share
      6. 7.2.6. Recent Initiatives, Funding/VC Activities, and Technological Innovations
    3. 7.3. DentalEZ
      1. 7.3.1. Company Overview
      2. 7.3.2. Product/ServicePortfolio
      3. 7.3.3. DentalEZ Sales, Revenue, and Gross Margin
      4. 7.3.4. DentalEZ Revenue and Growth Rate
      5. 7.3.5. DentalEZ Market Share
      6. 7.3.6. Recent Initiatives, Funding/VC Activities, and Technological Innovations
    4. 7.4. FONA Dental
      1. 7.4.1. Company Overview
      2. 7.4.2. Product/ServicePortfolio
      3. 7.4.3. FONA Dental Sales, Revenue, and Gross Margin
      4. 7.4.4. FONA Dental Revenue and Growth Rate
      5. 7.4.5. FONA Dental Market Share
      6. 7.4.6. Recent Initiatives, Funding/VC Activities, and Technological Innovations
    5. 7.5. W&H Group
      1. 7.5.1. Company Overview
      2. 7.5.2. Product/ServicePortfolio
      3. 7.5.3. W&H Group Sales, Revenue, and Gross Margin
      4. 7.5.4. W&H Group Revenue and Growth Rate
      5. 7.5.5. W&H Group Market Share
      6. 7.5.6. Recent Initiatives, Funding/VC Activities, and Technological Innovations
    6. 7.6. NSK
      1. 7.6.1. Company Overview
      2. 7.6.2. Product/ServicePortfolio
      3. 7.6.3. NSK Sales, Revenue, and Gross Margin
      4. 7.6.4. NSK Revenue and Growth Rate
      5. 7.6.5. NSK Market Share
      6. 7.6.6. Recent Initiatives, Funding/VC Activities, and Technological Innovations
    7. 7.7. Dentamerica Inc.
      1. 7.7.1. Company Overview
      2. 7.7.2. Product/ServicePortfolio
      3. 7.7.3. Dentamerica Inc. Sales, Revenue, and Gross Margin
      4. 7.7.4. Dentamerica Inc. Revenue and Growth Rate
      5. 7.7.5. Dentamerica Inc. Market Share
      6. 7.7.6. Recent Initiatives, Funding/VC Activities, and Technological Innovations
    8. 7.8. Guilin Woodpecker Medical Instrument Co. Ltd.
      1. 7.8.1. Company Overview
      2. 7.8.2. Product/ServicePortfolio
      3. 7.8.3. Guilin Woodpecker Medical Instrument Co. Ltd. Sales, Revenue, and Gross Margin
      4. 7.8.4. Guilin Woodpecker Medical Instrument Co. Ltd. Revenue and Growth Rate
      5. 7.8.5. Guilin Woodpecker Medical Instrument Co. Ltd. Market Share
      6. 7.8.6. Recent Initiatives, Funding/VC Activities, and Technological Innovations
    9. 7.9. The Turbine Source
      1. 7.9.1. Company Overview
      2. 7.9.2. Product/ServicePortfolio
      3. 7.9.3. The Turbine Source Sales, Revenue, and Gross Margin
      4. 7.9.4. The Turbine Source Revenue and Growth Rate
      5. 7.9.5. The Turbine Source Market Share
      6. 7.9.6. Recent Initiatives, Funding/VC Activities, and Technological Innovations
    10. 7.10. The Yoshida Dental Mfg. Co. Ltd.
      1. 7.10.1. Company Overview
      2. 7.10.2. Product/ServicePortfolio
      3. 7.10.3. The Yoshida Dental Mfg. Co. Ltd. Sales, Revenue, and Gross Margin
      4. 7.10.4. The Yoshida Dental Mfg. Co. Ltd. Revenue and Growth Rate
      5. 7.10.5. The Yoshida Dental Mfg. Co. Ltd. Market Share
      6. 7.10.6. Recent Initiatives, Funding/VC Activities, and Technological Innovations
    11. 7.11. KaVo Dental
      1. 7.11.1. Company Overview
      2. 7.11.2. Product/ServicePortfolio
      3. 7.11.3. KaVo Dental Sales, Revenue, and Gross Margin
      4. 7.11.4. KaVo Dental Revenue and Growth Rate
      5. 7.11.5. KaVo Dental Market Share
      6. 7.11.6. Recent Initiatives, Funding/VC Activities, and Technological Innovations
    12. 7.12. Cefla S.C.
      1. 7.12.1. Company Overview
      2. 7.12.2. Product/ServicePortfolio
      3. 7.12.3. Cefla S.C. Sales, Revenue, and Gross Margin
      4. 7.12.4. Cefla S.C. Revenue and Growth Rate
      5. 7.12.5. Cefla S.C. Market Share
      6. 7.12.6. Recent Initiatives, Funding/VC Activities, and Technological Innovations
    13. 7.13. Dentsply Sirona Inc.
      1. 7.13.1. Company Overview
      2. 7.13.2. Product/ServicePortfolio
      3. 7.13.3. Dentsply Sirona Inc. Sales, Revenue, and Gross Margin
      4. 7.13.4. Dentsply Sirona Inc. Revenue and Growth Rate
      5. 7.13.5. Dentsply Sirona Inc. Market Share
      6. 7.13.6. Recent Initiatives, Funding/VC Activities, and Technological Innovations
  8. Chapter 8 Dental Turbine — Industry Analysis
    1. 8.1. Introduction and Taxonomy
    2. 8.2. Dental Turbine Market – Key Trends
      1. 8.2.1. Market Drivers
      2. 8.2.2. Market Restraints
      3. 8.2.3. Market Opportunities
    3. 8.3. Value Chain Analysis
    4. 8.4. Key Mandates and Regulations
    5. 8.5. Technology Roadmap and Timeline
    6. 8.6. DentalTurbine Market – Attractiveness Analysis
      1. 8.6.1. By Type
      2. 8.6.2. By Speed
      3. 8.6.3. By Ens-User
      4. 8.6.4. By Region
  9. Chapter 9 Industrial Chain, Sourcing Strategy, and Downstream Buyers
    1. 9.1. Dental Turbine Industrial Chain Analysis
    2. 9.2. Downstream Buyers
    3. 9.3. Distributors/Traders List
  10. Chapter 10 Marketing Strategy Analysis
    1. 10.1. Marketing Channel
    2. 10.2. Direct Marketing
    3. 10.3. Indirect Marketing
    4. 10.4. Marketing Channel Development Trends
    5. 10.5. Economic/Political Environmental Change
  11. Chapter 11 Report Conclusion& Key Insights
    1. 11.1. Key Insights from Primary Interviews & Surveys Respondents
    2. 11.2. Key Takeaways from Analysts, Consultants, and Industry Leaders
  12. Chapter 12 Research Approach & Methodology
    1. 12.1. Report Description
    2. 12.2. Research Scope
    3. 12.3. Research Methodology
      1. 12.3.1. Secondary Research
      2. 12.3.2. Primary Research
      3. 12.3.3. Statistical Models
        1. 12.3.3.1. Company Share Analysis Model
        2. 12.3.3.2. Revenue Based Modeling
      4. 12.3.4. Research Limitations

      List of Figures

      Fig.1	Product Picture of  Dental Turbine
      Fig.2	Global  Dental Turbine Market, 2016 – 2026(USD Million)
      Fig.3	Global  Dental Turbine MarketAbsolute Revenue Opportunity, 2016 – 2026(USD Million)
      Fig.4	Global  Dental Turbine MarketIncremental Revenue Opportunity, 2020 – 2026(USD Million)
      Fig.5	Global  Dental Turbine Market Share, by Type, 2020 & 2026(USD Million)
      Fig.6	Global Air-Driven Turbines Dental Turbine Market, 2016 – 2026(USD Million)
      Fig.7	Global Electric Turbines Dental Turbine Market, 2016 – 2026(USD Million)
      Fig.8	Global Hybrid Air-Electric Turbines Dental Turbine Market, 2016 – 2026(USD Million)
      Fig.9	Global  Dental Turbine Market Share, by Speed, 2020 & 2026(USD Million)
      Fig.10	Global High-Speed  Dental Turbines Dental Turbine Market, 2016 – 2026(USD Million)
      Fig.11	Global Low-Speed  Dental Turbines Dental Turbine Market, 2016 – 2026(USD Million)
      Fig.12	Global  Dental Turbine Market Share, by Ens-User, 2020 & 2026(USD Million)
      Fig.13	Global Hospitals Dental Turbine Market, 2016 – 2026(USD Million)
      Fig.14	Global  Dental Clinics Dental Turbine Market, 2016 – 2026(USD Million)
      Fig.15	Global Academic & Research Centers Dental Turbine Market, 2016 – 2026(USD Million)
      Fig.16	Global  Dental Turbine MarketShare, by Region, 2020 & 2026(USD Million)
      Fig.17	North America Dental Turbine Market, 2016 – 2026(USD Million)
      Fig.18	U.S. Dental Turbine Market, 2016 – 2026(USD Million)
      Fig.19	Canada Dental Turbine Market, 2016 – 2026(USD Million)
      Fig.20	Europe Dental Turbine Market, 2016 – 2026(USD Million)
      Fig.21	Germany Dental Turbine Market, 2016 – 2026(USD Million)
      Fig.22	France Dental Turbine Market, 2016 – 2026(USD Million)
      Fig.23	U.K. Dental Turbine Market, 2016 – 2026(USD Million)
      Fig.24	Italy Dental Turbine Market, 2016 – 2026(USD Million)
      Fig.25	Spain Dental Turbine Market, 2016 – 2026(USD Million)
      Fig.26	Rest of Europe Dental Turbine Market, 2016 – 2026(USD Million)
      Fig.27	Asia Pacific Dental Turbine Market, 2016 – 2026(USD Million)
      Fig.28	China Dental Turbine Market, 2016 – 2026(USD Million)
      Fig.29	Japan Dental Turbine Market, 2016 – 2026(USD Million)
      Fig.30	India Dental Turbine Market, 2016 – 2026(USD Million)
      Fig.31	South  Korea Dental Turbine Market, 2016 – 2026(USD Million)
      Fig.32	South-East Asia Dental Turbine Market, 2016 – 2026(USD Million)
      Fig.33	Rest of Asia Pacific Dental Turbine Market, 2016 – 2026(USD Million)
      Fig.34	Latin America Dental Turbine Market, 2016 – 2026(USD Million)
      Fig.35	Brazil Dental Turbine Market, 2016 – 2026(USD Million)
      Fig.36	Mexico Dental Turbine Market, 2016 – 2026(USD Million)
      Fig.37	Rest of Latin America Dental Turbine Market, 2016 – 2026(USD Million)
      Fig.38	The Middle-East and Africa Dental Turbine Market, 2016 – 2026(USD Million)
      Fig.39	GCC Countries Dental Turbine Market, 2016 – 2026(USD Million)
      Fig.40	South Africa Dental Turbine Market, 2016 – 2026(USD Million)
      Fig.41	Rest of Middle-East Africa Dental Turbine Market, 2016 – 2026(USD Million)
      Fig.42	Competitor Market Share – Revenue
      Fig.43	A-dec Inc. Revenue and Growth Rate
      Fig.44	A-dec Inc. Market Share
      Fig.45	Dentflex Revenue and Growth Rate
      Fig.46	Dentflex Market Share
      Fig.47	 DentalEZ Revenue and Growth Rate
      Fig.48	 DentalEZ Market Share
      Fig.49	FONA  Dental Revenue and Growth Rate
      Fig.50	FONA  Dental Market Share
      Fig.51	W&H Group Revenue and Growth Rate
      Fig.52	W&H Group Market Share
      Fig.53	NSK Revenue and Growth Rate
      Fig.54	NSK Market Share
      Fig.55	Dentamerica Inc. Revenue and Growth Rate
      Fig.56	Dentamerica Inc. Market Share
      Fig.57	Guilin Woodpecker Medical Instrument Co. Ltd. Revenue and Growth Rate
      Fig.58	Guilin Woodpecker Medical Instrument Co. Ltd. Market Share
      Fig.59	The Turbine Source Revenue and Growth Rate
      Fig.60	The Turbine Source Market Share
      Fig.61	The Yoshida  Dental Mfg. Co. Ltd. Revenue and Growth Rate
      Fig.62	The Yoshida  Dental Mfg. Co. Ltd. Market Share
      Fig.63	KaVo  Dental Revenue and Growth Rate
      Fig.64	KaVo  Dental Market Share
      Fig.65	Cefla S.C. Revenue and Growth Rate
      Fig.66	Cefla S.C. Market Share
      Fig.67	Dentsply Sirona Inc. Revenue and Growth Rate
      Fig.68	Dentsply Sirona Inc. Market Share
      Fig.69	Market Dynamics
      Fig.70	Global  Dental Turbine – Value Chain Analysis
      Fig.71	Key Mandates and Regulations
      Fig.72	Technology Roadmap and Timeline
      Fig.73	Market Attractiveness Analysis – By Type
      Fig.74	Market Attractiveness Analysis – By Speed
      Fig.75	Market Attractiveness Analysis – By Ens-User
      Fig.76	Market Attractiveness Analysis – By Region
      Fig.77	 Dental Turbine Industrial Chain Analysis
      Fig.78	Market Channels
      Fig.79	Marketing Channel Development Trend
      Fig.80	Growth in World Gross Product, 2008-2018
      

      List of Tables

      Table 1	Global  DentalTurbine Market, 2020 & 2026(USD Million)
      Table 2	Global  DentalTurbine Market, by Type, 2016 – 2026(USD Million)
      Table 3	Global  DentalTurbine Market, by Speed, 2016 – 2026(USD Million)
      Table 4	Global  DentalTurbine Market, by Ens-User, 2016 – 2026(USD Million)
      Table 5	Global  DentalTurbine Market, by Region, 2016 – 2026(USD Million)
      Table 6	North America Dental Turbine Market, by Country, 2016 – 2026(USD Million)
      Table 7	North America Dental Turbine Market, by Type, 2016 – 2026(USD Million)
      Table 8	North America Dental Turbine Market, by Speed, 2016 – 2026(USD Million)
      Table 9	North America Dental Turbine Market, by Ens-User, 2016 – 2026(USD Million)
      Table 10 Europe Dental Turbine Market, by Country, 2016 – 2026(USD Million)
      Table 11 Europe Dental Turbine Market, by Type, 2016 – 2026(USD Million)
      Table 12 Europe Dental Turbine Market, by Speed, 2016 – 2026(USD Million)
      Table 13 Europe Dental Turbine Market, by Ens-User, 2016 – 2026(USD Million)
      Table 14 Asia Pacific Dental Turbine Market, by Country, 2016 – 2026(USD Million)
      Table 15 Asia Pacific Dental Turbine Market, by Type, 2016 – 2026(USD Million)
      Table 16 Asia Pacific Dental Turbine Market, by Speed, 2016 – 2026(USD Million)
      Table 17 Asia Pacific Dental Turbine Market, by Ens-User, 2016 – 2026(USD Million)
      Table 18 Latin America Dental Turbine Market, by Country, 2016 – 2026(USD Million)
      Table 19 Latin America Dental Turbine Market, by Type, 2016 – 2026(USD Million)
      Table 20 Latin America Dental Turbine Market, by Speed, 2016 – 2026(USD Million)
      Table 21 Latin America Dental Turbine Market, by Ens-User, 2016 – 2026(USD Million)
      Table 22 The Middle-East and Africa Dental Turbine Market, by Country, 2016 – 2026(USD Million)
      Table 23 The Middle-East and Africa Dental Turbine Market, by Type, 2016 – 2026(USD Million)
      Table 24 The Middle-East and Africa Dental Turbine Market, by Speed, 2016 – 2026(USD Million)
      Table 25 The Middle-East and Africa Dental Turbine Market, by Ens-User, 2016 – 2026(USD Million)
      Table 26 Global  Dental Turbine Market - Company Revenue Analysis, 2016 – 2019(USD Million)
      Table 27 Global  Dental Turbine Market - Company Revenue Share Analysis, 2016 – 2019(%)
      Table 28 Acquisitions and Mergers
      Table 29 Market Drivers – Impact Analysis
      Table 30 Market Restraints
      Table 31 Market Opportunities
      Table 32 Major Buyers of  Dental Turbine
      Table 33 Distributors/Traders of  Dental Turbine by Region
      

Industry Major Market Players

  • Dentflex
  • DentalEZ
  • FONA Dental
  • W&H Group
  • NSK
  • Dentamerica Inc.
  • Guilin Woodpecker Medical Instrument Co. Ltd.
  • The Turbine Source (a division of sed, Inc.)
  • The Yoshida Dental     Mfg. Co. Ltd.
  • KaVo Dental
  • Cefla S.C.
  • DentsplySirona Inc.