Search Market Research Report

Discover Our Latest Reports
Discover Our Featured Reports
Discover Top Selling Reports

[Latest] Global Cultured Meat Market Size, Share, Trend Analysis Forecast 2021-2026

report img

Cultured Meat Market By Source (Poultry, Pork, Beef, Duck, Seafood), By Application (Nuggets, Sausages, Burgers, Hot Dogs, Meatballs, and Others), By End-User (Household and Food Services), and By Distribution Channel (Hypermarkets/Supermarkets, Food and Drink Specialty Stores, Convenience Stores, Online Retail, and Others): Global & Regional Cultured Meat Industry Outlook, Market Size, Business Intelligence, Consumer Preferences, Statistical Surveys, Comprehensive Analysis, Historical Developments, Current Trends, and Forecast 2021–2026

Industry Insights

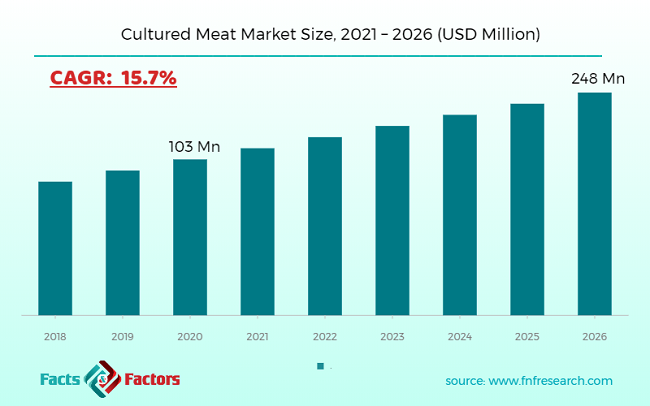
[219+ Pages Report] According to the report published by Facts and Factors, the global cultured meat market size was valued around USD 103 million in 2020 and is expected to grow to around USD 248 million by 2026 with a compound annual growth rate (CAGR) of roughly 15.7% between 2021 and 2026. The report analyzes the global cultured meat market drivers, challenges, and the impact they have on the demands during the forecast period. In addition, the report explores emerging opportunities in the cultured meat market.

Global Cultured Meat Market

To know more about this report | Request Free Sample Copy

logoMarket Overview   

Cultured meat is made from animal cells using modern techniques rather than slaughtering cattle. The cultured meat is made by extracting animal cells and cultivating them in a nutrient-rich medium. They can duplicate to such a degree that each cell can be used to provide enough meat for the entire world's population in a year. As food producers gradually approach meat replacement products, such meat is becoming a big fad in the food and beverage industry.

Although a large number of intermediate steps will be required to produce cultured meat in large quantities. With the aid of a mechanical process, the cells multiply and develop a sponge-like structure that is eventually soaked in nutrients, increasing their protein content and size. Cultured meat processing is a proposed option for feeding the world's ever-increasing population. It will also have advantages such as lower saturated fat levels, lower environmental effects, and fewer foodborne illnesses. The resulting cultured meat is expected to be seasoned, harvested, and prepared to consistency for use as any other meat commodity, including chicken, hamburgers, sausages, and even steaks or chicken breasts.

Global Cultured Meat Market

To know more about this report | Request Free Sample Copy

logoIndustry Growth Factors

The growing customer demand for cultured meat as a replacement for animal-based goods is driving the industry. Concerns over animal cruelty in meat processing have had a major effect on public attitudes toward meat consumption. However, fulfilling everyday protein requirements and the flavor of meat products are important considerations when using animal-based meat substitutes. This is shaping up to be a win-win situation for the cultured meat industry. Furthermore, as technology advances, cultured meat production is expected to increase in the future.

The increased use of meat products in developing regions such as Europe and North America is one of the driving forces for the cultured meat demand in these regions. High prices and a lack of understanding, on the other hand, are the main factors limiting the development of the cultured meat industry. Since the demand for meat alternatives is increasing, especially in developing countries, cultured meat producers are gaining a competitive advantage in the market. Cultured meat is one of the most important research efforts in the last decade, and it is about to hit the market with greater promise. This is further enhancing the global cultured meat demand's favorable market scenario.

logo Covid 19 Analysis

The global pandemic of COVID-19 disease is wreaking havoc on the food and beverage market, with prices of big food and beverage products predicted to suffer. Cultured meat is a rapidly growing segment in the food and beverage industry, and it is primarily processed using a microbiological method. Due to disease, processing and research and development activity has been halted, which may have an effect on the future of cultured meat. Furthermore, after the coronavirus disease epidemic has ended, customer food demand and lifestyle will have a significant effect, which would be a significant factor in the demand for cultured meat. As a result, the COVID-19 disease pandemic will have a mild to strong effect on the cultured meat industry.

logoSegmentation Analysis

The global cultured meat market is segregated based on source, application, end-user, distribution channel, and region

As a popular frozen meat commodity, nuggets are becoming increasingly popular. Nuggets are one of the most popular ways that chicken meat is eaten in different countries. Consumers are searching for choices that are easy to eat at any moment, thanks to the growing popularity of on-the-go lifestyles and snacking items, especially in the United States and other developed countries. As a result, major corporations such as Tyson Foods and Cargill are concentrating their efforts on introducing clean meat or cultured meat chicken nuggets to appeal to customers. As a result, during the forecast era, the North American region is expected to dominate the demand for cultured meat nuggets.

According to the source, the poultry segment is predicted to dominate the global cultured meat market during the forecast period. This is due to the prevalence of poultry products in numerous quick-service restaurants (QSRs), which has prompted producers to create innovative alternative products to satisfy potential meat market demand. Cultured chicken goods are projected to be less expensive than other suppliers and to achieve widespread acceptance around the world. Furthermore, as the market for animal protein rises, so does the demand for poultry products.

The global demand for cultured meat is projected to rise much more as a result of this. Furthermore, increasing demand for chicken meat is projected to sustain the global cultured meat industry, owing to the rapidly increased urban population in developing countries.

logoReport Scope

Report Attribute

Details

Market Size in 2020

USD 103 Million

Projected Market Size in 2026

USD 248 Million

CAGR Growth Rate

15.7% CAGR

Base Year

2020

Forecast Years

2021-2026

Key Market Players

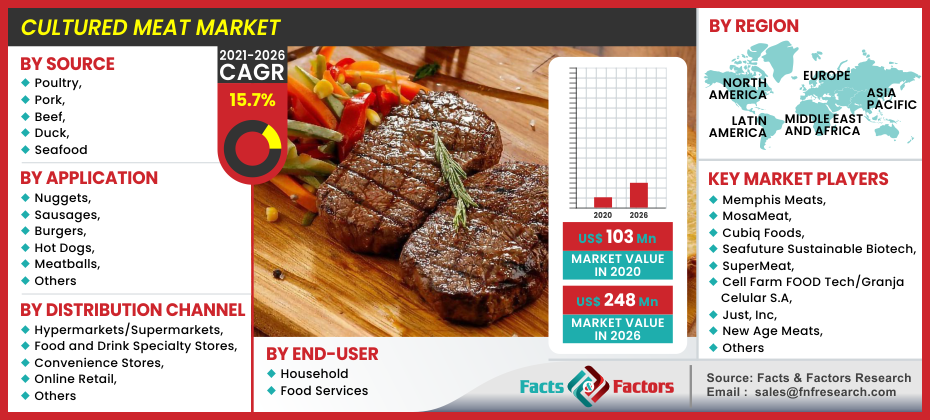
Memphis Meats, MosaMeat, Cubiq Foods, Seafuture Sustainable Biotech, SuperMeat, Cell Farm FOOD Tech/Granja Celular S.A, Just Inc, New Age Meats, Fork & Goode, Integriculture, Lab farm Foods, Aleph Farms Ltd, Finless Foods Inc., Meatable, Avant Meats Company Limited, Shiok Meats, Balletic Foods, Bluenalu Inc., Mission Barns, Appleton Meats, Kiran Meats, Future Meat Technologies Ltd, Higher Steaks, Wild Type, Biofood Systems LTD, and Others

Key Segment

By Source, Application, End-User, Distribution Channel, and Region

Major Regions Covered

North America, Europe, Asia Pacific, Latin America, and the Middle East & Africa

Purchase Options

Request customized purchase options to meet your research needs. Explore purchase options

logo Regional Analysis

North America is expected to dominate the industry in 2021, with the highest market share in cultured meat. The larger share is projected to be driven by an increase in technologies and inventions, as well as increased investment in productive R&D. The shifting consumer preference towards cultured meat products owing to health issues regarding meat intake, a rise in investor interest in alternative proteins, and the ability to provide the necessary nutrients in tailor-made proteins.

Metropolitan areas in the United States and Canada are projected to lead development due to a larger number of flexitarians that are receptive to and embrace meat alternatives and alternate proteins. Increased investment in cultured meat firms is supported by increasing demand for substitute protein in the field.

The region of Asia-Pacific also holds the maximum share in the cultured meat market, and it is predicted to continue to do so over the forecast period. Market surveys on cultured meat have been described as being particularly common in India and China. This can be due to rising economies as well as rising population, resulting in increased meat intake and market affordability for premium food products.

The Singapore Food Agency, for example, had given Eat Just, a start-up company in the US, permission to market its lab-grown, cultured chicken as a food ingredient in Singapore. The cultured chicken was served in a single restaurant at first, with a gradual expansion to 15 restaurants expected in the immediate future. The brand also intended to expand into supermarkets in the future.

logoSome of the leading players in the global market include 

  • Memphis Meats
  • MosaMeat
  • Cubiq Foods
  • Seafuture Sustainable Biotech
  • SuperMeat
  • Cell Farm FOOD Tech/Granja Celular S.A
  • Just Inc
  • New Age Meats
  • Integriculture
  • Lab farm Foods
  • Aleph Farms Ltd
  • Fork & Goode
  • Finless Foods Inc.
  • Meatable
  • Avant Meats Company Limited
  • Shiok Meats
  • Balletic Foods
  • Bluenalu Inc.
  • Future Meat Technologies Ltd
  • Mission Barns
  • Appleton Meats
  • Kiran Meats
  • Higher Steaks
  • Wild Type
  • Biofood Systems LTD
  • others

The global cultured meat market is segmented as follows:

logoBy Source Analysis

  • Poultry
  • Pork
  • Beef
  • Duck
  • Seafood

logoBy Application Analysis

  • Nuggets
  • Sausages
  • Burgers
  • Hot Dogs
  • Meatballs
  • Others

logoBy End-User Analysis

  • Household
  • Food Services

logoBy Distribution Channel Analysis

  • Hypermarkets/Supermarkets
  • Food and Drink Specialty Stores
  • Convenience Stores
  • Online Retail
  • Others

logoBy Regional Segment Analysis

  • North America
    • U.S.
    • Canada
  • Europe
    • UK
    • France
    • Germany
    • Italy
    • Spain
    • Rest of Europe
  • Asia Pacific
    • China
    • Japan
    • India
    • South Korea
    • Southeast Asia
    • Rest of Asia Pacific
  • Latin America
    • Brazil
    • Mexico
    • Rest of Latin America
  • Middle East and Africa
    • GCC Countries
    • South Africa
    • Rest of MEA

Table of Content

  1. Chapter 1 Executive Summary
    1. 1.1. Introduction of Cultured Meat
    2. 1.2. Global Cultured Meat Market, 2020 & 2026 (USD Million)
    3. 1.3. Global Cultured Meat Market, 2016 – 2026 (USD Million) (Kilo Tons)
    4. 1.4. Global Cultured Meat Market Absolute Revenue Opportunity, 2016 – 2026 (USD Million)
    5. 1.5. Global Cultured Meat Market Incremental Revenue Opportunity, 2020 – 2026 (USD Million)
  2. Chapter 2 Cultured Meat Market – Source Analysis
    1. 2.1. Global Cultured Meat Market – Source Overview
    2. 2.2. Global Cultured Meat Market Share, by Source, 2020 & 2026 (USD Million)
    3. 2.3. Global Cultured Meat Market share, by Source, 2020 & 2026 (Kilo Tons)
    4. 2.4. Poultry
      1. 2.4.1. Global Poultry Cultured Meat Market, 2016 – 2026 (USD Million)
      2. 2.4.2. Global Poultry Cultured Meat Market, 2016 – 2026 (Kilo Tons)
    5. 2.5. Pork
      1. 2.5.1. Global Pork Cultured Meat Market, 2016 – 2026 (USD Million)
      2. 2.5.2. Global Pork Cultured Meat Market, 2016 – 2026 (Kilo Tons)
    6. 2.6. Beef
      1. 2.6.1. Global Beef Cultured Meat Market, 2016 – 2026 (USD Million)
      2. 2.6.2. Global Beef Cultured Meat Market, 2016 – 2026 (Kilo Tons)
    7. 2.7. Duck
      1. 2.7.1. Global Duck Cultured Meat Market, 2016 – 2026 (USD Million)
      2. 2.7.2. Global Duck Cultured Meat Market, 2016 – 2026 (Kilo Tons)
    8. 2.8. Seafood
      1. 2.8.1. Global Seafood Cultured Meat Market, 2016 – 2026 (USD Million)
      2. 2.8.2. Global Seafood Cultured Meat Market, 2016 – 2026 (Kilo Tons)
  3. Chapter 3 Cultured Meat Market – Application Analysis
    1. 3.1. Global Cultured Meat Market – Application Overview
    2. 3.2. Global Cultured Meat Market Share, by Application, 2020 & 2026 (USD Million)
    3. 3.3. Global Cultured Meat Market share, by Application, 2020 & 2026 (Kilo Tons)
    4. 3.4. Nuggets
      1. 3.4.1. Global Nuggets Cultured Meat Market, 2016 – 2026 (USD Million)
      2. 3.4.2. Global Nuggets Cultured Meat Market, 2016 – 2026 (Kilo Tons)
    5. 3.5. Sausages
      1. 3.5.1. Global Sausages Cultured Meat Market, 2016 – 2026 (USD Million)
      2. 3.5.2. Global Sausages Cultured Meat Market, 2016 – 2026 (Kilo Tons)
    6. 3.6. Burgers
      1. 3.6.1. Global Burgers Cultured Meat Market, 2016 – 2026 (USD Million)
      2. 3.6.2. Global Burgers Cultured Meat Market, 2016 – 2026 (Kilo Tons)
    7. 3.7. Hot Dogs
      1. 3.7.1. Global Hot Dogs Cultured Meat Market, 2016 – 2026 (USD Million)
      2. 3.7.2. Global Hot Dogs Cultured Meat Market, 2016 – 2026 (Kilo Tons)
    8. 3.8. Meatballs
      1. 3.8.1. Global Meatballs Cultured Meat Market, 2016 – 2026 (USD Million)
      2. 3.8.2. Global Meatballs Cultured Meat Market, 2016 – 2026 (Kilo Tons)
    9. 3.9. Others
      1. 3.9.1. Global Others Cultured Meat Market, 2016 – 2026 (USD Million)
      2. 3.9.2. Global Others Cultured Meat Market, 2016 – 2026 (Kilo Tons)
  4. Chapter 4 Cultured Meat Market – End-User Analysis
    1. 4.1. Global Cultured Meat Market – End-User Overview
    2. 4.2. Global Cultured Meat Market Share, by End-User, 2020 & 2026 (USD Million)
    3. 4.3. Global Cultured Meat Market share, by End-User, 2020 & 2026 (Kilo Tons)
    4. 4.4. Household
      1. 4.4.1. Global Household Cultured Meat Market, 2016 – 2026 (USD Million)
      2. 4.4.2. Global Household Cultured Meat Market, 2016 – 2026 (Kilo Tons)
    5. 4.5. Food Services
      1. 4.5.1. Global Food Services Cultured Meat Market, 2016 – 2026 (USD Million)
      2. 4.5.2. Global Food Services Cultured Meat Market, 2016 – 2026 (Kilo Tons)
  5. Chapter 5 Cultured Meat Market – Distribution Channel Analysis
    1. 5.1. Global Cultured Meat Market – Distribution Channel Overview
    2. 5.2. Global Cultured Meat Market Share, by Distribution Channel, 2020 & 2026 (USD Million)
    3. 5.3. Global Cultured Meat Market share, by Distribution Channel, 2020 & 2026 (Kilo Tons)
    4. 5.4. Hypermarkets/Supermarkets
      1. 5.4.1. Global Hypermarkets/Supermarkets Cultured Meat Market, 2016 – 2026 (USD Million)
      2. 5.4.2. Global Hypermarkets/Supermarkets Cultured Meat Market, 2016 – 2026 (Kilo Tons)
    5. 5.5. Food and Drink Specialty Stores
      1. 5.5.1. Global Food and Drink Specialty Stores Cultured Meat Market, 2016 – 2026 (USD Million)
      2. 5.5.2. Global Food and Drink Specialty Stores Cultured Meat Market, 2016 – 2026 (Kilo Tons)
    6. 5.6. Convenience Stores
      1. 5.6.1. Global Convenience Stores Cultured Meat Market, 2016 – 2026 (USD Million)
      2. 5.6.2. Global Convenience Stores Cultured Meat Market, 2016 – 2026 (Kilo Tons)
    7. 5.7. Online Retail
      1. 5.7.1. Global Online Retail Cultured Meat Market, 2016 – 2026 (USD Million)
      2. 5.7.2. Global Online Retail Cultured Meat Market, 2016 – 2026 (Kilo Tons)
    8. 5.8. Others
      1. 5.8.1. Global Others Cultured Meat Market, 2016 – 2026 (USD Million)
      2. 5.8.2. Global Others Cultured Meat Market, 2016 – 2026 (Kilo Tons)
  6. Chapter 6 Cultured Meat Market – Regional Analysis
    1. 6.1. Global Cultured Meat Market Regional Overview
    2. 6.2. Global Cultured Meat Market Share, by Region, 2020 & 2026 (USD Million)
    3. 6.3. Global Cultured Meat Market Share, by Region, 2020 & 2026 (Kilo Tons)
    4. 6.4. North America
      1. 6.4.1. North America Cultured Meat Market, 2016 – 2026 (USD Million)
        1. 6.4.1.1. North America Cultured Meat Market, by Country, 2016 – 2026 (USD Million)
      2. 6.4.2. North America Market, 2016 – 2026 (Kilo Tons)
        1. 6.4.2.1. North America Cultured Meat Market, by Country, 2016 – 2026 (Kilo Tons)
      3. 6.4.3. North America Cultured Meat Market, by Source, 2016 – 2026
        1. 6.4.3.1. North America Cultured Meat Market, by Source, 2016 – 2026 (USD Million)
        2. 6.4.3.2. North America Cultured Meat Market, by Source, 2016 – 2026 (Kilo Tons)
      4. 6.4.4. North America Cultured Meat Market, by Application, 2016 – 2026
        1. 6.4.4.1. North America Cultured Meat Market, by Application, 2016 – 2026 (USD Million)
        2. 6.4.4.2. North America Cultured Meat Market, by Application, 2016 – 2026 (Kilo Tons)
      5. 6.4.5. North America Cultured Meat Market, by End-User, 2016 – 2026
        1. 6.4.5.1. North America Cultured Meat Market, by End-User, 2016 – 2026 (USD Million)
        2. 6.4.5.2. North America Cultured Meat Market, by End-User, 2016 – 2026 (Kilo Tons)
      6. 6.4.6. North America Cultured Meat Market, by Distribution Channel, 2016 – 2026
        1. 6.4.6.1. North America Cultured Meat Market, by Distribution Channel, 2016 – 2026 (USD Million)
        2. 6.4.6.2. North America Cultured Meat Market, by Distribution Channel, 2016 – 2026 (Kilo Tons)
      7. 6.4.7. U.S.
        1. 6.4.7.1. U.S. Cultured Meat Market, 2016 – 2026 (USD Million)
        2. 6.4.7.2. U.S. Cultured Meat Market, 2016 – 2026 (Kilo Tons)
      8. 6.4.8. Canada
        1. 6.4.8.1. Canada Cultured Meat Market, 2016 – 2026 (USD Million)
        2. 6.4.8.2. Canada Cultured Meat Market, 2016 – 2026 (Kilo Tons)
    5. 6.5. Europe
      1. 6.5.1. Europe Cultured Meat Market, 2016 – 2026 (USD Million)
        1. 6.5.1.1. Europe Cultured Meat Market, by Country, 2016 – 2026 (USD Million)
      2. 6.5.2. Europe Market, 2016 – 2026 (Kilo Tons)
        1. 6.5.2.1. Europe Cultured Meat Market, by Country, 2016 – 2026 (Kilo Tons)
      3. 6.5.3. Europe Cultured Meat Market, by Source, 2016 – 2026
        1. 6.5.3.1. Europe Cultured Meat Market, by Source, 2016 – 2026 (USD Million)
        2. 6.5.3.2. Europe Cultured Meat Market, by Source, 2016 – 2026 (Kilo Tons)
      4. 6.5.4. Europe Cultured Meat Market, by Application, 2016 – 2026
        1. 6.5.4.1. Europe Cultured Meat Market, by Application, 2016 – 2026 (USD Million)
        2. 6.5.4.2. Europe Cultured Meat Market, by Application, 2016 – 2026 (Kilo Tons)
      5. 6.5.5. Europe Cultured Meat Market, by End-User, 2016 – 2026
        1. 6.5.5.1. Europe Cultured Meat Market, by End-User, 2016 – 2026 (USD Million)
        2. 6.5.5.2. Europe Cultured Meat Market, by End-User, 2016 – 2026 (Kilo Tons)
      6. 6.5.6. Europe Cultured Meat Market, by Distribution Channel, 2016 – 2026
        1. 6.5.6.1. Europe Cultured Meat Market, by Distribution Channel, 2016 – 2026 (USD Million)
        2. 6.5.6.2. Europe Cultured Meat Market, by Distribution Channel, 2016 – 2026 (Kilo Tons)
      7. 6.5.7. Germany
        1. 6.5.7.1. Germany Cultured Meat Market, 2016 – 2026 (USD Million)
        2. 6.5.7.2. Germany Cultured Meat Market, 2016 – 2026 (Kilo Tons)
      8. 6.5.8. France
        1. 6.5.8.1. France Cultured Meat Market, 2016 – 2026 (USD Million)
        2. 6.5.8.2. France Cultured Meat Market, 2016 – 2026 (Kilo Tons)
      9. 6.5.9. U.K.
        1. 6.5.9.1. U.K. Cultured Meat Market, 2016 – 2026 (USD Million)
        2. 6.5.9.2. U.K. Cultured Meat Market, 2016 – 2026 (Kilo Tons)
      10. 6.5.10. Italy
        1. 6.5.10.1. Italy Cultured Meat Market, 2016 – 2026 (USD Million)
        2. 6.5.10.2. Italy Cultured Meat Market, 2016 – 2026 (Kilo Tons)
      11. 6.5.11. Spain
        1. 6.5.11.1. Spain Cultured Meat Market, 2016 – 2026 (USD Million)
        2. 6.5.11.2. Spain Cultured Meat Market, 2016 – 2026 (Kilo Tons)
      12. 6.5.12. Rest of Europe
        1. 6.5.12.1. Rest of Europe Cultured Meat Market, 2016 – 2026 (USD Million)
        2. 6.5.12.2. Rest of Europe Cultured Meat Market, 2016 – 2026 (Kilo Tons)
    6. 6.6. Asia Pacific
      1. 6.6.1. Asia Pacific Cultured Meat Market, 2016 – 2026 (USD Million)
        1. 6.6.1.1. Asia Pacific Cultured Meat Market, by Country, 2016 – 2026 (USD Million)
      2. 6.6.2. Asia Pacific Market, 2016 – 2026 (Kilo Tons)
        1. 6.6.2.1. Asia Pacific Cultured Meat Market, by Country, 2016 – 2026 (Kilo Tons)
      3. 6.6.3. Asia Pacific Cultured Meat Market, by Source, 2016 – 2026
        1. 6.6.3.1. Asia Pacific Cultured Meat Market, by Source, 2016 – 2026 (USD Million)
        2. 6.6.3.2. Asia Pacific Cultured Meat Market, by Source, 2016 – 2026 (Kilo Tons)
      4. 6.6.4. Asia Pacific Cultured Meat Market, by Application, 2016 – 2026
        1. 6.6.4.1. Asia Pacific Cultured Meat Market, by Application, 2016 – 2026 (USD Million)
        2. 6.6.4.2. Asia Pacific Cultured Meat Market, by Application, 2016 – 2026 (Kilo Tons)
      5. 6.6.5. Asia Pacific Cultured Meat Market, by End-User, 2016 – 2026
        1. 6.6.5.1. Asia Pacific Cultured Meat Market, by End-User, 2016 – 2026 (USD Million)
        2. 6.6.5.2. Asia Pacific Cultured Meat Market, by End-User, 2016 – 2026 (Kilo Tons)
      6. 6.6.6. Asia Pacific Cultured Meat Market, by Distribution Channel, 2016 – 2026
        1. 6.6.6.1. Asia Pacific Cultured Meat Market, by Distribution Channel, 2016 – 2026 (USD Million)
        2. 6.6.6.2. Asia Pacific Cultured Meat Market, by Distribution Channel, 2016 – 2026 (Kilo Tons)
      7. 6.6.7. China
        1. 6.6.7.1. China Cultured Meat Market, 2016 – 2026 (USD Million)
        2. 6.6.7.2. China Cultured Meat Market, 2016 – 2026 (Kilo Tons)
      8. 6.6.8. Japan
        1. 6.6.8.1. Japan Cultured Meat Market, 2016 – 2026 (USD Million)
        2. 6.6.8.2. Japan Cultured Meat Market, 2016 – 2026 (Kilo Tons)
      9. 6.6.9. India
        1. 6.6.9.1. India Cultured Meat Market, 2016 – 2026 (USD Million)
        2. 6.6.9.2. India Cultured Meat Market, 2016 – 2026 (Kilo Tons)
      10. 6.6.10. South Korea
        1. 6.6.10.1. South Korea Cultured Meat Market, 2016 – 2026 (USD Million)
        2. 6.6.10.2. South Korea Cultured Meat Market, 2016 – 2026 (Kilo Tons)
      11. 6.6.11. South-East Asia
        1. 6.6.11.1. South-East Asia Cultured Meat Market, 2016 – 2026 (USD Million)
        2. 6.6.11.2. South-East Asia Cultured Meat Market, 2016 – 2026 (Kilo Tons)
      12. 6.6.12. Rest of Asia Pacific
        1. 6.6.12.1. Rest of Asia Pacific Cultured Meat Market, 2016 – 2026 (USD Million)
        2. 6.6.12.2. Rest of Asia Pacific Cultured Meat Market, 2016 – 2026 (Kilo Tons)
    7. 6.7. Latin America
      1. 6.7.1. Latin America Cultured Meat Market, 2016 – 2026 (USD Million)
        1. 6.7.1.1. Latin America Cultured Meat Market, by Country, 2016 – 2026 (USD Million)
      2. 6.7.2. Latin America Market, 2016 – 2026 (Kilo Tons)
        1. 6.7.2.1. Latin America Cultured Meat Market, by Country, 2016 – 2026 (Kilo Tons)
      3. 6.7.3. Latin America Cultured Meat Market, by Source, 2016 – 2026
        1. 6.7.3.1. Latin America Cultured Meat Market, by Source, 2016 – 2026 (USD Million)
        2. 6.7.3.2. Latin America Cultured Meat Market, by Source, 2016 – 2026 (Kilo Tons)
      4. 6.7.4. Latin America Cultured Meat Market, by Application, 2016 – 2026
        1. 6.7.4.1. Latin America Cultured Meat Market, by Application, 2016 – 2026 (USD Million)
        2. 6.7.4.2. Latin America Cultured Meat Market, by Application, 2016 – 2026 (Kilo Tons)
      5. 6.7.5. Latin America Cultured Meat Market, by End-User, 2016 – 2026
        1. 6.7.5.1. Latin America Cultured Meat Market, by End-User, 2016 – 2026 (USD Million)
        2. 6.7.5.2. Latin America Cultured Meat Market, by End-User, 2016 – 2026 (Kilo Tons)
      6. 6.7.6. Latin America Cultured Meat Market, by Distribution Channel, 2016 – 2026
        1. 6.7.6.1. Latin America Cultured Meat Market, by Distribution Channel, 2016 – 2026 (USD Million)
        2. 6.7.6.2. Latin America Cultured Meat Market, by Distribution Channel, 2016 – 2026 (Kilo Tons)
      7. 6.7.7. Brazil
        1. 6.7.7.1. Brazil Cultured Meat Market, 2016 – 2026 (USD Million)
        2. 6.7.7.2. Brazil Cultured Meat Market, 2016 – 2026 (Kilo Tons)
      8. 6.7.8. Mexico
        1. 6.7.8.1. Mexico Cultured Meat Market, 2016 – 2026 (USD Million)
        2. 6.7.8.2. Mexico Cultured Meat Market, 2016 – 2026 (Kilo Tons)
      9. 6.7.9. Rest of Latin America
        1. 6.7.9.1. Rest of Latin America Cultured Meat Market, 2016 – 2026 (USD Million)
        2. 6.7.9.2. Rest of Latin America Cultured Meat Market, 2016 – 2026 (Kilo Tons)
    8. 6.8. The Middle-East and Africa
      1. 6.8.1. The Middle-East and Africa Cultured Meat Market, 2016 – 2026 (USD Million)
        1. 6.8.1.1. The Middle-East and Africa Cultured Meat Market, by Country, 2016 – 2026 (USD Million)
      2. 6.8.2. The Middle-East and Africa Market, 2016 – 2026 (Kilo Tons)
        1. 6.8.2.1. The Middle-East and Africa Cultured Meat Market, by Country, 2016 – 2026 (Kilo Tons)
      3. 6.8.3. The Middle-East and Africa Cultured Meat Market, by Source, 2016 – 2026
        1. 6.8.3.1. The Middle-East and Africa Cultured Meat Market, by Source, 2016 – 2026 (USD Million)
        2. 6.8.3.2. The Middle-East and Africa Cultured Meat Market, by Source, 2016 – 2026 (Kilo Tons)
      4. 6.8.4. The Middle-East and Africa Cultured Meat Market, by Application, 2016 – 2026
        1. 6.8.4.1. The Middle-East and Africa Cultured Meat Market, by Application, 2016 – 2026 (USD Million)
        2. 6.8.4.2. The Middle-East and Africa Cultured Meat Market, by Application, 2016 – 2026 (Kilo Tons)
      5. 6.8.5. The Middle-East and Africa Cultured Meat Market, by End-User, 2016 – 2026
        1. 6.8.5.1. The Middle-East and Africa Cultured Meat Market, by End-User, 2016 – 2026 (USD Million)
        2. 6.8.5.2. The Middle-East and Africa Cultured Meat Market, by End-User, 2016 – 2026 (Kilo Tons)
      6. 6.8.6. The Middle-East and Africa Cultured Meat Market, by Distribution Channel, 2016 – 2026
        1. 6.8.6.1. The Middle-East and Africa Cultured Meat Market, by Distribution Channel, 2016 – 2026 (USD Million)
        2. 6.8.6.2. The Middle-East and Africa Cultured Meat Market, by Distribution Channel, 2016 – 2026 (Kilo Tons)
      7. 6.8.7. GCC Countries
        1. 6.8.7.1. GCC Countries Cultured Meat Market, 2016 – 2026 (USD Million)
        2. 6.8.7.2. GCC Countries Cultured Meat Market, 2016 – 2026 (Kilo Tons)
      8. 6.8.8. South Africa
        1. 6.8.8.1. South Africa Cultured Meat Market, 2016 – 2026 (USD Million)
        2. 6.8.8.2. South Africa Cultured Meat Market, 2016 – 2026 (Kilo Tons)
      9. 6.8.9. Rest of Middle-East Africa
        1. 6.8.9.1. Rest of Middle-East Africa Cultured Meat Market, 2016 – 2026 (USD Million)
        2. 6.8.9.2. Rest of Middle-East Africa Cultured Meat Market, 2016 – 2026 (Kilo Tons)
  7. Chapter 7 Cultured Meat Production, Consumption, Export, Import by Regions
    1. 7.1. Global Cultured Meat Production and Consumption, 2016 – 2026 (Kilo Tons)
    2. 7.2. Global Import and Export Analysis, by Region
  8. Chapter 8 Cultured Meat Market – Competitive Landscape
    1. 8.1. Competitor Market Share – Revenue
    2. 8.2. Market Concentration Rate Analysis, Top 3 and Top 5 Players
    3. 8.3. Competitor Market Share – Volume
    4. 8.4. Strategic Developments
      1. 8.4.1. Acquisitions and Mergers
      2. 8.4.2. New Products
      3. 8.4.3. Research & Development Activities
  9. Chapter 9 Company Profiles
    1. 9.1. Memphis Meats
      1. 9.1.1. Company Overview
      2. 9.1.2. Product/Service Portfolio
      3. 9.1.3. Memphis Meats Sales, Revenue, Price, and Gross Margin
      4. 9.1.4. Memphis Meats Revenue and Growth Rate
      5. 9.1.5. Memphis Meats Market Share
      6. 9.1.6. Recent Initiatives, Funding/VC Activities, and Technological Innovations
    2. 9.2. MosaMeat
      1. 9.2.1. Company Overview
      2. 9.2.2. Product/Service Portfolio
      3. 9.2.3. MosaMeat Sales, Revenue, Price, and Gross Margin
      4. 9.2.4. MosaMeat Revenue and Growth Rate
      5. 9.2.5. MosaMeat Market Share
      6. 9.2.6. Recent Initiatives, Funding/VC Activities, and Technological Innovations
    3. 9.3. Cubiq Foods
      1. 9.3.1. Company Overview
      2. 9.3.2. Product/Service Portfolio
      3. 9.3.3. Cubiq Foods Sales, Revenue, Price, and Gross Margin
      4. 9.3.4. Cubiq Foods Revenue and Growth Rate
      5. 9.3.5. Cubiq Foods Market Share
      6. 9.3.6. Recent Initiatives, Funding/VC Activities, and Technological Innovations
    4. 9.4. Seafuture Sustainable Biotech
      1. 9.4.1. Company Overview
      2. 9.4.2. Product/Service Portfolio
      3. 9.4.3. Seafuture Sustainable Biotech Sales, Revenue, Price, and Gross Margin
      4. 9.4.4. Seafuture Sustainable Biotech Revenue and Growth Rate
      5. 9.4.5. Seafuture Sustainable Biotech Market Share
      6. 9.4.6. Recent Initiatives, Funding/VC Activities, and Technological Innovations
    5. 9.5. SuperMeat
      1. 9.5.1. Company Overview
      2. 9.5.2. Product/Service Portfolio
      3. 9.5.3. SuperMeat Sales, Revenue, Price, and Gross Margin
      4. 9.5.4. SuperMeat Revenue and Growth Rate
      5. 9.5.5. SuperMeat Market Share
      6. 9.5.6. Recent Initiatives, Funding/VC Activities, and Technological Innovations
    6. 9.6. Cell Farm FOOD Tech/Granja Celular S.A
      1. 9.6.1. Company Overview
      2. 9.6.2. Product/Service Portfolio
      3. 9.6.3. Cell Farm FOOD Tech/Granja Celular S.A Sales, Revenue, Price, and Gross Margin
      4. 9.6.4. Cell Farm FOOD Tech/Granja Celular S.A Revenue and Growth Rate
      5. 9.6.5. Cell Farm FOOD Tech/Granja Celular S.A Market Share
      6. 9.6.6. Recent Initiatives, Funding/VC Activities, and Technological Innovations
    7. 9.7. Just, Inc
      1. 9.7.1. Company Overview
      2. 9.7.2. Product/Service Portfolio
      3. 9.7.3. Just, Inc Sales, Revenue, Price, and Gross Margin
      4. 9.7.4. Just, Inc Revenue and Growth Rate
      5. 9.7.5. Just, Inc Market Share
      6. 9.7.6. Recent Initiatives, Funding/VC Activities, and Technological Innovations
    8. 9.8. New Age Meats
      1. 9.8.1. Company Overview
      2. 9.8.2. Product/Service Portfolio
      3. 9.8.3. New Age Meats Sales, Revenue, Price, and Gross Margin
      4. 9.8.4. New Age Meats Revenue and Growth Rate
      5. 9.8.5. New Age Meats Market Share
      6. 9.8.6. Recent Initiatives, Funding/VC Activities, and Technological Innovations
    9. 9.9. Integriculture
      1. 9.9.1. Company Overview
      2. 9.9.2. Product/Service Portfolio
      3. 9.9.3. Integriculture Sales, Revenue, Price, and Gross Margin
      4. 9.9.4. Integriculture Revenue and Growth Rate
      5. 9.9.5. Integriculture Market Share
      6. 9.9.6. Recent Initiatives, Funding/VC Activities, and Technological Innovations
    10. 9.10. Lab farm Foods
      1. 9.10.1. Company Overview
      2. 9.10.2. Product/Service Portfolio
      3. 9.10.3. Lab farm Foods Sales, Revenue, Price, and Gross Margin
      4. 9.10.4. Lab farm Foods Revenue and Growth Rate
      5. 9.10.5. Lab farm Foods Market Share
      6. 9.10.6. Recent Initiatives, Funding/VC Activities, and Technological Innovations
    11. 9.11. Aleph Farms Ltd
      1. 9.11.1. Company Overview
      2. 9.11.2. Product/Service Portfolio
      3. 9.11.3. Aleph Farms Ltd Sales, Revenue, Price, and Gross Margin
      4. 9.11.4. Aleph Farms Ltd Revenue and Growth Rate
      5. 9.11.5. Aleph Farms Ltd Market Share
      6. 9.11.6. Recent Initiatives, Funding/VC Activities, and Technological Innovations
    12. 9.12. Fork & Goode
      1. 9.12.1. Company Overview
      2. 9.12.2. Product/Service Portfolio
      3. 9.12.3. Fork & Goode Sales, Revenue, Price, and Gross Margin
      4. 9.12.4. Fork & Goode Revenue and Growth Rate
      5. 9.12.5. Fork & Goode Market Share
      6. 9.12.6. Recent Initiatives, Funding/VC Activities, and Technological Innovations
    13. 9.13. Finless Foods Inc.
      1. 9.13.1. Company Overview
      2. 9.13.2. Product/Service Portfolio
      3. 9.13.3. Finless Foods Inc. Sales, Revenue, Price, and Gross Margin
      4. 9.13.4. Finless Foods Inc. Revenue and Growth Rate
      5. 9.13.5. Finless Foods Inc. Market Share
      6. 9.13.6. Recent Initiatives, Funding/VC Activities, and Technological Innovations
    14. 9.14. Meatable
      1. 9.14.1. Company Overview
      2. 9.14.2. Product/Service Portfolio
      3. 9.14.3. Meatable Sales, Revenue, Price, and Gross Margin
      4. 9.14.4. Meatable Revenue and Growth Rate
      5. 9.14.5. Meatable Market Share
      6. 9.14.6. Recent Initiatives, Funding/VC Activities, and Technological Innovations
    15. 9.15. Avant Meats Company Limited
      1. 9.15.1. Company Overview
      2. 9.15.2. Product/Service Portfolio
      3. 9.15.3. Avant Meats Company Limited Sales, Revenue, Price, and Gross Margin
      4. 9.15.4. Avant Meats Company Limited Revenue and Growth Rate
      5. 9.15.5. Avant Meats Company Limited Market Share
      6. 9.15.6. Recent Initiatives, Funding/VC Activities, and Technological Innovations
    16. 9.16. Shiok Meats
      1. 9.16.1. Company Overview
      2. 9.16.2. Product/Service Portfolio
      3. 9.16.3. Shiok Meats Sales, Revenue, Price, and Gross Margin
      4. 9.16.4. Shiok Meats Revenue and Growth Rate
      5. 9.16.5. Shiok Meats Market Share
      6. 9.16.6. Recent Initiatives, Funding/VC Activities, and Technological Innovations
    17. 9.17. Balletic Foods
      1. 9.17.1. Company Overview
      2. 9.17.2. Product/Service Portfolio
      3. 9.17.3. Balletic Foods Sales, Revenue, Price, and Gross Margin
      4. 9.17.4. Balletic Foods Revenue and Growth Rate
      5. 9.17.5. Balletic Foods Market Share
      6. 9.17.6. Recent Initiatives, Funding/VC Activities, and Technological Innovations
    18. 9.18. Bluenalu, Inc.
      1. 9.18.1. Company Overview
      2. 9.18.2. Product/Service Portfolio
      3. 9.18.3. Bluenalu, Inc. Sales, Revenue, Price, and Gross Margin
      4. 9.18.4. Bluenalu, Inc. Revenue and Growth Rate
      5. 9.18.5. Bluenalu, Inc. Market Share
      6. 9.18.6. Recent Initiatives, Funding/VC Activities, and Technological Innovations
    19. 9.19. Future Meat Technologies Ltd
      1. 9.19.1. Company Overview
      2. 9.19.2. Product/Service Portfolio
      3. 9.19.3. Future Meat Technologies Ltd Sales, Revenue, Price, and Gross Margin
      4. 9.19.4. Future Meat Technologies Ltd Revenue and Growth Rate
      5. 9.19.5. Future Meat Technologies Ltd Market Share
      6. 9.19.6. Recent Initiatives, Funding/VC Activities, and Technological Innovations
    20. 9.20. Mission Barns
      1. 9.20.1. Company Overview
      2. 9.20.2. Product/Service Portfolio
      3. 9.20.3. Mission Barns Sales, Revenue, Price, and Gross Margin
      4. 9.20.4. Mission Barns Revenue and Growth Rate
      5. 9.20.5. Mission Barns Market Share
      6. 9.20.6. Recent Initiatives, Funding/VC Activities, and Technological Innovations
    21. 9.21. Appleton Meats
      1. 9.21.1. Company Overview
      2. 9.21.2. Product/Service Portfolio
      3. 9.21.3. Appleton Meats Sales, Revenue, Price, and Gross Margin
      4. 9.21.4. Appleton Meats Revenue and Growth Rate
      5. 9.21.5. Appleton Meats Market Share
      6. 9.21.6. Recent Initiatives, Funding/VC Activities, and Technological Innovations
    22. 9.22. Kiran Meats
      1. 9.22.1. Company Overview
      2. 9.22.2. Product/Service Portfolio
      3. 9.22.3. Kiran Meats Sales, Revenue, Price, and Gross Margin
      4. 9.22.4. Kiran Meats Revenue and Growth Rate
      5. 9.22.5. Kiran Meats Market Share
      6. 9.22.6. Recent Initiatives, Funding/VC Activities, and Technological Innovations
    23. 9.23. Higher Steaks
      1. 9.23.1. Company Overview
      2. 9.23.2. Product/Service Portfolio
      3. 9.23.3. Higher Steaks Sales, Revenue, Price, and Gross Margin
      4. 9.23.4. Higher Steaks Revenue and Growth Rate
      5. 9.23.5. Higher Steaks Market Share
      6. 9.23.6. Recent Initiatives, Funding/VC Activities, and Technological Innovations
    24. 9.24. Wild Type
      1. 9.24.1. Company Overview
      2. 9.24.2. Product/Service Portfolio
      3. 9.24.3. Wild Type Sales, Revenue, Price, and Gross Margin
      4. 9.24.4. Wild Type Revenue and Growth Rate
      5. 9.24.5. Wild Type Market Share
      6. 9.24.6. Recent Initiatives, Funding/VC Activities, and Technological Innovations
    25. 9.25. Biofood Systems LTD
      1. 9.25.1. Company Overview
      2. 9.25.2. Product/Service Portfolio
      3. 9.25.3. Biofood Systems LTD Sales, Revenue, Price, and Gross Margin
      4. 9.25.4. Biofood Systems LTD Revenue and Growth Rate
      5. 9.25.5. Biofood Systems LTD Market Share
      6. 9.25.6. Recent Initiatives, Funding/VC Activities, and Technological Innovations
    26. 9.26. Others
      1. 9.26.1. Company Overview
      2. 9.26.2. Product/Service Portfolio
      3. 9.26.3. Others Sales, Revenue, Price, and Gross Margin
      4. 9.26.4. Others Revenue and Growth Rate
      5. 9.26.5. Others Market Share
      6. 9.26.6. Recent Initiatives, Funding/VC Activities, and Technological Innovations
  10. Chapter 10 Cultured Meat — Industry Analysis
    1. 10.1. Introduction and Taxonomy
    2. 10.2. Cultured Meat Market – Key Trends
      1. 10.2.1. Market Drivers
      2. 10.2.2. Market Restraints
      3. 10.2.3. Market Opportunities
    3. 10.3. Value Chain Analysis
    4. 10.4. Key Mandates and Regulations
    5. 10.5. Technology Roadmap and Timeline
    6. 10.6. Cultured Meat Market – Attractiveness Analysis
      1. 10.6.1. By Source
      2. 10.6.2. By Application
      3. 10.6.3. By End-User
      4. 10.6.4. By Distribution Channel
      5. 10.6.5. By Region
  11. Chapter 11 Raw Material Analysis
    1. 11.1. Cultured Meat Key Raw Material Analysis
      1. 11.1.1. Key Raw Materials
      2. 11.1.2. Price Trend of Key Raw Materials
    2. 11.2. Key Suppliers of Raw Materials
    3. 11.3. Proportion of Manufacturing Cost Structure
      1. 11.3.1. Raw Materials Cost
      2. 11.3.2. Labor Cost
      3. 11.3.3. Manufacturing Expenses
      4. 11.3.4. Miscellaneous Expenses
    4. 11.4. Manufacturing Cost Analysis of Cultured Meat
  12. Chapter 12 Industrial Chain, Sourcing Strategy, and Downstream Buyers
    1. 12.1. Cultured Meat Industrial Chain Analysis
    2. 12.2. Upstream Raw Materials Sourcing
      1. 12.2.1. Risk Mitigation:
      2. 12.2.2. Supplier Relationships:
      3. 12.2.3. Business Processes:
      4. 12.2.4. Securing the Product:
    3. 12.3. Raw Materials Sources of Cultured Meat Major Manufacturers
    4. 12.4. Downstream Buyers
    5. 12.5. Distributors/Traders List
  13. Chapter 13 Marketing Strategy Analysis, Distributors
    1. 13.1. Marketing Channel
    2. 13.2. Direct Marketing
    3. 13.3. Indirect Marketing
    4. 13.4. Marketing Channel Development Trends
    5. 13.5. Economic/Political Environmental Change
  14. Chapter 14 Report Conclusion & Key Insights
    1. 14.1. Key Insights from Primary Interviews & Surveys Respondents
    2. 14.2. Key Takeaways from Analysts, Consultants, and Industry Leaders
  15. Chapter 15 Research Approach & Methodology
    1. 15.1. Report Description
    2. 15.2. Research Scope
    3. 15.3. Research Methodology
      1. 15.3.1. Secondary Research
      2. 15.3.2. Primary Research
      3. 15.3.3. Statistical Models
        1. 15.3.3.1. Company Share Analysis Model
        2. 15.3.3.2. Revenue Based Modeling
      4. 15.3.4. Research Limitations

  • List of Figures

    Fig.1	Product Picture of Cultured Meat
    Fig.2	Global Cultured Meat Market, 2016 – 2026 (USD Million)
    Fig.3	Global Cultured Meat Market, 2016 – 2026 (Kilo Tons)
    Fig.4	Global Cultured Meat Market Absolute Revenue Opportunity, 2016 – 2026 (USD Million)
    Fig.5	Global Cultured Meat Market Incremental Revenue Opportunity, 2020 – 2026 (USD Million)
    Fig.6	Global Cultured Meat Market Share, by Source, 2020 & 2026 (USD Million)
    Fig.7	Global Cultured Meat Market Share, by Source, 2020 & 2026 (Kilo Tons)
    Fig.8	Global Poultry Cultured Meat Market, 2016 – 2026 (USD Million)
    Fig.9	Global Poultry Cultured Meat Market, 2016 – 2026 (Kilo Tons)
    Fig.10	Global Pork Cultured Meat Market, 2016 – 2026 (USD Million)
    Fig.11	Global Pork Cultured Meat Market, 2016 – 2026 (Kilo Tons)
    Fig.12	Global Beef Cultured Meat Market, 2016 – 2026 (USD Million)
    Fig.13	Global Beef Cultured Meat Market, 2016 – 2026 (Kilo Tons)
    Fig.14	Global Duck Cultured Meat Market, 2016 – 2026 (USD Million)
    Fig.15	Global Duck Cultured Meat Market, 2016 – 2026 (Kilo Tons)
    Fig.16	Global Seafood Cultured Meat Market, 2016 – 2026 (USD Million)
    Fig.17	Global Seafood Cultured Meat Market, 2016 – 2026 (Kilo Tons)
    Fig.18	Global Cultured Meat Market Share, by Application, 2020 & 2026 (USD Million)
    Fig.19	Global Cultured Meat Market Share, by Application, 2020 & 2026 (Kilo Tons)
    Fig.20	Global Nuggets Cultured Meat Market, 2016 – 2026 (USD Million)
    Fig.21	Global Nuggets Cultured Meat Market, 2016 – 2026 (Kilo Tons)
    Fig.22	Global Sausages Cultured Meat Market, 2016 – 2026 (USD Million)
    Fig.23	Global Sausages Cultured Meat Market, 2016 – 2026 (Kilo Tons)
    Fig.24	Global Burgers Cultured Meat Market, 2016 – 2026 (USD Million)
    Fig.25	Global Burgers Cultured Meat Market, 2016 – 2026 (Kilo Tons)
    Fig.26	Global Hot Dogs Cultured Meat Market, 2016 – 2026 (USD Million)
    Fig.27	Global Hot Dogs Cultured Meat Market, 2016 – 2026 (Kilo Tons)
    Fig.28	Global Meatballs Cultured Meat Market, 2016 – 2026 (USD Million)
    Fig.29	Global Meatballs Cultured Meat Market, 2016 – 2026 (Kilo Tons)
    Fig.30	Global Others Cultured Meat Market, 2016 – 2026 (USD Million)
    Fig.31	Global Others Cultured Meat Market, 2016 – 2026 (Kilo Tons)
    Fig.32	Global Cultured Meat Market Share, by End-User, 2020 & 2026 (USD Million)
    Fig.33	Global Cultured Meat Market Share, by End-User, 2020 & 2026 (Kilo Tons)
    Fig.34	Global Household Cultured Meat Market, 2016 – 2026 (USD Million)
    Fig.35	Global Household Cultured Meat Market, 2016 – 2026 (Kilo Tons)
    Fig.36	Global Food Services Cultured Meat Market, 2016 – 2026 (USD Million)
    Fig.37	Global Food Services Cultured Meat Market, 2016 – 2026 (Kilo Tons)
    Fig.38	Global Cultured Meat Market Share, by Distribution Channel, 2020 & 2026 (USD Million)
    Fig.39	Global Cultured Meat Market Share, by Distribution Channel, 2020 & 2026 (Kilo Tons)
    Fig.40	Global Hypermarkets/Supermarkets Cultured Meat Market, 2016 – 2026 (USD Million)
    Fig.41	Global Hypermarkets/Supermarkets Cultured Meat Market, 2016 – 2026 (Kilo Tons)
    Fig.42	Global Food and Drink Specialty Stores Cultured Meat Market, 2016 – 2026 (USD Million)
    Fig.43	Global Food and Drink Specialty Stores Cultured Meat Market, 2016 – 2026 (Kilo Tons)
    Fig.44	Global Convenience Stores Cultured Meat Market, 2016 – 2026 (USD Million)
    Fig.45	Global Convenience Stores Cultured Meat Market, 2016 – 2026 (Kilo Tons)
    Fig.46	Global Online Retail Cultured Meat Market, 2016 – 2026 (USD Million)
    Fig.47	Global Online Retail Cultured Meat Market, 2016 – 2026 (Kilo Tons)
    Fig.48	Global Others Cultured Meat Market, 2016 – 2026 (USD Million)
    Fig.49	Global Others Cultured Meat Market, 2016 – 2026 (Kilo Tons)
    Fig.50	Global Cultured Meat Market Share, by Region, 2020 & 2026 (USD Million)
    Fig.51	Global Cultured Meat Market Share, by Region, 2020 & 2026 (Kilo Tons)
    Fig.52	North America Cultured Meat Market, 2016 – 2026 (USD Million)
    Fig.53	North America Cultured Meat Market, 2016 – 2026 (Kilo Tons)
    Fig.54	U.S. Cultured Meat Market, 2016 – 2026 (USD Million)
    Fig.55	U.S. Cultured Meat  Market, 2016 – 2026 (Kilo Tons)
    Fig.56	Canada Cultured Meat Market, 2016 – 2026 (USD Million)
    Fig.57	Canada Cultured Meat  Market, 2016 – 2026 (Kilo Tons)
    Fig.58	Europe Cultured Meat Market, 2016 – 2026 (USD Million)
    Fig.59	Europe Cultured Meat Market, 2016 – 2026 (Kilo Tons)
    Fig.60	Germany Cultured Meat Market, 2016 – 2026 (USD Million)
    Fig.61	Germany Cultured Meat  Market, 2016 – 2026 (Kilo Tons)
    Fig.62	France Cultured Meat Market, 2016 – 2026 (USD Million)
    Fig.63	France Cultured Meat  Market, 2016 – 2026 (Kilo Tons)
    Fig.64	U.K. Cultured Meat Market, 2016 – 2026 (USD Million)
    Fig.65	U.K. Cultured Meat  Market, 2016 – 2026 (Kilo Tons)
    Fig.66	Italy Cultured Meat Market, 2016 – 2026 (USD Million)
    Fig.67	Italy Cultured Meat  Market, 2016 – 2026 (Kilo Tons)
    Fig.68	Spain Cultured Meat Market, 2016 – 2026 (USD Million)
    Fig.69	Spain Cultured Meat  Market, 2016 – 2026 (Kilo Tons)
    Fig.70	Rest of Europe Cultured Meat Market, 2016 – 2026 (USD Million)
    Fig.71	Rest of Europe Cultured Meat  Market, 2016 – 2026 (Kilo Tons)
    Fig.72	Asia Pacific Cultured Meat Market, 2016 – 2026 (USD Million)
    Fig.73	Asia Pacific Cultured Meat Market, 2016 – 2026 (Kilo Tons)
    Fig.74	China Cultured Meat Market, 2016 – 2026 (USD Million)
    Fig.75	China Cultured Meat  Market, 2016 – 2026 (Kilo Tons)
    Fig.76	Japan Cultured Meat Market, 2016 – 2026 (USD Million)
    Fig.77	Japan Cultured Meat  Market, 2016 – 2026 (Kilo Tons)
    Fig.78	India Cultured Meat Market, 2016 – 2026 (USD Million)
    Fig.79	India Cultured Meat  Market, 2016 – 2026 (Kilo Tons)
    Fig.80	South  Korea Cultured Meat Market, 2016 – 2026 (USD Million)
    Fig.81	South  Korea Cultured Meat  Market, 2016 – 2026 (Kilo Tons)
    Fig.82	South-East Asia Cultured Meat Market, 2016 – 2026 (USD Million)
    Fig.83	South-East Asia Cultured Meat  Market, 2016 – 2026 (Kilo Tons)
    Fig.84	Rest of Asia Pacific Cultured Meat Market, 2016 – 2026 (USD Million)
    Fig.85	Rest of Asia Pacific Cultured Meat  Market, 2016 – 2026 (Kilo Tons)
    Fig.86	Latin America Cultured Meat Market, 2016 – 2026 (USD Million)
    Fig.87	Latin America Cultured Meat Market, 2016 – 2026 (Kilo Tons)
    Fig.88	Brazil Cultured Meat Market, 2016 – 2026 (USD Million)
    Fig.89	Brazil Cultured Meat  Market, 2016 – 2026 (Kilo Tons)
    Fig.90	Mexico Cultured Meat Market, 2016 – 2026 (USD Million)
    Fig.91	Mexico Cultured Meat  Market, 2016 – 2026 (Kilo Tons)
    Fig.92	Rest of Latin America Cultured Meat Market, 2016 – 2026 (USD Million)
    Fig.93	Rest of Latin America Cultured Meat  Market, 2016 – 2026 (Kilo Tons)
    Fig.94	The Middle-East and Africa Cultured Meat Market, 2016 – 2026 (USD Million)
    Fig.95	The Middle-East and Africa Cultured Meat Market, 2016 – 2026 (Kilo Tons)
    Fig.96	GCC Countries Cultured Meat Market, 2016 – 2026 (USD Million)
    Fig.97	GCC Countries Cultured Meat  Market, 2016 – 2026 (Kilo Tons)
    Fig.98	South Africa Cultured Meat Market, 2016 – 2026 (USD Million)
    Fig.99	South Africa Cultured Meat  Market, 2016 – 2026 (Kilo Tons)
    Fig.100	Rest of Middle-East Africa Cultured Meat Market, 2016 – 2026 (USD Million)
    Fig.101	Rest of Middle-East Africa Cultured Meat  Market, 2016 – 2026 (Kilo Tons)
    Fig.102	Global Cultured Meat Production and Consumption, 2016 – 2026 (Kilo Tons)
    Fig.103	North America Cultured Meat Production and Consumption, 2016 – 2026 (USD Million) (Kilo Tons)
    Fig.104	Europe Cultured Meat Production and Consumption, 2016 – 2026 (USD Million) (Kilo Tons)
    Fig.105	Asia Pacific Cultured Meat Production and Consumption, 2016 – 2026 (USD Million) (Kilo Tons)
    Fig.106	Latin America Cultured Meat Production and Consumption, 2016 – 2026 (USD Million) (Kilo Tons)
    Fig.107	The Middle-East and Africa Cultured Meat Production and Consumption, 2016 – 2026 (USD Million) (Kilo Tons)
    Fig.108	Competitor Market Share – Revenue
    Fig.109	Competitor Market Share – Volume
    Fig.110	Memphis Meats Revenue and Growth Rate
    Fig.111	Memphis Meats Market Share
    Fig.112	MosaMeat Revenue and Growth Rate
    Fig.113	MosaMeat Market Share
    Fig.114	Cubiq Foods Revenue and Growth Rate
    Fig.115	Cubiq Foods Market Share
    Fig.116	Seafuture Sustainable Biotech Revenue and Growth Rate
    Fig.117	Seafuture Sustainable Biotech Market Share
    Fig.118	SuperMeat Revenue and Growth Rate
    Fig.119	SuperMeat Market Share
    Fig.120	Cell Farm FOOD Tech/Granja Celular S.A Revenue and Growth Rate
    Fig.121	Cell Farm FOOD Tech/Granja Celular S.A Market Share
    Fig.122	Just, Inc Revenue and Growth Rate
    Fig.123	Just, Inc Market Share
    Fig.124	New Age Meats Revenue and Growth Rate
    Fig.125	New Age Meats Market Share
    Fig.126	Integriculture Revenue and Growth Rate
    Fig.127	Integriculture Market Share
    Fig.128	Lab farm Foods Revenue and Growth Rate
    Fig.129	Lab farm Foods Market Share
    Fig.130	Aleph Farms Ltd Revenue and Growth Rate
    Fig.131	Aleph Farms Ltd Market Share
    Fig.132	Fork & Goode Revenue and Growth Rate
    Fig.133	Fork & Goode Market Share
    Fig.134	Finless Foods Inc. Revenue and Growth Rate
    Fig.135	Finless Foods Inc. Market Share
    Fig.136	Meatable Revenue and Growth Rate
    Fig.137	Meatable Market Share
    Fig.138	Avant Meats Company Limited Revenue and Growth Rate
    Fig.139	Avant Meats Company Limited Market Share
    Fig.140	Shiok Meats Revenue and Growth Rate
    Fig.141	Shiok Meats Market Share
    Fig.142	Balletic Foods Revenue and Growth Rate
    Fig.143	Balletic Foods Market Share
    Fig.144	Bluenalu, Inc. Revenue and Growth Rate
    Fig.145	Bluenalu, Inc. Market Share
    Fig.146	Future Meat Technologies Ltd Revenue and Growth Rate
    Fig.147	Future Meat Technologies Ltd Market Share
    Fig.148	Mission Barns Revenue and Growth Rate
    Fig.149	Mission Barns Market Share
    Fig.150	Appleton Meats Revenue and Growth Rate
    Fig.151	Appleton Meats Market Share
    Fig.152	Kiran Meats Revenue and Growth Rate
    Fig.153	Kiran Meats Market Share
    Fig.154	Higher Steaks Revenue and Growth Rate
    Fig.155	Higher Steaks Market Share
    Fig.156	Wild Type Revenue and Growth Rate
    Fig.157	Wild Type Market Share
    Fig.158	Biofood Systems LTD Revenue and Growth Rate
    Fig.159	Biofood Systems LTD Market Share
    Fig.160	Others Revenue and Growth Rate
    Fig.161	Others Market Share
    Fig.162	Market Dynamics
    Fig.163	Global Cultured Meat – Value Chain Analysis
    Fig.164	Key Mandates and Regulations
    Fig.165	Technology Roadmap and Timeline
    Fig.166	Market Attractiveness Analysis – By Source
    Fig.167	Market Attractiveness Analysis – By Application
    Fig.168	Market Attractiveness Analysis – By End-User
    Fig.169	Market Attractiveness Analysis – By Distribution Channel
    Fig.170	Market Attractiveness Analysis – By Region
    Fig.171	Manufacturing Cost Structure of Cultured Meat
    Fig.172	Cultured Meat Industrial Chain Analysis
    Fig.173	Market Channels
    Fig.174	Marketing Channel Development Trend
    Fig.175	Growth in World Gross Product, 2008-2018
    

    List of Tables

    Table 1	Global Cultured Meat Market, 2020 & 2026 (USD Million)
    Table 2	Global Cultured Meat Market, by Source, 2016 – 2026 (USD Million)
    Table 3	Global Cultured Meat Market, by Source, 2016 – 2026 (Kilo Tons)
    Table 4	Global Cultured Meat Market, by Application, 2016 – 2026 (USD Million)
    Table 5	Global Cultured Meat Market, by Application, 2016 – 2026 (Kilo Tons)
    Table 6	Global Cultured Meat Market, by End-User, 2016 – 2026 (USD Million)
    Table 7	Global Cultured Meat Market, by End-User, 2016 – 2026 (Kilo Tons)
    Table 8	Global Cultured Meat Market, by Distribution Channel, 2016 – 2026 (USD Million)
    Table 9 Global Cultured Meat Market, by Distribution Channel, 2016 – 2026 (Kilo Tons)
    Table 10 Global Cultured Meat Market, by Region, 2016 – 2026 (USD Million)
    Table 11 Global Cultured Meat Market, by Region, 2016 – 2026 (Kilo Tons)
    Table 12 North America Cultured Meat Market, by Country, 2016 – 2026 (USD Million)
    Table 13 North America Cultured Meat Market, by Country, 2016 – 2026 (Kilo Tons)
    Table 14 North America Cultured Meat Market, by Source, 2016 – 2026 (USD Million)
    Table 15 North America Cultured Meat Market, by Source, 2016 – 2026 (Kilo Tons)
    Table 16 North America Cultured Meat Market, by Application, 2016 – 2026 (USD Million)
    Table 17 North America Cultured Meat Market, by Application, 2016 – 2026 (Kilo Tons)
    Table 18 North America Cultured Meat Market, by End-User, 2016 – 2026 (USD Million)
    Table 19 North America Cultured Meat Market, by End-User, 2016 – 2026 (Kilo Tons)
    Table 20 North America Cultured Meat Market, by Distribution Channel, 2016 – 2026 (USD Million)
    Table 21 North America Cultured Meat Market, by Distribution Channel, 2016 – 2026 (Kilo Tons)
    Table 22 Europe Cultured Meat Market, by Country, 2016 – 2026 (USD Million)
    Table 23 Europe Cultured Meat Market, by Country, 2016 – 2026 (Kilo Tons)
    Table 24 Europe Cultured Meat Market, by Source, 2016 – 2026 (USD Million)
    Table 25 Europe Cultured Meat Market, by Source, 2016 – 2026 (Kilo Tons)
    Table 26 Europe Cultured Meat Market, by Application, 2016 – 2026 (USD Million)
    Table 27 Europe Cultured Meat Market, by Application, 2016 – 2026 (Kilo Tons)
    Table 28 Europe Cultured Meat Market, by End-User, 2016 – 2026 (USD Million)
    Table 29 Europe Cultured Meat Market, by End-User, 2016 – 2026 (Kilo Tons)
    Table 30 Europe Cultured Meat Market, by Distribution Channel, 2016 – 2026 (USD Million)
    Table 31 Europe Cultured Meat Market, by Distribution Channel, 2016 – 2026 (Kilo Tons)
    Table 32 Asia Pacific Cultured Meat Market, by Country, 2016 – 2026 (USD Million)
    Table 33 Asia Pacific Cultured Meat Market, by Country, 2016 – 2026 (Kilo Tons)
    Table 34 Asia Pacific Cultured Meat Market, by Source, 2016 – 2026 (USD Million)
    Table 35 Asia Pacific Cultured Meat Market, by Source, 2016 – 2026 (Kilo Tons)
    Table 36 Asia Pacific Cultured Meat Market, by Application, 2016 – 2026 (USD Million)
    Table 37 Asia Pacific Cultured Meat Market, by Application, 2016 – 2026 (Kilo Tons)
    Table 38 Asia Pacific Cultured Meat Market, by End-User, 2016 – 2026 (USD Million)
    Table 39 Asia Pacific Cultured Meat Market, by End-User, 2016 – 2026 (Kilo Tons)
    Table 40 Asia Pacific Cultured Meat Market, by Distribution Channel, 2016 – 2026 (USD Million)
    Table 41 Asia Pacific Cultured Meat Market, by Distribution Channel, 2016 – 2026 (Kilo Tons)
    Table 42 Latin America Cultured Meat Market, by Country, 2016 – 2026 (USD Million)
    Table 43 Latin America Cultured Meat Market, by Country, 2016 – 2026 (Kilo Tons)
    Table 44 Latin America Cultured Meat Market, by Source, 2016 – 2026 (USD Million)
    Table 45 Latin America Cultured Meat Market, by Source, 2016 – 2026 (Kilo Tons)
    Table 46 Latin America Cultured Meat Market, by Application, 2016 – 2026 (USD Million)
    Table 47 Latin America Cultured Meat Market, by Application, 2016 – 2026 (Kilo Tons)
    Table 48 Latin America Cultured Meat Market, by End-User, 2016 – 2026 (USD Million)
    Table 49 Latin America Cultured Meat Market, by End-User, 2016 – 2026 (Kilo Tons)
    Table 50 Latin America Cultured Meat Market, by Distribution Channel, 2016 – 2026 (USD Million)
    Table 51 Latin America Cultured Meat Market, by Distribution Channel, 2016 – 2026 (Kilo Tons)
    Table 52 The Middle-East and Africa Cultured Meat Market, by Country, 2016 – 2026 (USD Million)
    Table 53 The Middle-East and Africa Cultured Meat Market, by Country, 2016 – 2026 (Kilo Tons)
    Table 54 The Middle-East and Africa Cultured Meat Market, by Source, 2016 – 2026 (USD Million)
    Table 55 The Middle-East and Africa Cultured Meat Market, by Source, 2016 – 2026 (Kilo Tons)
    Table 56 The Middle-East and Africa Cultured Meat Market, by Application, 2016 – 2026 (USD Million)
    Table 57 The Middle-East and Africa Cultured Meat Market, by Application, 2016 – 2026 (Kilo Tons)
    Table 58 The Middle-East and Africa Cultured Meat Market, by End-User, 2016 – 2026 (USD Million)
    Table 59 The Middle-East and Africa Cultured Meat Market, by End-User, 2016 – 2026 (Kilo Tons)
    Table 60 The Middle-East and Africa Cultured Meat Market, by Distribution Channel, 2016 – 2026 (USD Million)
    Table 61 The Middle-East and Africa Cultured Meat Market, by Distribution Channel, 2016 – 2026 (Kilo Tons)
    Table 62 North America Cultured Meat Production, Consumption, Export, Import, 2016 – 2020
    Table 63 Europe Cultured Meat Production, Consumption, Export, Import, 2016 – 2020
    Table 64 Asia Pacific Cultured Meat Production, Consumption, Export, Import, 2016 – 2020
    Table 65 Latin America Cultured Meat Production, Consumption, Export, Import, 2016 – 2020
    Table 66 The Middle-East and Africa Cultured Meat Production, Consumption, Export, Import, 2016 – 2020
    Table 67 Global Cultured Meat Market - Company Revenue Analysis, 2016 – 2020 (USD Million)
    Table 68 Global Cultured Meat Market - Company Revenue Share Analysis, 2016 – 2020 (%)
    Table 69 Global Cultured Meat Market - Company Volume Analysis, 2016 – 2020 (Kilo Tons)
    Table 70 Global Cultured Meat Market - Company Volume Share Analysis, 2016 – 2020 (%)
    Table 71 Acquisitions and Mergers
    Table 72 Market Drivers – Impact Analysis
    Table 73 Market Restraints
    Table 74 Market Opportunities
    Table 75 Production Base and Market Concentration Rate of Raw Material
    Table 76 Key Suppliers of Raw Materials
    Table 77 Raw Materials Sources of Cultured Meat Major Manufacturers
    Table 78 Major Buyers of Cultured Meat
    Table 79 Distributors/Traders of Cultured Meat by Region
    
  •  

    Industry Major Market Players

    • Memphis Meats
    • MosaMeat
    • Cubiq Foods
    • Seafuture Sustainable Biotech
    • SuperMeat
    • Cell Farm FOOD Tech/Granja Celular S.A
    • Just Inc
    • New Age Meats
    • Integriculture Lab farm Foods
    • Aleph Farms Ltd
    • Fork & Goode
    • Finless Foods Inc.
    • Meatable
    • Avant Meats Company Limited
    • Shiok Meats
    • Balletic Foods
    • Bluenalu Inc.
    • Future Meat Technologies Ltd
    • Mission Barns
    • Appleton Meats
    • Kiran Meats
    • Higher Steaks
    • Wild Type
    • Biofood Systems LTD