Search Market Research Report

Discover Our Latest Reports
Discover Our Featured Reports
Discover Top Selling Reports

Business-to-Business E-commerce Market Size, Share Global Analysis Report, 2021 – 2026

report img

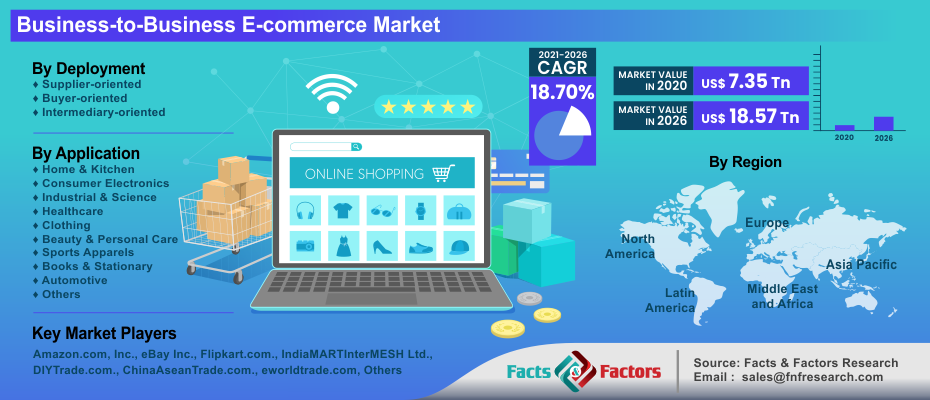
Business-to-Business E-commerce Market By Deployment Model (Intermediary-oriented, Supplier-oriented, Buyer-Oriented), By Application (Home & Kitchen, Consumer Electronics, Industrial & Science, Healthcare, Clothing, Beauty & Personal Care, Sports Apparels, Books & Stationary, Automotive, Others), and By Region: Global & Regional Industry Perspective, Comprehensive Analysis, and Forecast 2021 – 2026

Industry Insights

[226+ Pages Report] According to Facts and Factors, the global Business-to-Business E-commerce market was valued at roughly USD 7.35 Trillion in 2020 and is predicted to create revenue of roughly USD 18.57 Trillion by the end of 2026, with a CAGR of roughly 18.70% between 2021 and 2026.

B2B e-commerce refers to an online transaction in which both sides are companies. In other words, a B2B transaction occurs when a company sells products or services to another company, which is its customer. B2B enterprises, like any other type of business, come in a variety of shapes, sizes, and levels of sophistication. They can cover a wide range of company types and industries, from accountancy, legal, and digital services to physical items including machinery, equipment, and consumer goods.

Business-to-Business E-commerce Market

To know more about this report | Request Free Sample Copy

logoMarket Overview    

While many of us shop online as consumers, many of us are unaware that the worldwide B2B digital commerce market is worth six times as much as the B2C market. As local and international corporate shoppers flock to the internet in search of speed, convenience, and simple purchase experiences, these figures are expected to rise. This will drive demand for B2B E-commerce platforms by encouraging historically offline B2B sellers to put up an E-commerce site.

B2B gateways play a critical role in facilitating large-scale and SMEs firms in reaching out to remote locations and have evolved into a global way of doing business. These portals aid in the formation of new commercial partnerships between organizations as well as the maintenance of current ones. Furthermore, B2B E-commerce platforms support companies to cut marketing expenses, improve customer/supplier management, and increase sales engagement.

A B2B transaction occurs when one company sells a set of products or services to another company. Typically, the vendor's products and services are used by a group or department. On occasion, a single buyer user completes a transaction in support of the company's business objectives. Furthermore, some B2B transactions entail the usage of products by the entire organization, such as office furniture, computers, and productivity software.

The B2B consumers ’ decision - making process is facilitated by a purchasing committee, which includes a business decision-maker, such as the person in charge of the budget; a technical decision-maker, or anyone who examines the functionalities of the prospective products; and influencers, such as people who provide feedback on the decision. A request for proposal, in which the buyer invites prospective vendors to submit bids specifying their products, terms, and pricing, may be used for large purchases. B2B is crucial because, to start, run, and grow, every business needs to buy items and services from other businesses.

B2B providers provide office space, furniture, computer hardware and software, and other services to a company. Suppliers provide the food that corporations keep in their kitchens and the signage that is posted on their office buildings.

Websites allow potential customers to learn more about a company's products and services and make contact. Organizations can explore for items and services on online product and supplier exchanges commence and websites procurement through E-procurement integrations. B2B transactions are also facilitated by specialized internet directories that provide information about specific industries, companies, and the products and services they offer.

logoIndustry Growth Factors

The COVID-19 epidemic shifted consumer preferences toward online buying, opening up new opportunities. The B2B e-commerce business outlook has been impacted by a growth in the number of orders, changes in customer behavior, supply chain disruptions, and the closure of physical storefronts. While retail sales fell in 2020, e-commerce sales grew significantly. Several B2B companies are increasingly concentrating on bringing their customers online.

Smartphones are becoming more common, and internet penetration is expanding, opening up new opportunities for industry growth. The increased popularity of B2B e-commerce platforms has resulted from the simplicity of doing business and the ability to check inventories, see orders, and make payments on mobile phones. Furthermore, as the market becomes more competitive, many organizations are turning to online business strategies to acquire a competitive advantage.

In an economy that is progressively becoming digital, E-B2B has a strong use case to resolve traditional Business - to - business retail enhance the end-consumer experience and supply-chain capabilities by resolving the pain points of intermediaries in the traditional B2B and unorganized supply chain.

When it comes to e-commerce developments, online B2B is still catching up to the old B2B model. The issue is in the area of pricing negotiation and collaboration. While many businesses appreciate the convenience of shopping online, they are accustomed to dealing with sales professionals who frequently provide special rates for large orders. A hybrid strategy, in which customers can build relationships with sales agents while simultaneously being able to shop online and receiving the same pricing by entering special codes, could be a potential option.

Customers, even corporate customers, have requirements, wants, and aspirations, as well as a preference for personalization. B2B buyers, on the other hand, have significantly more criteria. They include more stakeholders, have longer sales cycles, and demand more complex customization in general - and this isn't going away. Personalized messaging engages over 72% of customers, and 69 percent of B2B buyers will pay more for a personalized experience. Personalized products, prices, promotions, checkout experiences, and marketing messages are all part of this.

logoSegmentation Analysis

The Business-to-Business E-commerce Market is segmented based on deployment type and application:

As per deployment type (supplier-oriented, buyer-oriented, intermediary-oriented and application (home & kitchen, consumer electronics, industrial & science, healthcare, clothing, beauty & personal care, sports apparel, books & stationary, automotive, others).

logoReport Scope:

Report Attribute

Details

Market Size in 2020

USD 7.35 Trillion

Projected Market Size in 2026

USD 18.57 Trillion

CAGR Growth Rate

18.70%

Base Year

2020

Forecast Years

2021-2026

Key Market Players

Flipkart.com, Amazon.com, Inc., ChinaAseanTrade.com, DIYTrade.com, eFlexfire LEDs, Bay Inc., eworldtrade.com, IndiaMART InterMESH Ltd., KOMPASS, Quill Lincolnshire, Inc. and Others

Key Segments

Deployment Type, Application, and Region

Major Regions Covered

North America, Europe, Asia Pacific, Latin America, and Middle East & Africa

Purchase Options

Request customized purchase options to meet your research needs. Explore purchase options

logo Regional Analysis

North America, which will be followed by the Asia Pacific, is expected to rise rapidly over the projection period. The existence of major organizations such as eBay Inc. and Amazon.com Inc. among others has built strong B2B sales platforms in the countries. Nevertheless, the pandemic has prompted several other firms to adopt an online business strategy to reach and serve a larger audience. B2B vendors on social media platforms will benefit from the same delivery and a more engaging shopping experience. Cloud technology advancements and Artificial Intelligence (AI) will help improve customer experience even further, opening up new opportunities in the e-commerce market.

Run-of-the-mill purchases including basic transactions with clients requiring no value-added services or the purchase being a simple reorder accounted for a substantial share of B2B sales in North America. However, the complexity of B2B suppliers' products or services works as a substantial impediment to B2B-commerce adoption. Over the projection period, the market will experience a spike as technology advances. Furthermore, the continuous epidemic has compelled some firms to go online to serve customers all over the world. Based on the industry, geography, and competition, businesses are still looking for suitable internet channels.

logo Covid-19 Analysis

The market is highly fragmented on a global scale, with a mix of small, medium, and large organizations transferring their operations online. As a result of the epidemic, numerous businesses have turned to internet platforms as an alternative to meet customer demands. The COVID-19 epidemic is likely to continue to have an impact on how businesses operate in the long run, with most B2B vendors opting for online commerce as their preferred method of doing business.

Due to the rapid move from brick-and-mortar purchases to online retail platforms to limit the danger of coronavirus infection during human interaction, the COVID-19 pandemic has resulted in considerable development in the e-commerce business.

COVID-19 had a significant impact on the e-commerce business in early 2020. Existing customers' behaviors have transformed significantly as a result of the shutdown in nations such as Germany, the United States, Spain, Italy, India, China, and Russia. Due to the restrictions on public gatherings, online buying is preferred during this time. Although social interactions are also migrating Business-To-Business (B2B) and online conversations are going to take place technologically, millions around the world are flocking to the internet as a consequence of social alienation. According to e-commerce industry analysts, this has had a good influence on the business, with some companies reporting a significant boost in product demand.

While the coronavirus outbreak wreaked havoc around the world, businesses prioritized preventing physical contact while maintaining business continuity. As a result, several B2B merchants urged their clients to shop online. For example, Fastparts, a distributor of agricultural machinery parts, is attempting to build a web store to better serve its customers.

logo Competitive Players

Some of the essential players operating in the Business-to-Business E-commerce market are :

  • Flipkart.com
  • Amazon.com, Inc.
  • ChinaAseanTrade.com
  • DIYTrade.com
  • eFlexfire LEDs
  • Bay Inc.
  • eworldtrade.com
  • IndiaMART InterMESH Ltd.
  • KOMPASS
  • Quill Lincolnshire Inc.

logoBy Deployment Type:

  • Supplier-oriented
  • Buyer-oriented
  • Intermediary-oriented

logoBy Application:

  • Home & Kitchen
  • Consumer Electronics
  • Industrial & Science
  • Healthcare
  • Clothing
  • Beauty & Personal Care
  • Sports Apparels
  • Books & Stationary
  • Automotive
  • Others

logoBy Region:

  • North America
    • U.S.
    • Canada
  • Europe
    • France
    • UK
    • Germany
    • Italy
    • Spain
    • Rest of Europe
  • Asia Pacific
    • China
    • India
    • Japan
    • South Korea
    • ASEAN
    • Australia
    • Rest of Asia Pacific
  • Latin America
    • Brazil
    • Mexico
    • Rest of Latin America
  • Middle East & Africa
    • GCC
    • South Africa
    • Rest of Middle East & Africa

Table of Content

  1. Chapter 1 Executive Summary
    1. 1.1. Introduction of Business-to-Business E-commerce
    2. 1.2. Global Business-to-Business E-commerce Market, 2020 & 2026 (USD Trillion)
    3. 1.3. Global Business-to-Business E-commerce Market, 2016 – 2026 (USD Trillion)
    4. 1.4. Global Business-to-Business E-commerce Market Absolute Revenue Opportunity, 2016 – 2026 (USD Trillion)
    5. 1.5. Global Business-to-Business E-commerce Market Incremental Revenue Opportunity, 2020 – 2026 (USD Trillion)
  2. Chapter 2 Business-to-Business E-commerce Market – Sales Channel Analysis
    1. 2.1. Global Business-to-Business E-commerce Market – Sales Channel Overview
    2. 2.2. Global Business-to-Business E-commerce Market Share, by Sales Channel, 2020 & 2026 (USD Trillion)
    3. 2.3. Premium Food Service
      1. 2.3.1. Global Premium Food Service Business-to-Business E-commerce Market, 2016 – 2026 (USD Trillion)
      2. 2.3.2. Global Premium Food Service Business-to-Business E-commerce Market, 2016 – 2026
    4. 2.4. Non Premium Food Service
      1. 2.4.1. Global Non Premium Food Service Business-to-Business E-commerce Market, 2016 – 2026 (USD Trillion)
      2. 2.4.2. Global Non Premium Food Service Business-to-Business E-commerce Market, 2016 – 2026
    5. 2.5. B2B
      1. 2.5.1. Global B2B Business-to-Business E-commerce Market, 2016 – 2026 (USD Trillion)
      2. 2.5.2. Global B2B Business-to-Business E-commerce Market, 2016 – 2026
  3. Chapter 3 Business-to-Business E-commerce Market – Application Analysis
    1. 3.1. Global Business-to-Business E-commerce Market – Application Overview
    2. 3.2. Global Business-to-Business E-commerce Market Share, by Application, 2020 & 2026 (USD Trillion)
    3. 3.3. Global Business-to-Business E-commerce Market Share, by Application, 2020 & 2026
    4. 3.4. Savory
      1. 3.4.1. Global Savory Business-to-Business E-commerce Market, 2016 – 2026 (USD Trillion)
      2. 3.4.2. Global Savory Business-to-Business E-commerce Market, 2016 – 2026
    5. 3.5. Sandwich
      1. 3.5.1. Global Sandwich Business-to-Business E-commerce Market, 2016 – 2026 (USD Trillion)
      2. 3.5.2. Global Sandwich Business-to-Business E-commerce Market, 2016 – 2026
    6. 3.6. Salad Dressings & Dip
      1. 3.6.1. Global Salad Dressings & Dip Business-to-Business E-commerce Market, 2016 – 2026 (USD Trillion)
      2. 3.6.2. Global Salad Dressings & Dip Business-to-Business E-commerce Market, 2016 – 2026
    7. 3.7. Baked Goods/Desserts
      1. 3.7.1. Global Baked Goods/Desserts Business-to-Business E-commerce Market, 2016 – 2026 (USD Trillion)
      2. 3.7.2. Global Baked Goods/Desserts Business-to-Business E-commerce Market, 2016 – 2026
    8. 3.8. Ice Creams & Smoothies
      1. 3.8.1. Global Ice Creams & Smoothies Business-to-Business E-commerce Market, 2016 – 2026 (USD Trillion)
      2. 3.8.2. Global Ice Creams & Smoothies Business-to-Business E-commerce Market, 2016 – 2026
  4. Chapter 4 Business-to-Business E-commerce Market – Regional Analysis
    1. 4.1. Global Business-to-Business E-commerce Market Regional Overview
    2. 4.2. Global Business-to-Business E-commerce Market Share, by Region, 2020 & 2026 (USD Trillion)
    3. 4.3. Global Business-to-Business E-commerce Market Share, by Region, 2020 & 2026
    4. 4.4. North America
      1. 4.4.1. North America Business-to-Business E-commerce Market, 2016 – 2026 (USD Trillion)
        1. 4.4.1.1. North America Business-to-Business E-commerce Market, by Country, 2016 - 2026 (USD Trillion)
      2. 4.4.2. North America Market, 2016 – 2026
        1. 4.4.2.1. North America Business-to-Business E-commerce Market, by Country, 2016 - 2026
      3. 4.4.3. North America Business-to-Business E-commerce Market, by Sales Channel, 2016 – 2026
        1. 4.4.3.1. North America Business-to-Business E-commerce Market, by Sales Channel, 2016 – 2026 (USD Trillion)
        2. 4.4.3.2. North America Business-to-Business E-commerce Market, by Sales Channel, 2016 – 2026
      4. 4.4.4. North America Business-to-Business E-commerce Market, by Application, 2016 – 2026
        1. 4.4.4.1. North America Business-to-Business E-commerce Market, by Application, 2016 – 2026 (USD Trillion)
        2. 4.4.4.2. North America Business-to-Business E-commerce Market, by Application, 2016 – 2026
      5. 4.4.5. U.S.
        1. 4.4.5.1. U.S. Business-to-Business E-commerce Market, 2016 – 2026 (USD Trillion)
        2. 4.4.5.2. U.S. Business-to-Business E-commerce Market, 2016 – 2026
      6. 4.4.6. Canada
        1. 4.4.6.1. Canada Business-to-Business E-commerce Market, 2016 – 2026 (USD Trillion)
        2. 4.4.6.2. Canada Business-to-Business E-commerce Market, 2016 – 2026
    5. 4.5. Europe
      1. 4.5.1. Europe Business-to-Business E-commerce Market, 2016 – 2026 (USD Trillion)
        1. 4.5.1.1. Europe Business-to-Business E-commerce Market, by Country, 2016 - 2026 (USD Trillion)
      2. 4.5.2. Europe Business-to-Business E-commerce Market, 2016 – 2026
        1. 4.5.2.1. Europe Business-to-Business E-commerce Market, by Country, 2016 - 2026
      3. 4.5.3. Europe Business-to-Business E-commerce Market, by Sales Channel, 2016 – 2026
        1. 4.5.3.1. Europe Business-to-Business E-commerce Market, by Sales Channel, 2016 – 2026 (USD Trillion)
        2. 4.5.3.2. Europe Business-to-Business E-commerce Market, by Sales Channel, 2016 – 2026
      4. 4.5.4. Europe Business-to-Business E-commerce Market, by Application, 2016 – 2026
        1. 4.5.4.1. Europe Business-to-Business E-commerce Market, by Application, 2016 – 2026 (USD Trillion)
        2. 4.5.4.2. Europe Business-to-Business E-commerce Market, by Application, 2016 – 2026
      5. 4.5.5. Germany
        1. 4.5.5.1. Germany Business-to-Business E-commerce Market, 2016 – 2026 (USD Trillion)
        2. 4.5.5.2. Germany Business-to-Business E-commerce Market, 2016 – 2026
      6. 4.5.6. France
        1. 4.5.6.1. France Business-to-Business E-commerce Market, 2016 – 2026 (USD Trillion)
        2. 4.5.6.2. France Business-to-Business E-commerce Market, 2016 – 2026
      7. 4.5.7. U.K.
        1. 4.5.7.1. U.K. Business-to-Business E-commerce Market, 2016 – 2026 (USD Trillion)
        2. 4.5.7.2. U.K. Business-to-Business E-commerce Market, 2016 – 2026
      8. 4.5.8. Italy
        1. 4.5.8.1. Italy Business-to-Business E-commerce Market, 2016 – 2026 (USD Trillion)
        2. 4.5.8.2. Italy Business-to-Business E-commerce Market, 2016 – 2026
      9. 4.5.9. Spain
        1. 4.5.9.1. Spain Business-to-Business E-commerce Market, 2016 – 2026 (USD Trillion)
        2. 4.5.9.2. Spain Business-to-Business E-commerce Market, 2016 – 2026
      10. 4.5.10. Rest of Europe
        1. 4.5.10.1. Rest of Europe Business-to-Business E-commerce Market, 2016 – 2026 (USD Trillion)
        2. 4.5.10.2. Rest of Europe Business-to-Business E-commerce Market, 2016 – 2026
    6. 4.6. Asia Pacific
      1. 4.6.1. Asia Pacific Business-to-Business E-commerce Market, 2016 – 2026 (USD Trillion)
        1. 4.6.1.1. Asia Pacific Business-to-Business E-commerce Market, by Country, 2016 - 2026 (USD Trillion)
      2. 4.6.2. Asia Pacific Business-to-Business E-commerce Market, 2016 – 2026
        1. 4.6.2.1. Asia Pacific Business-to-Business E-commerce Market, by Country, 2016 - 2026
      3. 4.6.3. Asia Pacific Business-to-Business E-commerce Market, by Sales Channel, 2016 – 2026
        1. 4.6.3.1. Asia Pacific Business-to-Business E-commerce Market, by Sales Channel, 2016 – 2026 (USD Trillion)
        2. 4.6.3.2. Asia Pacific Business-to-Business E-commerce Market, by Sales Channel, 2016 – 2026
      4. 4.6.4. Asia Pacific Business-to-Business E-commerce Market, by Application, 2016 – 2026
        1. 4.6.4.1. Asia Pacific Business-to-Business E-commerce Market, by Application, 2016 – 2026 (USD Trillion)
        2. 4.6.4.2. Asia Pacific Business-to-Business E-commerce Market, by Application, 2016 – 2026
      5. 4.6.5. China
        1. 4.6.5.1. China Business-to-Business E-commerce Market, 2016 – 2026 (USD Trillion)
        2. 4.6.5.2. China Business-to-Business E-commerce Market, 2016 – 2026
      6. 4.6.6. India
        1. 4.6.6.1. India Business-to-Business E-commerce Market, 2016 – 2026 (USD Trillion)
        2. 4.6.6.2. India Business-to-Business E-commerce Market, 2016 – 2026
      7. 4.6.7. Japan
        1. 4.6.7.1. Japan Business-to-Business E-commerce Market, 2016 – 2026 (USD Trillion)
        2. 4.6.7.2. Japan Business-to-Business E-commerce Market, 2016 – 2026
      8. 4.6.8. South Korea
        1. 4.6.8.1. South Korea Business-to-Business E-commerce Market, 2016 – 2026 (USD Trillion)
        2. 4.6.8.2. South Korea Business-to-Business E-commerce Market, 2016 – 2026
      9. 4.6.9. South-East Asia
        1. 4.6.9.1. South-East Asia Business-to-Business E-commerce Market, 2016 – 2026 (USD Trillion)
        2. 4.6.9.2. South-East Asia Business-to-Business E-commerce Market, 2016 – 2026
      10. 4.6.10. Rest of Asia Pacific
        1. 4.6.10.1. Rest of Asia Pacific Business-to-Business E-commerce Market, 2016 – 2026 (USD Trillion)
        2. 4.6.10.2. Rest of Asia Pacific Business-to-Business E-commerce Market, 2016 – 2026
    7. 4.7. Latin America
      1. 4.7.1. Latin America Business-to-Business E-commerce Market, 2016 – 2026 (USD Trillion)
        1. 4.7.1.1. Latin America Business-to-Business E-commerce Market, by Country, 2016 - 2026 (USD Trillion)
      2. 4.7.2. Latin America Business-to-Business E-commerce Market, 2016 – 2026
        1. 4.7.2.1. Latin America Business-to-Business E-commerce Market, by Country, 2016 - 2026
      3. 4.7.3. Latin America Business-to-Business E-commerce Market, by Sales Channel, 2016 – 2026
        1. 4.7.3.1. Latin America Business-to-Business E-commerce Market, by Sales Channel, 2016 – 2026 (USD Trillion)
        2. 4.7.3.2. Latin America Business-to-Business E-commerce Market, by Sales Channel, 2016 – 2026
      4. 4.7.4. Latin America Business-to-Business E-commerce Market, by Application, 2016 – 2026
        1. 4.7.4.1. Latin America Business-to-Business E-commerce Market, by Application, 2016 – 2026 (USD Trillion)
        2. 4.7.4.2. Latin America Business-to-Business E-commerce Market, by Application, 2016 – 2026
      5. 4.7.5. Brazil
        1. 4.7.5.1. Brazil Business-to-Business E-commerce Market, 2016 – 2026 (USD Trillion)
        2. 4.7.5.2. Brazil Business-to-Business E-commerce Market, 2016 – 2026
      6. 4.7.6. Mexico
        1. 4.7.6.1. Mexico Business-to-Business E-commerce Market, 2016 – 2026 (USD Trillion)
        2. 4.7.6.2. Mexico Business-to-Business E-commerce Market, 2016 – 2026
      7. 4.7.7. Rest of Latin America
        1. 4.7.7.1. Rest of Latin America Business-to-Business E-commerce Market, 2016 – 2026 (USD Trillion)
        2. 4.7.7.2. Rest of Latin America Business-to-Business E-commerce Market, 2016 – 2026
    8. 4.8. Middle East & Africa
      1. 4.8.1. Middle East & Africa Business-to-Business E-commerce Market, 2016 – 2026 (USD Trillion)
        1. 4.8.1.1. Middle East & Africa Business-to-Business E-commerce Market, by Country, 2016 - 2026 (USD Trillion)
      2. 4.8.2. Middle East & Africa Business-to-Business E-commerce Market, 2016 – 2026
        1. 4.8.2.1. Middle East & Africa Business-to-Business E-commerce Market, by Country, 2016 - 2026
      3. 4.8.3. Middle East & Africa Business-to-Business E-commerce Market, by Sales Channel, 2016 – 2026
        1. 4.8.3.1. Middle East & Africa Business-to-Business E-commerce Market, by Sales Channel, 2016 – 2026 (USD Trillion)
        2. 4.8.3.2. Middle East & Africa Business-to-Business E-commerce Market, by Sales Channel, 2016 – 2026
      4. 4.8.4. Middle East & Africa Business-to-Business E-commerce Market, by Application, 2016 – 2026
        1. 4.8.4.1. Middle East & Africa Business-to-Business E-commerce Market, by Application, 2016 – 2026 (USD Trillion)
        2. 4.8.4.2. Middle East & Africa Business-to-Business E-commerce Market, by Application, 2016 – 2026
      5. 4.8.5. GCC
        1. 4.8.5.1. GCC Business-to-Business E-commerce Market, 2016 – 2026 (USD Trillion)
        2. 4.8.5.2. GCC Business-to-Business E-commerce Market, 2016 – 2026
      6. 4.8.6. South Africa
        1. 4.8.6.1. South Africa Business-to-Business E-commerce Market, 2016 – 2026 (USD Trillion)
        2. 4.8.6.2. South Africa Business-to-Business E-commerce Market, 2016 – 2026
      7. 4.8.7. Rest of Middle East & Africa
        1. 4.8.7.1. Rest of Middle East & Africa Business-to-Business E-commerce Market, 2016 – 2026 (USD Trillion)
        2. 4.8.7.2. Rest of Middle East & Africa Business-to-Business E-commerce Market, 2016 – 2026
  5. Chapter 5 Business-to-Business E-commerce Market – Competitive Landscape
    1. 5.1. Competitor Market Share – Revenue
    2. 5.2. Market Concentration Rate Analysis, Top 3 and Top 5 Players
    3. 5.3. Strategic Developments
      1. 5.3.1. Acquisitions and Mergers
      2. 5.3.2. New Products
      3. 5.3.3. Research & Development Activities
  6. Chapter 6 Company Profiles
    1. 6.1. Flipkart.com
      1. 6.1.1. Company Overview
      2. 6.1.2. Product/Service Portfolio
        1. 6.1.3. Flipkart.com Sales, Revenue, and Gross Margin
        2. 6.1.4. Flipkart.com Revenue and Growth Rate
        3. 6.1.5. Flipkart.com Market Share
      3. 6.1.6. Recent Initiatives, Funding/VC Activities, and Technological Innovations
      4. 6.2. Amazon.com, Inc.
      5. 6.2.1. Company Overview
      6. 6.2.2. Product/Service Portfolio
        1. 6.2.3. Amazon.com, Inc., Revenue, and Gross Margin
        2. 6.2.4. Amazon.com, Inc. Revenue and Growth Rate
        3. 6.2.5. Amazon.com, Inc. Market Share
      7. 6.2.6. Recent Initiatives, Funding/VC Activities, and Technological Innovations
      8. 6.3. ChinaAseanTrade.com
      9. 6.3.1. Company Overview
      10. 6.3.2. Product/Service Portfolio
        1. 6.3.3. ChinaAseanTrade.com Sales, Revenue, and Gross Margin
        2. 6.3.4. ChinaAseanTrade.com Revenue and Growth Rate
        3. 6.3.5. ChinaAseanTrade.com Market Share
      11. 6.3.6. Recent Initiatives, Funding/VC Activities, and Technological Innovations
      12. 6.4. DIYTrade.com
      13. 6.4.1. Company Overview
      14. 6.4.2. Product/Service Portfolio
        1. 6.4.3. DIYTrade.com Sales, Revenue, and Gross Margin
        2. 6.4.4. DIYTrade.com Revenue and Growth Rate
        3. 6.4.5. DIYTrade.com Market Share
      15. 6.4.6. Recent Initiatives, Funding/VC Activities, and Technological Innovations
    2. 6.5. eFlexfire LEDs
      1. 6.5.1. Company Overview
      2. 6.5.2. Product/Service Portfolio
      3. 6.5.3. eFlexfire LEDs Sales, Revenue, and Gross Margin
      4. 6.5.4. eFlexfire LEDs Revenue and Growth Rate
      5. 6.5.5. eFlexfire LEDs Market Share
      6. 6.5.6. Recent Initiatives, Funding/VC Activities, and Technological Innovations
    3. 6.6. Bay Inc.
      1. 6.6.1. Company Overview
      2. 6.6.2. Product/Service Portfolio
      3. 6.6.3. Bay Inc. Sales, Revenue, and Gross Margin
      4. 6.6.4. Bay Inc. Revenue and Growth Rate
      5. 6.6.5. Bay Inc. Market Share
      6. 6.6.6. Recent Initiatives, Funding/VC Activities, and Technological Innovations
      7. 6.7. eworldtrade.com
      8. 6.7.1. Company Overview
      9. 6.7.2. Product/Service Portfolio
        1. 6.7.3. eworldtrade.com Sales, Revenue, and Gross Margin
        2. 6.7.4. eworldtrade.com Revenue and Growth Rate
        3. 6.7.5. eworldtrade.com Market Share
      10. 6.7.6. Recent Initiatives, Funding/VC Activities, and Technological Innovations
    4. 6.8. IndiaMART InterMESH Ltd.
      1. 6.8.1. Company Overview
      2. 6.8.2. Product/Service Portfolio
      3. 6.8.3. IndiaMART InterMESH Ltd. Sales, Revenue, and Gross Margin
      4. 6.8.4. IndiaMART InterMESH Ltd. Revenue and Growth Rate
      5. 6.8.5. IndiaMART InterMESH Ltd. Market Share
      6. 6.8.6. Recent Initiatives, Funding/VC Activities, and Technological Innovations
    5. 6.9. KOMPASS
      1. 6.9.1. Company Overview
      2. 6.9.2. Product/Service Portfolio
      3. 6.9.3. KOMPASS Sales, Revenue, and Gross Margin
      4. 6.9.4. KOMPASS Revenue and Growth Rate
      5. 6.9.5. KOMPASS Market Share
      6. 6.9.6. Recent Initiatives, Funding/VC Activities, and Technological Innovations
    6. 6.10. Quill Lincolnshire, Inc.
      1. 6.10.1. Company Overview
      2. 6.10.2. Product/Service Portfolio
      3. 6.10.3. Quill Lincolnshire, Inc. Sales, Revenue, and Gross Margin
      4. 6.10.4. Quill Lincolnshire, Inc. Revenue and Growth Rate
      5. 6.10.5. Quill Lincolnshire, Inc. Market Share
      6. 6.10.6. Recent Initiatives, Funding/VC Activities, and Technological Innovations
  7. Chapter 7 Business-to-Business E-commerce — Industry Analysis
    1. 7.1. Introduction and Taxonomy
    2. 7.2. Business-to-Business E-commerce Market – Key Trends
      1. 7.2.1. Market Drivers
      2. 7.2.2. Market Restraints
      3. 7.2.3. Market Opportunities
    3. 7.3. Value Chain Analysis
    4. 7.4. Key Mandates and Regulations
    5. 7.5. Technology Roadmap and Timeline
    6. 7.6. Business-to-Business E-commerce Market – Attractiveness Analysis
      1. 7.6.1. By Sales Channel
      2. 7.6.2. By Application
      3. 7.6.3. By Region
  8. Chapter 8 Industrial Chain, Sourcing Strategy, and Downstream Buyers
    1. 8.1. Business-to-Business E-commerce Industrial Chain Analysis
    2. 8.2. Downstream Buyers
    3. 8.3. Distributors/Traders List
  9. Chapter 9 Marketing Strategy Analysis
    1. 9.1. Marketing Channel
    2. 9.2. Direct Marketing
    3. 9.3. Indirect Marketing
    4. 9.4. Marketing Channel Development Trends
    5. 9.5. Economic/Political Environmental Change
  10. Chapter 10 Report Conclusion & Key Insights
    1. 10.1. Key Insights from Primary Interviews & Surveys Respondents
    2. 10.2. Key Takeaways from Analysts, Consultants, and Industry Leaders
  11. Chapter 11 Research Approach & Methodology
    1. 11.1. Report Description
    2. 11.2. Research Scope
    3. 11.3. Research Methodology
      1. 11.3.1. Secondary Research
      2. 11.3.2. Primary Research
      3. 11.3.3. Statistical Models
        1. 11.3.3.1. Company Share Analysis Model
        2. 11.3.3.2. Revenue Based Modeling
      4. 11.3.4. Research Limitations

      List of Figures

      Fig.1	Product Picture of Business-to-Business E-commerce
      Fig.2	Global Business-to-Business E-commerce Market, 2016 – 2026 (USD Trillion)
      Fig.3	Global Business-to-Business E-commerce Market Absolute Revenue Opportunity, 2016 – 2026 (USD Trillion)
      Fig.4	Global Business-to-Business E-commerce Market Incremental Revenue Opportunity, 2020 – 2026 (USD Trillion)
      Fig.5	Global Business-to-Business E-commerce Market Share, by Sales Channel, 2020 & 2026 (USD Trillion)
      Fig.6	Global Premium Food Service Business-to-Business E-commerce Market, 2016 – 2026 (USD Trillion)
      Fig.7	Global Premium Food Service Business-to-Business E-commerce Market, 2016 – 2026 
      Fig.8	Global Non Premium Food Service Business-to-Business E-commerce Market, 2016 – 2026 (USD Trillion)
      Fig.9	Global Non Premium Food Service Business-to-Business E-commerce  Market, 2016 – 2026 
      Fig.10	Global B2B Business-to-Business E-commerce Market, 2016 – 2026 (USD Trillion)
      Fig.11	Global B2B Business-to-Business E-commerce  Market, 2016 – 2026 
      Fig.12	Global Business-to-Business E-commerce Market Share, by Application, 2020 & 2026 (USD Trillion)
      Fig.13	Global Business-to-Business E-commerce Market Share, by Application, 2020 & 2026
      Fig.14	Global Savory Business-to-Business E-commerce Market, 2016 – 2026 (USD Trillion)
      Fig.15	Global Savory Business-to-Business E-commerce  Market, 2016 – 2026 
      Fig.16	Global Sandwich Business-to-Business E-commerce Market, 2016 – 2026 (USD Trillion)
      Fig.17	Global Sandwich Business-to-Business E-commerce  Market, 2016 – 2026 
      Fig.18	Global Salad Dressings & Dip Business-to-Business E-commerce Market, 2016 – 2026 (USD Trillion)
      Fig.19	Global Salad Dressings & Dip Business-to-Business E-commerce  Market, 2016 – 2026 
      Fig.20	Global Baked Goods/Desserts Business-to-Business E-commerce Market, 2016 – 2026 (USD Trillion)
      Fig.21	Global Baked Goods/Desserts Business-to-Business E-commerce  Market, 2016 – 2026 
      Fig.22	Global Ice Creams & Smoothies Business-to-Business E-commerce Market, 2016 – 2026 (USD Trillion)
      Fig.23	Global Ice Creams & Smoothies Business-to-Business E-commerce  Market, 2016 – 2026 
      Fig.24	Global Business-to-Business E-commerce Market Share, by Region, 2020 & 2026 (USD Trillion)
      Fig.25	Global Business-to-Business E-commerce Market Share, by Region, 2020 & 2026
      Fig.26	North America Business-to-Business E-commerce Market, 2016 – 2026 (USD Trillion)
      Fig.27	North America Business-to-Business E-commerce Market, 2016 – 2026 
      Fig.28	U.S. Business-to-Business E-commerce Market, 2016 – 2026 (USD Trillion)
      Fig.29	U.S. Business-to-Business E-commerce  Market, 2016 – 2026 
      Fig.30	Canada Business-to-Business E-commerce Market, 2016 – 2026 (USD Trillion)
      Fig.31	Canada Business-to-Business E-commerce  Market, 2016 – 2026 
      Fig.32	Europe Business-to-Business E-commerce Market, 2016 – 2026 (USD Trillion)
      Fig.33	Europe Business-to-Business E-commerce  Market, 2016 – 2026 
      Fig.34	Germany Business-to-Business E-commerce Market, 2016 – 2026 (USD Trillion)
      Fig.35	Germany Business-to-Business E-commerce  Market, 2016 – 2026 
      Fig.36	France Business-to-Business E-commerce Market, 2016 – 2026 (USD Trillion)
      Fig.37	France Business-to-Business E-commerce  Market, 2016 – 2026 
      Fig.38	U.K. Business-to-Business E-commerce Market, 2016 – 2026 (USD Trillion)
      Fig.39	U.K. Business-to-Business E-commerce  Market, 2016 – 2026 
      Fig.40	Italy Business-to-Business E-commerce Market, 2016 – 2026 (USD Trillion)
      Fig.41	Italy Business-to-Business E-commerce  Market, 2016 – 2026 
      Fig.42	Spain Business-to-Business E-commerce Market, 2016 – 2026 (USD Trillion)
      Fig.43	Spain Business-to-Business E-commerce  Market, 2016 – 2026 
      Fig.44	Rest of Europe Business-to-Business E-commerce Market, 2016 – 2026 (USD Trillion)
      Fig.45	Rest of Europe Business-to-Business E-commerce  Market, 2016 – 2026 
      Fig.46	Asia Pacific Business-to-Business E-commerce Market, 2016 – 2026 (USD Trillion)
      Fig.47	Asia Pacific Business-to-Business E-commerce  Market, 2016 – 2026 
      Fig.48	China Business-to-Business E-commerce Market, 2016 – 2026 (USD Trillion)
      Fig.49	China Business-to-Business E-commerce  Market, 2016 – 2026 
      Fig.50	India Business-to-Business E-commerce Market, 2016-2026 (USD Trillion)
      Fig.51	India Business-to-Business E-commerce  Market, 2016 – 2026 
      Fig.52	Japan Business-to-Business E-commerce Market, 2016 – 2026 (USD Trillion)
      Fig.53	Japan Business-to-Business E-commerce  Market, 2016 – 2026 
      Fig.54	South Korea Business-to-Business E-commerce Market, 2016 – 2026 (USD Trillion)
      Fig.55	South Korea Business-to-Business E-commerce  Market, 2016 – 2026 
      Fig.56	South-East Asia Business-to-Business E-commerce Market, 2016 – 2026 (USD Trillion)
      Fig.57	South-East Asia Business-to-Business E-commerce  Market, 2016 – 2026 
      Fig.58	Rest of Asia Pacific Business-to-Business E-commerce Market, 2016 – 2026 (USD Trillion)
      Fig.59	Rest of Asia Pacific Business-to-Business E-commerce  Market, 2016 – 2026 
      Fig.60	Latin America Business-to-Business E-commerce Market, 2016 – 2026 (USD Trillion)
      Fig.61	Latin America Business-to-Business E-commerce  Market, 2016 – 2026 
      Fig.62	Brazil Business-to-Business E-commerce Market, 2016 – 2026 (USD Trillion)
      Fig.63	Brazil Business-to-Business E-commerce  Market, 2016 – 2026 
      Fig.64	Mexico Business-to-Business E-commerce Market, 2016 – 2026 (USD Trillion)
      Fig.65	Mexico Business-to-Business E-commerce  Market, 2016 – 2026 
      Fig.66	Rest of Latin America Business-to-Business E-commerce Market, 2016 – 2026 (USD Trillion)
      Fig.67	Rest of Latin America Business-to-Business E-commerce  Market, 2016 – 2026 
      Fig.68	Middle East & Africa Business-to-Business E-commerce Market, 2016 – 2026 (USD Trillion)
      Fig.69	Middle East & Africa Business-to-Business E-commerce  Market, 2016 – 2026 
      Fig.70	GCC Business-to-Business E-commerce Market, 2016 – 2026 (USD Trillion)
      Fig.71	GCC Business-to-Business E-commerce Market, 2016 – 2026 
      Fig.72	South Africa Business-to-Business E-commerce Market, 2016 – 2026 (USD Trillion)
      Fig.73	South Africa Business-to-Business E-commerce  Market, 2016 – 2026 
      Fig.74	Rest of Middle East & Africa Business-to-Business E-commerce Market, 2016 – 2026 (USD Trillion)
      Fig.75	Rest of Middle East & Africa Business-to-Business E-commerce Market, 2016 – 2026 
      Fig.76	Competitor Market Share – Revenue
      Fig.77	Daisy Brand LLC Revenue and Growth Rate
      Fig.78	Daisy Brand LLC Market Share
      Fig.79	Market Dynamics
      Fig.80	Global Business-to-Business E-commerce – Value Chain Analysis
      Fig.81	Key Mandates and Regulations
      Fig.82	Technology Roadmap and Timeline
      Fig.83	Market Attractiveness Analysis – By Sales Channel
      Fig.84	Market Attractiveness Analysis – By Application
      Fig.85	Market Attractiveness Analysis – By Region
      Fig.86	Business-to-Business E-commerce Industrial Chain Analysis
      Fig.87	Market Channels
      Fig.88	Marketing Channel Development Trend
      Fig.89	Growth in World Gross Product, 2008-2018
      

      List of Tables

      Table 1	Global Business-to-Business E-commerce Market, 2020 & 2026 (USD Trillion)
      Table 2	Global Business-to-Business E-commerce Market, by Sales Channel, 2016 – 2026 (USD Trillion)
      Table 3	Global Business-to-Business E-commerce Market, by Application, 2016 – 2026 (USD Trillion)
      Table 4	Global Business-to-Business E-commerce Market, by Application, 2016 – 2026 
      Table 5	Global Business-to-Business E-commerce Market, by Region, 2016 – 2026 (USD Trillion)
      Table 6	Global Business-to-Business E-commerce Market, by Region, 2016 – 2026 
      Table 7	North America Business-to-Business E-commerce Market, by Country, 2016 – 2026 (USD Trillion)
      Table 8	North America Business-to-Business E-commerce Market, by Country, 2016 – 2026 
      Table 9	North America Business-to-Business E-commerce Market, by Sales Channel, 2016 – 2026 (USD Trillion)
      Table 10 North America Business-to-Business E-commerce Market, by Sales Channel, 2016 – 2026 
      Table 11 North America Business-to-Business E-commerce Market, by Application, 2016 – 2026 (USD Trillion)
      Table 12 North America Business-to-Business E-commerce Market, by Application, 2016 – 2026 
      Table 13 Europe Business-to-Business E-commerce Market, by Country, 2016 – 2026 (USD Trillion)
      Table 14 Europe Business-to-Business E-commerce Market, by Country, 2016 – 2026 
      Table 15 Europe Business-to-Business E-commerce Market, by Sales Channel, 2016 – 2026 (USD Trillion)
      Table 16 Europe Business-to-Business E-commerce Market, by Sales Channel, 2016 – 2026 
      Table 17 Europe Business-to-Business E-commerce Market, by Application, 2016 – 2026 (USD Trillion)
      Table 18 Europe Business-to-Business E-commerce Market, by Application, 2016 – 2026 
      Table 19 Asia Pacific Business-to-Business E-commerce Market, by Country, 2016 – 2026 (USD Trillion)
      Table 20 Europe Business-to-Business E-commerce Market, by Country, 2016 – 2026 
      Table 21 Asia Pacific Business-to-Business E-commerce Market, by Sales Channel, 2016 – 2026 (USD Trillion)
      Table 22 Asia Pacific Business-to-Business E-commerce Market, by Sales Channel, 2016 – 2026 
      Table 23 Asia Pacific Business-to-Business E-commerce Market, by Application (Recipes), 2016 – 2026 (USD Trillion)
      Table 24 Asia Pacific Business-to-Business E-commerce Market, by Application, 2016 – 2026 
      Table 25 Latin America Business-to-Business E-commerce Market, by Country, 2016 – 2026 (USD Trillion)
      Table 26 Latin America Business-to-Business E-commerce Market, by Country, 2016 – 2026 
      Table 27 Latin America Business-to-Business E-commerce Market, by Sales Channel, 2016 – 2026 (USD Trillion)
      Table 28 Latin America Business-to-Business E-commerce Market, by Sales Channel, 2016 – 2026 
      Table 29 Latin America Business-to-Business E-commerce Market, by Application, 2016 – 2026 (USD Trillion)
      Table 30 Latin America Business-to-Business E-commerce Market, by Application, 2016 – 2026 
      Table 31 Middle East & Africa Business-to-Business E-commerce Market, by Country, 2016 – 2026 (USD Trillion)
      Table 32 Middle East & Africa Business-to-Business E-commerce Market, by Country, 2016 – 2026 
      Table 33 Middle East & Africa Business-to-Business E-commerce Market, by Sales Channel, 2016 – 2026 (USD Trillion)
      Table 34 Middle East & Africa Business-to-Business E-commerce Market, by Sales Channel, 2016 – 2026 
      Table 35 Middle East & Africa Business-to-Business E-commerce Market, by Application, 2016 – 2026 (USD Trillion)
      Table 36 Middle East & Africa Business-to-Business E-commerce Market, by Application, 2016 – 2026 
      Table 37 Global Business-to-Business E-commerce Market - Company Revenue Analysis, 2016 – 2019 (USD Trillion)
      Table 38 Global Business-to-Business E-commerce Market - Company Revenue Share Analysis, 2016 – 2019 (%)
      Table 39 Acquisitions and Mergers
      Table 40 Market Drivers – Impact Analysis
      Table 41 Market Restraints
      Table 42 Market Opportunities
      Table 43 Major Buyers of Business-to-Business E-commerce
      Table 44 Distributors/Traders of Business-to-Business E-commerce by Region
      

Industry Major Market Players

  • Flipkart.com
  • Amazon.com, Inc.
  • ChinaAseanTrade.com
  • DIYTrade.com
  • eFlexfire LEDs
  • Bay Inc.
  • eworldtrade.com
  • IndiaMART InterMESH Ltd.
  • KOMPASS
  • Quill Lincolnshire, Inc.