Search Market Research Report

Discover Our Latest Reports
Discover Our Featured Reports
Discover Top Selling Reports

Biosensors Market Size, Share Global Analysis Report, 2021 – 2026

report img

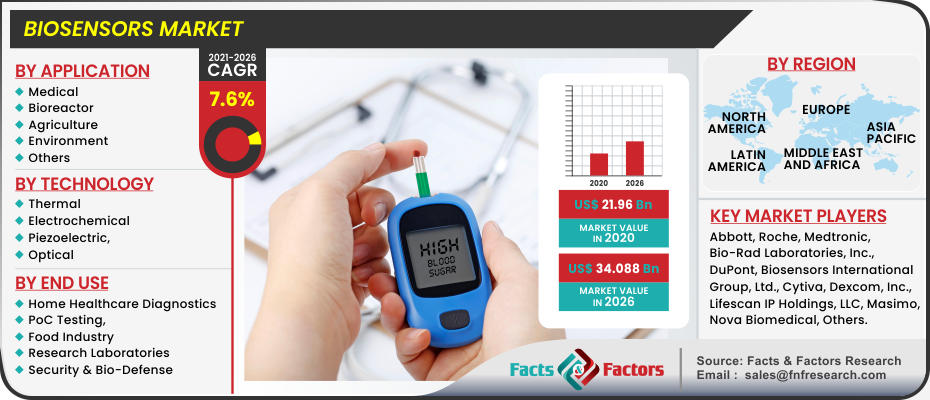
Biosensors Market By Application (Medical, Bioreactor, Agriculture, Environment and Others), By Technology (Thermal, Electrochemical, Piezoelectric and Optical), By End Use (Home Healthcare Diagnostics, PoC Testing, Food Industry and Research Laboratories, and Security & Bio-Defense): Global & Regional Industry Perspective, Comprehensive Analysis, and Forecast 2021 – 2026

Industry Insights

[210+ Pages Report] As per the Facts and Factors market research report, the global Biosensors market generated sales revenue of USD 21.96 Billion in 2020. Further, the Biosensors sales are expected to generate revenue of USD 34.088 Billion by the end of the year 2026, increasing at a CAGR of around 7.6% from 2021 to 2026.

logoMarket Overview

Biosensor device is used to identify the concentration or existence of biological constituents, like a biological structure or a microorganism. These sensors consist of a component that recognizes the analyte & produces a signal, a reader device, and a signal transducer. Additionally, the miniaturization of those biosensors has changed the traditional testing scenario in healthcare and in the medical sector. Medical biosensors are wont to diagnose blood glucose monitoring, cholesterol testing, drug discovery, pregnancy testing systems, and infectious diseases. These sensors are considered to be an important tool in the monitoring and detection of a huge variety of medical situations like cancer and diabetes.

Biosensors are analytical devices that incorporate biological-based sensing instruments, which are associated or integrated with physiochemical transducers. Biosensors aim to supply digital or electronic signals, which are proportional to chemical content and yield specific measurements. Myriad applications within the healthcare sector like cholesterol testing, blood sugar monitoring, pregnancy testing, and drug discovery are expected to impact the marketplace for biosensors, positively. These Biosensors convert a biological response into electrical signals. A biosensor, which may be a short sort of biological sensor, is an analytical device used for the detection of a chemical substance. In layman’s language, biosensors are wont to detect the presence and volume of biological substances. Biosensors are utilized in many end-user verticals just like the food and beverage industry. Here, biosensors are utilized in the fermentation process during the assembly of beer, soft drinks, and yogurts among others. Biosensors are often categorized into three parts because the first being analysis and production of an electrical signal, followed by the utilization of a sign transducer which ultimately sends the signal to the reader device. Biosensors are cost-efficient, are simple to use, and deliver fast results.

Biosensors Market

To know more about this report | Request Free Sample Copy

logoIndustry Growth Factor

The biosensors market is attributed to witnessing growth in the future. The demand for factors such as miniature diagnostic devices, the surging scope of application of wearable devices in the medical industry, and rapid technological advancements in biosensors is predicted to spice up market growth. The increasing unhealthy lifestyle, rising chronic diseases alongside an early and precise diagnosis of diseases is anticipated to propel market growth by the end of the day. Moreover, within the recent past, the increasing demand for cost-efficient, user-friendly and disposable devices with fast response have increased. Owing to the need for accurate and timely diagnosis of disease to successful operation them is anticipated to propel growth. The use of biosensors in agriculture to supply specific and rapid detection of various funguses as compared to the older techniques is anticipated to foster growth for biosensors in the forecast time frame. These sensors are adopted to diminish the loss of crops and livestock by bioterrorism and natural threats. The dives also are wont to measure pesticides concentrations, herbicides, and heavy metals. It also can be wont to forecast the occurrence of soil disease, which isn't possible with current technology, and thus it providing advanced and reliable ways for prevention and decontamination of soil disease at the initial phase. Factors like these are likely to contribute to market growth. Biosensors, due to their ability to assess health status, and disease onset and progression, are getting used extensively in-home healthcare by patients, and hence, are expected to spice upmarket growth over the forecast period. Furthermore, technological advancements, also as various non-medical-based applications are expected to reinforce the applicability of the marketplace for biosensors, thus promoting its growth. Furthermore, governmental initiatives aimed toward the event of genomics and proteomics are anticipated to fuel the expansion of the marketplace for biosensors over the forecast period. For instance, National Information and Communication Technology Australia are expected to advance its research on data processing, networks, and embedded systems to be utilized in this field. Additionally, the China government is investing financially large on its computing networks initiated by the Chinese Academy of Sciences and therefore the China National Grid supported by the Ministry of Science and Technology. In addition, most IT corporations also are heavily investing within the marketplace for biosensors. Investments from major IT players like Infosys, TCS, IBM, are expected to spice up market expansion. Thus, such favorable initiatives are expected to possess a positive impact on the market.

logoSegmentation Analysis

The study provides a decisive view of the global biosensors market by segmenting it based on application, technology, and end-use. The application segment is categorized into a medical, bioreactor, agriculture, environment, and others. thermal, electrochemical, piezoelectric, and optical are the technology segment of the global biosensors market. To offers better target customer analysis, our analyst further bifurcates end-use segment into home healthcare diagnostics, PoC testing, food industry, and research laboratories, and security & bio-defense.

logo Regional Analysis

Based on regions, the global biosensors market can be divided into five main regions namely North America, Europe, Latin America, Asia Pacific, and The Middle East, and Africa.

On the basis of geography, Asia Pacific is anticipated to unveil a significant growth opportunity during the forecast period. Due to the presence of unmet medical needs relating to target diseases like diabetes and cancer along with other infectious diseases and continuously improving healthcare expenditure in the region, are some factors likely to support the market growth of the Asia Pacific market.

logoReport Scope

Report Attribute

Details

Market Size in 2020

USD 21.96 Billion

Projected Market Size in 2026

USD 34.088 Billion

CAGR Growth Rate

7.6% CAGR

Base Year

2020

Forecast Years

2021-2026

Key Market Players

Abbott, Roche, Medtronic, Bio-Rad Laboratories, Inc., DuPont, Biosensors International Group, Ltd., Cytiva, Dexcom, Inc., Lifescan IP Holdings, LLC, Masimo, Nova Biomedical, Universal Biosensors, Conductive Technologies, EarlySense, Innovative Sensor Technology IST AG, LifeSignals, NeuroSky, Pinnacle Technology Inc., SD Biosensor, INnc. and VitalConnect among others.

Key Segment

By Application, By Technology, By End Use, and By Region

Major Regions Covered

North America, Europe, Asia Pacific, Latin America, and the Middle East & Africa

Purchase Options

Request customized purchase options to meet your research needs. Explore purchase options

logo Competitive Players

Some of the key players in the biosensors market are :

  • Abbott
  • Roche
  • Medtronic
  • Bio-Rad Laboratories Inc.
  • DuPont
  • Biosensors International Group Ltd.
  • Cytiva
  • Dexcom Inc.
  • Lifescan IP Holdings LLC
  • Masimo
  • Nova Biomedical
  • Universal Biosensors
  • Conductive Technologies
  • EarlySense
  • Innovative Sensor Technology IST AG
  • LifeSignals
  • NeuroSky
  • Pinnacle Technology Inc.
  • SD Biosensor INC.
  • VitalConnect 

logoThe global Biosensors Market is segmented as follows:

logoGlobal Biosensors Market - By Application:

  • Medical
  • Bioreactor
  • Agriculture
  • Environment
  • Others

logoGlobal Biosensors Market - By Technology:

  • Thermal
  • Electrochemical
  • Piezoelectric,
  • Optical

logoGlobal Biosensors Market - By End Use:

  • Home Healthcare Diagnostics
  • PoC Testing,
  • Food Industry
  • Research Laboratories
  • Security & Bio-Defense

logoGlobal Biosensors Market - By Region:

  • North America
    • The U.S.
    • Canada
  • Europe
    • France
    • The UK
    • Spain
    • Germany
    • Italy
    • Rest of Europe
  • Asia Pacific
    • China
    • Japan
    • India
    • South Korea
    • Southeast Asia
    • Rest of Asia Pacific
  • Latin America
    • Brazil
    • Mexico
    • Rest of Latin America
  • Middle East & Africa
    • GCC
    • South Africa
    • Rest of Middle East & Africa

Table of Content

  1. Chapter 1 Executive Summary
    1. 1.1. Introduction of Biosensors
    2. 1.2. Global Biosensors Market, 2020 & 2026 (USD Million)
    3. 1.3. Global Biosensors Market, 2016 – 2026 (USD Million)
    4. 1.4. Global Biosensors Market Absolute Revenue Opportunity, 2016 – 2026 (USD Million)
    5. 1.5. Global Biosensors Market Incremental Revenue Opportunity, 2020 – 2026 (USD Million)
    6. 1.6. Impacts on Biosensors Market
      1. 1.6.1. COVID-19 Impact on the Players
      2. 1.6.2. Business Strategies and Recommendations
  2. Chapter 2 Biosensors Market – Application Analysis
    1. 2.1. Global Biosensors Market – Application Overview
    2. 2.2. Global Biosensors Market Share, by Application, 2020 & 2026 (USD Million)
    3. 2.3. Medical
      1. 2.3.1. Global Medical Biosensors Market, 2016 – 2026 (USD Million)
    4. 2.4. Bioreactor
      1. 2.4.1. Global Bioreactor Biosensors Market, 2016 – 2026 (USD Million)
    5. 2.5. Agriculture
      1. 2.5.1. Global Agriculture Biosensors Market, 2016 – 2026 (USD Million)
    6. 2.6. Environment
      1. 2.6.1. Global Environment Biosensors Market, 2016 – 2026 (USD Million)
    7. 2.7. Others
      1. 2.7.1. Global Others Biosensors Market, 2016 – 2026 (USD Million)
  3. Chapter 3 Biosensors Market – Technology Analysis
    1. 3.1. Global Biosensors Market – Technology Overview
    2. 3.2. Global Biosensors Market Share, by Technology, 2020 & 2026 (USD Million)
    3. 3.3. Thermal
      1. 3.3.1. Global Thermal Biosensors Market, 2016 – 2026 (USD Million)
    4. 3.4. Electrochemical
      1. 3.4.1. Global Electrochemical Biosensors Market, 2016 – 2026 (USD Million)
    5. 3.5. Piezoelectric
      1. 3.5.1. Global Piezoelectric Biosensors Market, 2016 – 2026 (USD Million)
    6. 3.6. Optical
      1. 3.6.1. Global Optical Biosensors Market, 2016 – 2026 (USD Million)
  4. Chapter 4 Biosensors Market – End Use Analysis
    1. 4.1. Global Biosensors Market – End Use Overview
    2. 4.2. Global Biosensors Market Share, by End Use, 2020 & 2026 (USD Million)
    3. 4.3. Home Healthcare Diagnostics
      1. 4.3.1. Global Home Healthcare Diagnostics Biosensors Market, 2016 – 2026 (USD Million)
    4. 4.4. PoC Testing
      1. 4.4.1. Global PoC Testing Biosensors Market, 2016 – 2026 (USD Million)
    5. 4.5. Food Industry
      1. 4.5.1. Global Food Industry Biosensors Market, 2016 – 2026 (USD Million)
    6. 4.6. Research Laboratories
      1. 4.6.1. Global Research Laboratories Biosensors Market, 2016 – 2026 (USD Million)
    7. 4.7. Security & Bio-Defense
      1. 4.7.1. Global Security & Bio-Defense Biosensors Market, 2016 – 2026 (USD Million)
  5. Chapter 5 Biosensors Market – Regional Analysis
    1. 5.1. Global Biosensors Market Regional Overview
    2. 5.2. Global Biosensors Market Share, by Region, 2020 & 2026 (USD Million)
    3. 5.3. North America
      1. 5.3.1. North America Biosensors Market, 2016 – 2026 (USD Million)
        1. 5.3.1.1. North America Biosensors Market, by Country, 2016 - 2026 (USD Million)
      2. 5.3.2. North America Biosensors Market, by Application, 2016 – 2026
        1. 5.3.2.1. North America Biosensors Market, by Application, 2016 – 2026 (USD Million)
      3. 5.3.3. North America Biosensors Market, by Technology, 2016 – 2026
        1. 5.3.3.1. North America Biosensors Market, by Technology, 2016 – 2026 (USD Million)
      4. 5.3.4. North America Biosensors Market, by End Use, 2016 – 2026
        1. 5.3.4.1. North America Biosensors Market, by End Use, 2016 – 2026 (USD Million)
      5. 5.3.5. U.S.
        1. 5.3.5.1. U.S. Biosensors Market, 2016 – 2026 (USD Million)
      6. 5.3.6. Canada
        1. 5.3.6.1. Canada Biosensors Market, 2016 – 2026 (USD Million)
    4. 5.4. Europe
      1. 5.4.1. Europe Biosensors Market, 2016 – 2026 (USD Million)
        1. 5.4.1.1. Europe Biosensors Market, by Country, 2016 - 2026 (USD Million)
      2. 5.4.2. Europe Biosensors Market, by Application, 2016 – 2026
        1. 5.4.2.1. Europe Biosensors Market, by Application, 2016 – 2026 (USD Million)
      3. 5.4.3. Europe Biosensors Market, by Technology, 2016 – 2026
        1. 5.4.3.1. Europe Biosensors Market, by Technology, 2016 – 2026 (USD Million)
      4. 5.4.4. Europe Biosensors Market, by End Use, 2016 – 2026
        1. 5.4.4.1. Europe Biosensors Market, by End Use, 2016 – 2026 (USD Million)
      5. 5.4.5. Germany
        1. 5.4.5.1. Germany Biosensors Market, 2016 – 2026 (USD Million)
      6. 5.4.6. France
        1. 5.4.6.1. France Biosensors Market, 2016 – 2026 (USD Million)
      7. 5.4.7. U.K.
        1. 5.4.7.1. U.K. Biosensors Market, 2016 – 2026 (USD Million)
      8. 5.4.8. Italy
        1. 5.4.8.1. Italy Biosensors Market, 2016 – 2026 (USD Million)
      9. 5.4.9. Spain
        1. 5.4.9.1. Spain Biosensors Market, 2016 – 2026 (USD Million)
      10. 5.4.10. Rest of Europe
        1. 5.4.10.1. Rest of Europe Biosensors Market, 2016 – 2026 (USD Million)
    5. 5.5. Asia Pacific
      1. 5.5.1. Asia Pacific Biosensors Market, 2016 – 2026 (USD Million)
        1. 5.5.1.1. Asia Pacific Biosensors Market, by Country, 2016 - 2026 (USD Million)
      2. 5.5.2. Asia Pacific Biosensors Market, by Application, 2016 – 2026
        1. 5.5.2.1. Asia Pacific Biosensors Market, by Application, 2016 – 2026 (USD Million)
      3. 5.5.3. Asia Pacific Biosensors Market, by Technology, 2016 – 2026
        1. 5.5.3.1. Asia Pacific Biosensors Market, by Technology, 2016 – 2026 (USD Million)
      4. 5.5.4. Asia Pacific Biosensors Market, by End Use, 2016 – 2026
        1. 5.5.4.1. Asia Pacific Biosensors Market, by End Use, 2016 – 2026 (USD Million)
      5. 5.5.5. China
        1. 5.5.5.1. China Biosensors Market, 2016 – 2026 (USD Million)
      6. 5.5.6. Japan
        1. 5.5.6.1. Japan Biosensors Market, 2016 – 2026 (USD Million)
      7. 5.5.7. India
        1. 5.5.7.1. India Biosensors Market, 2016 – 2026 (USD Million)
      8. 5.5.8. South Korea
        1. 5.5.8.1. South Korea Biosensors Market, 2016 – 2026 (USD Million)
      9. 5.5.9. South-East Asia
        1. 5.5.9.1. South-East Asia Biosensors Market, 2016 – 2026 (USD Million)
      10. 5.5.10. Rest of Asia Pacific
        1. 5.5.10.1. Rest of Asia Pacific Biosensors Market, 2016 – 2026 (USD Million)
    6. 5.6. Latin America
      1. 5.6.1. Latin America Biosensors Market, 2016 – 2026 (USD Million)
        1. 5.6.1.1. Latin America Biosensors Market, by Country, 2016 - 2026 (USD Million)
      2. 5.6.2. Latin America Biosensors Market, by Application, 2016 – 2026
        1. 5.6.2.1. Latin America Biosensors Market, by Application, 2016 – 2026 (USD Million)
      3. 5.6.3. Latin America Biosensors Market, by Technology, 2016 – 2026
        1. 5.6.3.1. Latin America Biosensors Market, by Technology, 2016 – 2026 (USD Million)
      4. 5.6.4. Latin America Biosensors Market, by End Use, 2016 – 2026
        1. 5.6.4.1. Latin America Biosensors Market, by End Use, 2016 – 2026 (USD Million)
      5. 5.6.5. Brazil
        1. 5.6.5.1. Brazil Biosensors Market, 2016 – 2026 (USD Million)
      6. 5.6.6. Mexico
        1. 5.6.6.1. Mexico Biosensors Market, 2016 – 2026 (USD Million)
      7. 5.6.7. Rest of Latin America
        1. 5.6.7.1. Rest of Latin America Biosensors Market, 2016 – 2026 (USD Million)
    7. 5.7. The Middle-East and Africa
      1. 5.7.1. The Middle-East and Africa Biosensors Market, 2016 – 2026 (USD Million)
        1. 5.7.1.1. The Middle-East and Africa Biosensors Market, by Country, 2016 - 2026 (USD Million)
      2. 5.7.2. The Middle-East and Africa Biosensors Market, by Application, 2016 – 2026
        1. 5.7.2.1. The Middle-East and Africa Biosensors Market, by Application, 2016 – 2026 (USD Million)
      3. 5.7.3. The Middle-East and Africa Biosensors Market, by Technology, 2016 – 2026
        1. 5.7.3.1. The Middle-East and Africa Biosensors Market, by Technology, 2016 – 2026 (USD Million)
      4. 5.7.4. The Middle-East and Africa Biosensors Market, by End Use, 2016 – 2026
        1. 5.7.4.1. The Middle-East and Africa Biosensors Market, by End Use, 2016 – 2026 (USD Million)
      5. 5.7.5. GCC Countries
        1. 5.7.5.1. GCC Countries Biosensors Market, 2016 – 2026 (USD Million)
      6. 5.7.6. South Africa
        1. 5.7.6.1. South Africa Biosensors Market, 2016 – 2026 (USD Million)
      7. 5.7.7. Rest of Middle-East Africa
        1. 5.7.7.1. Rest of Middle-East Africa Biosensors Market, 2016 – 2026 (USD Million)
  6. Chapter 6 Biosensors Market – Competitive Landscape
    1. 6.1. Competitor Market Share – Revenue
    2. 6.2. Market Concentration Rate Analysis, Top 3 and Top 5 Players
    3. 6.3. Strategic Developments
      1. 6.3.1. Acquisitions and Mergers
      2. 6.3.2. New Products
      3. 6.3.3. Research & Development Activities
  7. Chapter 7 Company Profiles
    1. 7.1. Abbott
      1. 7.1.1. Company Overview
      2. 7.1.2. Product/Service Portfolio
      3. 7.1.3. Abbott Sales, Revenue, and Gross Margin
      4. 7.1.4. Abbott Revenue and Growth Rate
      5. 7.1.5. Abbott Market Share
      6. 7.1.6. Recent Initiatives, Funding/VC Activities, and Technological Innovations
    2. 7.2. Roche
      1. 7.2.1. Company Overview
      2. 7.2.2. Product/Service Portfolio
      3. 7.2.3. Roche Sales, Revenue, and Gross Margin
      4. 7.2.4. Roche Revenue and Growth Rate
      5. 7.2.5. Roche Market Share
      6. 7.2.6. Recent Initiatives, Funding/VC Activities, and Technological Innovations
    3. 7.3. Medtronic
      1. 7.3.1. Company Overview
      2. 7.3.2. Product/Service Portfolio
      3. 7.3.3. Medtronic Sales, Revenue, and Gross Margin
      4. 7.3.4. Medtronic Revenue and Growth Rate
      5. 7.3.5. Medtronic Market Share
      6. 7.3.6. Recent Initiatives, Funding/VC Activities, and Technological Innovations
    4. 7.4. Bio-Rad Laboratories, Inc.
      1. 7.4.1. Company Overview
      2. 7.4.2. Product/Service Portfolio
      3. 7.4.3. Bio-Rad Laboratories, Inc. Sales, Revenue, and Gross Margin
      4. 7.4.4. Bio-Rad Laboratories, Inc. Revenue and Growth Rate
      5. 7.4.5. Bio-Rad Laboratories, Inc. Market Share
      6. 7.4.6. Recent Initiatives, Funding/VC Activities, and Technological Innovations
    5. 7.5. DuPont
      1. 7.5.1. Company Overview
      2. 7.5.2. Product/Service Portfolio
      3. 7.5.3. DuPont Sales, Revenue, and Gross Margin
      4. 7.5.4. DuPont Revenue and Growth Rate
      5. 7.5.5. DuPont Market Share
      6. 7.5.6. Recent Initiatives, Funding/VC Activities, and Technological Innovations
    6. 7.6. Biosensors International Group, Ltd.
      1. 7.6.1. Company Overview
      2. 7.6.2. Product/Service Portfolio
      3. 7.6.3. Biosensors International Group, Ltd. Sales, Revenue, and Gross Margin
      4. 7.6.4. Biosensors International Group, Ltd. Revenue and Growth Rate
      5. 7.6.5. Biosensors International Group, Ltd. Market Share
      6. 7.6.6. Recent Initiatives, Funding/VC Activities, and Technological Innovations
    7. 7.7. Cytiva
      1. 7.7.1. Company Overview
      2. 7.7.2. Product/Service Portfolio
      3. 7.7.3. Cytiva Sales, Revenue, and Gross Margin
      4. 7.7.4. Cytiva Revenue and Growth Rate
      5. 7.7.5. Cytiva Market Share
      6. 7.7.6. Recent Initiatives, Funding/VC Activities, and Technological Innovations
    8. 7.8. Dexcom, Inc.
      1. 7.8.1. Company Overview
      2. 7.8.2. Product/Service Portfolio
      3. 7.8.3. Dexcom, Inc. Sales, Revenue, and Gross Margin
      4. 7.8.4. Dexcom, Inc. Revenue and Growth Rate
      5. 7.8.5. Dexcom, Inc. Market Share
      6. 7.8.6. Recent Initiatives, Funding/VC Activities, and Technological Innovations
    9. 7.9. Lifescan IP Holdings, LLC
      1. 7.9.1. Company Overview
      2. 7.9.2. Product/Service Portfolio
      3. 7.9.3. Lifescan IP Holdings, LLC Sales, Revenue, and Gross Margin
      4. 7.9.4. Lifescan IP Holdings, LLC Revenue and Growth Rate
      5. 7.9.5. Lifescan IP Holdings, LLC Market Share
      6. 7.9.6. Recent Initiatives, Funding/VC Activities, and Technological Innovations
    10. 7.10. Masimo
      1. 7.10.1. Company Overview
      2. 7.10.2. Product/Service Portfolio
      3. 7.10.3. Masimo Sales, Revenue, and Gross Margin
      4. 7.10.4. Masimo Revenue and Growth Rate
      5. 7.10.5. Masimo Market Share
      6. 7.10.6. Recent Initiatives, Funding/VC Activities, and Technological Innovations
    11. 7.11. Nova Biomedical
      1. 7.11.1. Company Overview
      2. 7.11.2. Product/Service Portfolio
      3. 7.11.3. Nova Biomedical Sales, Revenue, and Gross Margin
      4. 7.11.4. Nova Biomedical Revenue and Growth Rate
      5. 7.11.5. Nova Biomedical Market Share
      6. 7.11.6. Recent Initiatives, Funding/VC Activities, and Technological Innovations
    12. 7.12. Universal Biosensors
      1. 7.12.1. Company Overview
      2. 7.12.2. Product/Service Portfolio
      3. 7.12.3. Universal Biosensors Sales, Revenue, and Gross Margin
      4. 7.12.4. Universal Biosensors Revenue and Growth Rate
      5. 7.12.5. Universal Biosensors Market Share
      6. 7.12.6. Recent Initiatives, Funding/VC Activities, and Technological Innovations
    13. 7.13. Conductive Technologies
      1. 7.13.1. Company Overview
      2. 7.13.2. Product/Service Portfolio
      3. 7.13.3. Conductive Technologies Sales, Revenue, and Gross Margin
      4. 7.13.4. Conductive Technologies Revenue and Growth Rate
      5. 7.13.5. Conductive Technologies Market Share
      6. 7.13.6. Recent Initiatives, Funding/VC Activities, and Technological Innovations
    14. 7.14. EarlySense
      1. 7.14.1. Company Overview
      2. 7.14.2. Product/Service Portfolio
      3. 7.14.3. EarlySense Sales, Revenue, and Gross Margin
      4. 7.14.4. EarlySense Revenue and Growth Rate
      5. 7.14.5. EarlySense Market Share
      6. 7.14.6. Recent Initiatives, Funding/VC Activities, and Technological Innovations
    15. 7.15. Innovative Sensor Technology IST AG
      1. 7.15.1. Company Overview
      2. 7.15.2. Product/Service Portfolio
      3. 7.15.3. Innovative Sensor Technology IST AG Sales, Revenue, and Gross Margin
      4. 7.15.4. Innovative Sensor Technology IST AG Revenue and Growth Rate
      5. 7.15.5. Innovative Sensor Technology IST AG Market Share
      6. 7.15.6. Recent Initiatives, Funding/VC Activities, and Technological Innovations
    16. 7.16. LifeSignals
      1. 7.16.1. Company Overview
      2. 7.16.2. Product/Service Portfolio
      3. 7.16.3. LifeSignals Sales, Revenue, and Gross Margin
      4. 7.16.4. LifeSignals Revenue and Growth Rate
      5. 7.16.5. LifeSignals Market Share
      6. 7.16.6. Recent Initiatives, Funding/VC Activities, and Technological Innovations
    17. 7.17. NeuroSky
      1. 7.17.1. Company Overview
      2. 7.17.2. Product/Service Portfolio
      3. 7.17.3. NeuroSky Sales, Revenue, and Gross Margin
      4. 7.17.4. NeuroSky Revenue and Growth Rate
      5. 7.17.5. NeuroSky Market Share
      6. 7.17.6. Recent Initiatives, Funding/VC Activities, and Technological Innovations
    18. 7.18. Pinnacle Technology Inc.
      1. 7.18.1. Company Overview
      2. 7.18.2. Product/Service Portfolio
      3. 7.18.3. Pinnacle Technology Inc. Sales, Revenue, and Gross Margin
      4. 7.18.4. Pinnacle Technology Inc. Revenue and Growth Rate
      5. 7.18.5. Pinnacle Technology Inc. Market Share
      6. 7.18.6. Recent Initiatives, Funding/VC Activities, and Technological Innovations
    19. 7.19. SD Biosensor, Inc.
      1. 7.19.1. Company Overview
      2. 7.19.2. Product/Service Portfolio
      3. 7.19.3. SD Biosensor, Inc. Sales, Revenue, and Gross Margin
      4. 7.19.4. SD Biosensor, Inc. Revenue and Growth Rate
      5. 7.19.5. SD Biosensor, Inc. Market Share
      6. 7.19.6. Recent Initiatives, Funding/VC Activities, and Technological Innovations
    20. 7.20. VitalConnect
      1. 7.20.1. Company Overview
      2. 7.20.2. Product/Service Portfolio
      3. 7.20.3. VitalConnect Sales, Revenue, and Gross Margin
      4. 7.20.4. VitalConnect Revenue and Growth Rate
      5. 7.20.5. VitalConnect Market Share
      6. 7.20.6. Recent Initiatives, Funding/VC Activities, and Technological Innovations
  8. Chapter 8 Biosensors — Industry Analysis
    1. 8.1. Introduction and Taxonomy
    2. 8.2. Biosensors Market – Key Trends
      1. 8.2.1. Market Drivers
      2. 8.2.2. Market Restraints
      3. 8.2.3. Market Opportunities
    3. 8.3. Porter’s Five Forces Model
      1. 8.3.1. Bargaining Power of Buyers
      2. 8.3.2. Bargaining Power of Suppliers
      3. 8.3.3. Threat of Substitute
      4. 8.3.4. Threat of New Entrants
      5. 8.3.5. Rivalry among Existing Competitors
    4. 8.4. PESTEL Analysis
    5. 8.5. Key Mandates and Regulations
    6. 8.6. Technology Roadmap and Timeline
    7. 8.7. Biosensors Market – Attractiveness Analysis
      1. 8.7.1. By Application
      2. 8.7.2. By Technology
      3. 8.7.3. By End Use
      4. 8.7.4. By Region
  9. Chapter 9 Report Conclusion & Key Insights
    1. 9.1. Key Insights from Primary Interviews & Surveys Respondents
    2. 9.2. Key Takeaways from Analysts, Consultants, and Industry Leaders
  10. Chapter 10 Research Approach & Methodology
    1. 10.1. Report Description
    2. 10.2. Research Scope
    3. 10.3. Research Methodology
      1. 10.3.1. Secondary Research
      2. 10.3.2. Primary Research
      3. 10.3.3. Statistical Models
        1. 10.3.3.1. Company Share Analysis Model
        2. 10.3.3.2. Revenue Based Modeling
      4. 10.3.4. Research Limitations

      List of Figures

      Fig.1 Product Picture of Biosensors
      Fig.2 Global Biosensors Market, 2016 – 2026 (USD Million)
      Fig.3 Global Biosensors Market Absolute Revenue Opportunity, 2016 – 2026 (USD Million)
      Fig.4 Global Biosensors Market Incremental Revenue Opportunity, 2020 – 2026 (USD Million)
      Fig.5 COVID-19 Impacts on Biosensors
      Fig.6 COVID-19 Impact on the Players
      Fig.7 Business Strategies and Recommendations
      Fig.8 Global Biosensors Market Share, by Application, 2020 & 2026 (USD Million)
      Fig.9 Global Medical Biosensors Market, 2016 – 2026 (USD Million)
      Fig.10 Global Bioreactor Biosensors Market, 2016 – 2026 (USD Million)
      Fig.11 Global Agriculture Biosensors Market, 2016 – 2026 (USD Million)
      Fig.12 Global Environment Biosensors Market, 2016 – 2026 (USD Million)
      Fig.13 Global Others Biosensors Market, 2016 – 2026 (USD Million)
      Fig.14 Global Biosensors Market Share, by Technology, 2020 & 2026 (USD Million)
      Fig.15 Global Thermal Biosensors Market, 2016 – 2026 (USD Million)
      Fig.16 Global Electrochemical Biosensors Market, 2016 – 2026 (USD Million)
      Fig.17 Global Piezoelectric Biosensors Market, 2016 – 2026 (USD Million)
      Fig.18 Global Optical Biosensors Market, 2016 – 2026 (USD Million)
      Fig.19 Global Biosensors Market Share, by End Use, 2020 & 2026 (USD Million)
      Fig.20 Global Home Healthcare Diagnostics Biosensors Market, 2016 – 2026 (USD Million)
      Fig.21 Global PoC Testing Biosensors Market, 2016 – 2026 (USD Million)
      Fig.22 Global Food Industry Biosensors Market, 2016 – 2026 (USD Million)
      Fig.23 Global Research Laboratories Biosensors Market, 2016 – 2026 (USD Million)
      Fig.24 Global Security & Bio-Defense Biosensors Market, 2016 – 2026 (USD Million)
      Fig.25 Global Biosensors Market Share, by Region, 2020 & 2026 (USD Million)
      Fig.26 North America Biosensors Market, 2016 – 2026 (USD Million)
      Fig.27 U.S. Biosensors Market, 2016 – 2026 (USD Million)
      Fig.28 Canada Biosensors Market, 2016 – 2026 (USD Million)
      Fig.29 Europe Biosensors Market, 2016 – 2026 (USD Million)
      Fig.30 Germany Biosensors Market, 2016 – 2026 (USD Million)
      Fig.31 France Biosensors Market, 2016 – 2026 (USD Million)
      Fig.32 U.K. Biosensors Market, 2016 – 2026 (USD Million)
      Fig.33 Italy Biosensors Market, 2016 – 2026 (USD Million)
      Fig.34 Spain Biosensors Market, 2016 – 2026 (USD Million)
      Fig.35 Rest of Europe Biosensors Market, 2016 – 2026 (USD Million)
      Fig.36 Asia Pacific Biosensors Market, 2016 – 2026 (USD Million)
      Fig.37 China Biosensors Market, 2016 – 2026 (USD Million)
      Fig.38 Japan Biosensors Market, 2016 – 2026 (USD Million)
      Fig.39 India Biosensors Market, 2016 – 2026 (USD Million)
      Fig.40 South Korea Biosensors Market, 2016 – 2026 (USD Million)
      Fig.41 South-East Asia Biosensors Market, 2016 – 2026 (USD Million)
      Fig.42 Rest of Asia Pacific Biosensors Market, 2016 – 2026 (USD Million)
      Fig.43 Latin America Biosensors Market, 2016 – 2026 (USD Million)
      Fig.44 Brazil Biosensors Market, 2016 – 2026 (USD Million)
      Fig.45 Mexico Biosensors Market, 2016 – 2026 (USD Million)
      Fig.46 Rest of Latin America Biosensors Market, 2016 – 2026 (USD Million)
      Fig.47 The Middle-East and Africa Biosensors Market, 2016 – 2026 (USD Million)
      Fig.48 GCC Countries Biosensors Market, 2016 – 2026 (USD Million)
      Fig.49 South Africa Biosensors Market, 2016 – 2026 (USD Million)
      Fig.50 Rest of Middle-East Africa Biosensors Market, 2016 – 2026 (USD Million)
      Fig.51 Competitor Market Share – Revenue
      Fig.52 Abbott Revenue and Growth Rate
      Fig.53 Abbott Market Share
      Fig.54 Roche Revenue and Growth Rate
      Fig.55 Roche Market Share
      Fig.56 Medtronic Revenue and Growth Rate
      Fig.57 Medtronic Market Share
      Fig.58 Bio-Rad Laboratories, Inc. Revenue and Growth Rate
      Fig.59 Bio-Rad Laboratories, Inc. Market Share
      Fig.60 DuPont Revenue and Growth Rate
      Fig.61 DuPont Market Share
      Fig.62 Biosensors International Group, Ltd. Revenue and Growth Rate
      Fig.63 Biosensors International Group, Ltd. Market Share
      Fig.64 Cytiva Revenue and Growth Rate
      Fig.65 Cytiva Market Share
      Fig.66 Dexcom, Inc. Revenue and Growth Rate
      Fig.67 Dexcom, Inc. Market Share
      Fig.68 Lifescan IP Holdings, LLC Revenue and Growth Rate
      Fig.69 Lifescan IP Holdings, LLC Market Share
      Fig.70 Masimo Revenue and Growth Rate
      Fig.71 Masimo Market Share
      Fig.72 Nova Biomedical Revenue and Growth Rate
      Fig.73 Nova Biomedical Market Share
      Fig.74 Universal Biosensors Revenue and Growth Rate
      Fig.75 Universal Biosensors Market Share
      Fig.76 Conductive Technologies Revenue and Growth Rate
      Fig.77 Conductive Technologies Market Share
      Fig.78 EarlySense Revenue and Growth Rate
      Fig.79 EarlySense Market Share
      Fig.80 Innovative Sensor Technology IST AG Revenue and Growth Rate
      Fig.81 Innovative Sensor Technology IST AG Market Share
      Fig.82 LifeSignals Revenue and Growth Rate
      Fig.83 LifeSignals Market Share
      Fig.84 NeuroSky Revenue and Growth Rate
      Fig.85 NeuroSky Market Share
      Fig.86 Pinnacle Technology Inc. Revenue and Growth Rate
      Fig.87 Pinnacle Technology Inc. Market Share
      Fig.88 SD Biosensor, Inc. Revenue and Growth Rate
      Fig.89 SD Biosensor, Inc. Market Share
      Fig.90 VitalConnect Revenue and Growth Rate
      Fig.91 VitalConnect Market Share
      Fig.92 Market Dynamics
      Fig.93 PESTEL Analysis
      Fig.94 Key Mandates and Regulations
      Fig.95 Technology Roadmap and Timeline
      Fig.96 Market Attractiveness Analysis – By Application
      Fig.97 Market Attractiveness Analysis – By Technology
      Fig.98 Market Attractiveness Analysis – By End Use
      Fig.99 Market Attractiveness Analysis – By Region
      

      List of Tables

      	
      Table 1 Global Biosensors Market, 2020 & 2026 (USD Million)
      Table 2 Global Biosensors Market, by Application, 2016 – 2026 (USD Million)
      Table 3 Global Biosensors Market, by Technology, 2016 – 2026 (USD Million)
      Table 4 Global Biosensors Market, by End Use, 2016 – 2026 (USD Million)
      Table 5 Global Biosensors Market, by Region, 2016 – 2026 (USD Million)
      Table 6 North America Biosensors Market, by Country, 2016 – 2026 (USD Million)
      Table 7 North America Biosensors Market, by Application, 2016 – 2026 (USD Million)
      Table 8 North America Biosensors Market, by Technology, 2016 – 2026 (USD Million)
      Table 9 North America Biosensors Market, by End Use, 2016 – 2026 (USD Million)
      Table 10 Europe Biosensors Market, by Country, 2016 – 2026 (USD Million)
      Table 11 Europe Biosensors Market, by Application, 2016 – 2026 (USD Million)
      Table 12 Europe Biosensors Market, by Technology, 2016 – 2026 (USD Million)
      Table 13 Europe Biosensors Market, by End Use, 2016 – 2026 (USD Million)
      Table 14 Asia Pacific Biosensors Market, by Country, 2016 – 2026 (USD Million)
      Table 15 Asia Pacific Biosensors Market, by Application, 2016 – 2026 (USD Million)
      Table 16 Asia Pacific Biosensors Market, by Technology, 2016 – 2026 (USD Million)
      Table 17 Asia Pacific Biosensors Market, by End Use, 2016 – 2026 (USD Million)
      Table 18 Latin America Biosensors Market, by Country, 2016 – 2026 (USD Million)
      Table 19 Latin America Biosensors Market, by Application, 2016 – 2026 (USD Million)
      Table 20 Latin America Biosensors Market, by Technology, 2016 – 2026 (USD Million)
      Table 21 Latin America Biosensors Market, by End Use, 2016 – 2026 (USD Million)
      Table 22 The Middle-East and Africa Biosensors Market, by Country, 2016 – 2026 (USD Million)
      Table 23 The Middle-East and Africa Biosensors Market, by Application, 2016 – 2026 (USD Million)
      Table 24 The Middle-East and Africa Biosensors Market, by Technology, 2016 – 2026 (USD Million)
      Table 25 The Middle-East and Africa Biosensors Market, by End Use, 2016 – 2026 (USD Million)
      Table 26 Global Biosensors Market - Company Revenue Analysis, 2016 – 2020 (USD Million)
      Table 27 Global Biosensors Market - Company Revenue Share Analysis, 2016 – 2020 (%)
      Table 28 Acquisitions and Mergers
      Table 29 Market Drivers – Impact Analysis
      Table 30 Market Restraints
      Table 31 Market Opportunities
      

Industry Major Market Players

  • Abbott
  • Roche
  • Medtronic
  • Bio-Rad Laboratories Inc.
  • DuPont
  • Biosensors International Group Ltd.
  • Cytiva
  • Dexcom Inc.
  • Lifescan IP Holdings
  • LLC
  • Masimo
  • Nova Biomedical
  • Universal Biosensors
  • Conductive Technologies
  • EarlySense
  • Innovative Sensor Technology IST AG
  • LifeSignals
  • NeuroSky
  • Pinnacle Technology Inc.
  • SD Biosensor
  • INnc.
  • VitalConnect