Search Market Research Report

Discover Our Latest Reports
Discover Our Featured Reports
Discover Top Selling Reports

Biliary Stents Market Size, Share Global Analysis Report, , 2020 – 2026

report img

Biliary Stents Market by Material, (Metal, and Plastic), by Applications (Malignant Obstruction, Biliary Leaks, Benign Biliary Structures, Others), by End-user (Diagnostic Laboratories, Hospitals, Ambulance Surgical Centres, Speciality Clinics, Research and Academic, Institutes, Others), and By Region: Global Industry Perspective, Comprehensive Analysis, and Forecast, 2020 – 2026

Industry Insights

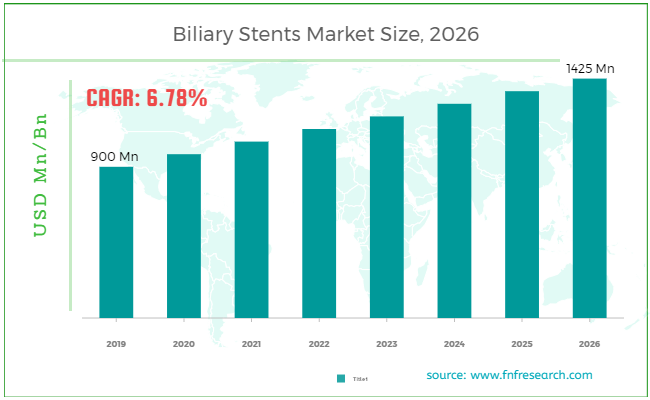
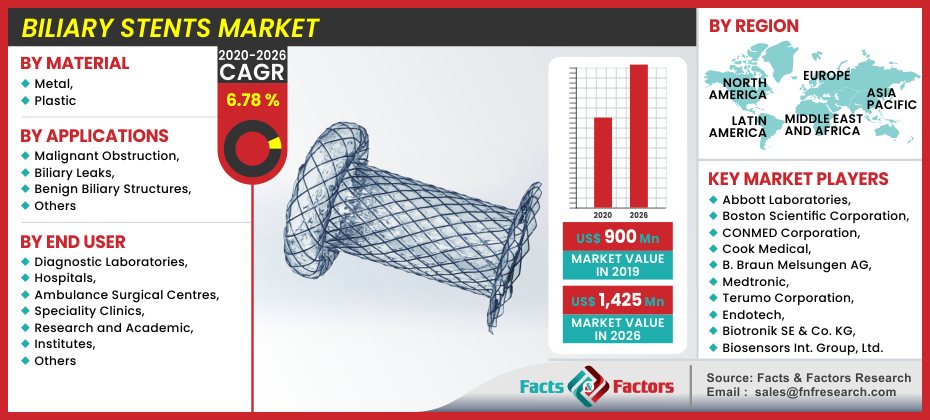
[195+ Pages Report] According to the report published by Facts and Factors, the global Biliary Stents market was valued at approximately USD 900 Million in 2019 and is expected to generate revenue of around USD 1,425 Million by the end of 2026, growing at a CAGR of around 6.78 % between 2020 and 2026.

global-biliary-stents-market-size

To know more about this report | Request Free Sample Copy

logoMarket Overview      

Biliary stenting is commonly used to treat benign biliary disorders or to relieve the symptoms of malignant obstruction. The most significant recent developments have been linked to self-expandable metal stents (SEMSs), which are now available in a wide range of designs, and treatment techniques. Biliary stents are used to aid bile drainage into the digestive tract, most often in the treatment of malignant biliary obstruction but also in benign cases such as biliary fistulas or benign biliary strictures. Both biliary SEMS are made of metal alloys such as nitinol or Elgiloy and are either cut from a metal cylinder or braided from metal wires.

The key characteristics that distinguish different types of SEMS are price, shortening ratio, radiopacity, covering, radial force, versatility, mesh size, anchoring mechanisms, and end design. SEMS models have advanced significantly in the last decade. Polyethylene and Teflon are used to make plastic biliary stents. These come in several configurations. Companies have improved stents to reduce biofilm formation and thereby increase patency time. These modifications involve coating with advanced material and windsock distal design.

Plastic stents are usually radiopaque and are sold in conjunction with introducer kits. Because of the increased diameter of the stent, SEMS gives advantages in terms of minimizing chronic obstruction and increasing patency length. Few self-expanding metal stents are fitted with retrieval loops, such as wall flex, that make repositioning and removal easier after the initial placement.

logoIndustry Growth Factors

The rising geriatric population across the globe has increased the demand for stents. The world's population is aging: older people are rising in number and constitute a growing share of the population in almost every region, with consequences for nearly every sector of society, including labour and financial markets, demand for goods and services such as housing, transportation, and social security, as well as family structures and intergenerational relations.

According to UN Report on World Population of Ageing, “The older population of the developing regions is growing much faster than in the developed regions. Consequently, the developing regions are home to a growing share of the world’s older population In 1980, the developing regions were home to 56 percent of persons aged 60 years or over. In 2017, over two-thirds of the world’s older persons lived in developing regions. Between 2017 and 2050, the number of persons aged 60 years or over in developing regions is expected to increase more than twofold, from 652 million to 1.7 billion, whereas the more developed regions are projected to see a 38% increase in the number of older persons over that period, from 310 million persons aged 60 years or over in 2017 to 427 million in 2050. Projections indicate that in 2050, 79% of the world’s population aged 60 or over will be living in the developing regions.”

The global prevalence of biliary diseases is driving the biliary stents market. The rise in biliary disease surgical procedures is expected to fuel the global demand for biliary stents. The increased use of alternatives in biliary procedures is expected to restrain the demand for biliary stents. The high cost of biliary stent implant procedures is also harming business development. Further studies into how to extend the patency span of plastic and metal stents may be a research highlight shortly. Companies are working on Bi degradable stents and more research on it is being carried out around the globe.

Biliary Stents Market

To know more about this report | Request Free Sample Copy

logoSegmentation Analysis

The global Biliary Stents market is segmented based on material as metal, and plastic. The plastic segment is expected to grow in the near future due to its low cost and ease of insertion and removal during surgeries. Due to the high price factor, self-expanding metal stents may be the second sub-segment of the biliary stent form.

By application, the market is bifurcated as malignant obstruction, biliary leaks, benign biliary strictures, and others. Because of their prevalence and a lack of alternatives to biliary stent insertion, the malignant obstruction, and benign biliary stricture segments are expected to grow rapidly during the forecast era.

By end-user, the market is divided into diagnostic laboratories, hospitals, ambulance surgical centers, specialty clinics, research and academic, institutes, and others.

logoReport Scope

Report Attribute

Details

Market Size in 2019

USD 900 Million

Projected Market Size in 2026

USD 1,425 Million

Growth Rate

CAGR 6.78%

Base Year

2019

Forecast Years

2020–2026

Key Market Players

Abbott Laboratories, Boston Scientific Corporation, CONMED Corporation, Cook Medical, B. Braun Melsungen AG, Medtronic, Terumo Corporation, Endotech, Biotronik SE & Co. KG, Biosensors International Group, Ltd.

Key Segment

By Material, By Application, By End-user, and By Region

Major Regions Covered

North America, Europe, Asia Pacific, Latin America, and the Middle East & Africa

Purchase Options

Request customized purchase options to meet your research needs. Explore purchase options

logo Regional Analysis

North America is anticipated to have the largest share in the biliary stent market and the reason for it is the robust health infrastructure in the region due to which people of the countries have easier accessibility to hospital services. Moreover, as more and more people are covered under medical insurance, super specialty treatments to cure the disease are increasing. Further, ongoing research on biodegradable stents is also lending a fillip to the growth of the market.

Similarly, the European region also has accessible medical facilities and a high incidence of the geriatric population which is likely to increase the demand for stents in the market. As the medical facility in the APAC region is increasing, The proportion of the geriatric population and the sedentary lifestyle of youth is expected to increase the demand for biliary stents in the market.

logo Competitive Landscape

  • Abbott Laboratories
  • Boston Scientific Corporation
  • CONMED Corporation
  • Cook Medical
  • B. Braun Melsungen AG
  • Medtronic
  • Terumo Corporation
  • Endotech
  • Biotronik SE & Co. KG
  • Biosensors International Group, Ltd.

The global biliary stents market is segmented as follows:

logoBy Material:

  • Metal
  • Plastic

logoBy Applications:

  • Malignant Obstruction
  • Biliary Leaks
  • Benign Biliary Structures
  • Others

logoBy End User:

  • Diagnostic Laboratories
  • Hospitals
  • Ambulance Surgical Centers
  • Specialty Clinics
  • Research and Academic Institutes
  • Others

logo Regional Segment Analysis

  • North America
    • U.S.
    • Canada
  • Europe
    • UK
    • France
    • Germany
    • Italy
    • Spain
    • Rest of Europe
  • Asia Pacific
    • China
    • Japan
    • India
    • South Korea
    • Southeast Asia
    • Rest of Asia Pacific
  • Latin America
    • Brazil
    • Mexico
    • Rest of Latin America
  • Middle East and Africa
    • GCC Countries
    • South Africa
    • Rest of MEA

Table of Content

  1. Chapter 1 Executive Summary
    1. 1.1. Introduction of Biliary Stents
    2. 1.2. Global Biliary Stents Market, 2019 & 2026 (USD Million)
    3. 1.3. Global Biliary Stents Market, 2016 – 2026 (USD Million)
    4. 1.4. Global Biliary Stents Market Absolute Revenue Opportunity, 2016 – 2026 (USD Million)
    5. 1.5. Global Biliary Stents Market Incremental Revenue Opportunity, 2020 – 2026 (USD Million)
  2. Chapter 2 Biliary Stents Market – Material Analysis
    1. 2.1. Global Biliary Stents Market – Material Overview
    2. 2.2. Global Biliary Stents Market Share, by Material, 2019 & 2026 (USD Million)
    3. 2.3. Metal
      1. 2.3.1. Global Metal Biliary Stents Market, 2016 – 2026 (USD Million)
    4. 2.4. Plastic
      1. 2.4.1. Global Plastic Biliary Stents Market, 2016 – 2026 (USD Million)
  3. Chapter 3 Biliary Stents Market – Application Analysis
    1. 3.1. Global Biliary Stents Market – Application Overview
    2. 3.2. Global Biliary Stents Market Share, by Application, 2019 & 2026 (USD Million)
    3. 3.3. Malignant Obstruction
      1. 3.3.1. Global Malignant Obstruction Biliary Stents Market, 2016 – 2026 (USD Million)
    4. 3.4. Biliary Leaks
      1. 3.4.1. Global Biliary Leaks Biliary Stents Market, 2016 – 2026 (USD Million)
    5. 3.5. Benign Biliary Structures
      1. 3.5.1. Global Benign Biliary Structures Biliary Stents Market, 2016 – 2026 (USD Million)
    6. 3.6. Others
      1. 3.6.1. Global Others Biliary Stents Market, 2016 – 2026 (USD Million)
  4. Chapter 4 Biliary Stents Market – End User Analysis
    1. 4.1. Global Biliary Stents Market – End User Overview
    2. 4.2. Global Biliary Stents Market Share, by End User, 2019 & 2026 (USD Million)
    3. 4.3. Diagnostic Laboratories
      1. 4.3.1. Global Diagnostic Laboratories Biliary Stents Market, 2016 – 2026 (USD Million)
    4. 4.4. Hospitals
      1. 4.4.1. Global Hospitals Biliary Stents Market, 2016 – 2026 (USD Million)
    5. 4.5. Ambulance Surgical Centres
      1. 4.5.1. Global Ambulance Surgical Centres Biliary Stents Market, 2016 – 2026 (USD Million)
    6. 4.6. Speciality Clinics
      1. 4.6.1. Global Speciality Clinics Biliary Stents Market, 2016 – 2026 (USD Million)
    7. 4.7. Research and Academic
      1. 4.7.1. Global Research and Academic Biliary Stents Market, 2016 – 2026 (USD Million)
    8. 4.8. Institutes
      1. 4.8.1. Global Institutes Biliary Stents Market, 2016 – 2026 (USD Million)
  5. Chapter 5 Biliary Stents Market – Regional Analysis
    1. 5.1. Global Biliary Stents Market Regional Overview
    2. 5.2. Global Biliary Stents Market Share, by Region, 2019 & 2026 (USD Million)
    3. 5.3. North America
      1. 5.3.1. North America Biliary Stents Market, 2016 – 2026 (USD Million)
        1. 5.3.1.1. North America Biliary Stents Market, by Country, 2016 - 2026 (USD Million)
      2. 5.3.2. North America Biliary Stents Market, by Material, 2016 – 2026
        1. 5.3.2.1. North America Biliary Stents Market, by Material, 2016 – 2026 (USD Million)
      3. 5.3.3. North America Biliary Stents Market, by Application, 2016 – 2026
        1. 5.3.3.1. North America Biliary Stents Market, by Application, 2016 – 2026 (USD Million)
      4. 5.3.4. North America Biliary Stents Market, by End User, 2016 – 2026
        1. 5.3.4.1. North America Biliary Stents Market, by End User, 2016 – 2026 (USD Million)
      5. 5.3.5. U.S.
        1. 5.3.5.1. U.S. Biliary Stents Market, 2016 – 2026 (USD Million)
      6. 5.3.6. Canada
        1. 5.3.6.1. Canada Biliary Stents Market, 2016 – 2026 (USD Million)
    4. 5.4. Europe
      1. 5.4.1. Europe Biliary Stents Market, 2016 – 2026 (USD Million)
        1. 5.4.1.1. Europe Biliary Stents Market, by Country, 2016 - 2026 (USD Million)
      2. 5.4.2. Europe Biliary Stents Market, by Material, 2016 – 2026
        1. 5.4.2.1. Europe Biliary Stents Market, by Material, 2016 – 2026 (USD Million)
      3. 5.4.3. Europe Biliary Stents Market, by Application, 2016 – 2026
        1. 5.4.3.1. Europe Biliary Stents Market, by Application, 2016 – 2026 (USD Million)
      4. 5.4.4. Europe Biliary Stents Market, by End User, 2016 – 2026
        1. 5.4.4.1. Europe Biliary Stents Market, by End User, 2016 – 2026 (USD Million)
      5. 5.4.5. Germany
        1. 5.4.5.1. Germany Biliary Stents Market, 2016 – 2026 (USD Million)
      6. 5.4.6. France
        1. 5.4.6.1. France Biliary Stents Market, 2016 – 2026 (USD Million)
      7. 5.4.7. U.K.
        1. 5.4.7.1. U.K. Biliary Stents Market, 2016 – 2026 (USD Million)
      8. 5.4.8. Italy
        1. 5.4.8.1. Italy Biliary Stents Market, 2016 – 2026 (USD Million)
      9. 5.4.9. Spain
        1. 5.4.9.1. Spain Biliary Stents Market, 2016 – 2026 (USD Million)
      10. 5.4.10. Rest of Europe
        1. 5.4.10.1. Rest of Europe Biliary Stents Market, 2016 – 2026 (USD Million)
    5. 5.5. Asia Pacific
      1. 5.5.1. Asia Pacific Biliary Stents Market, 2016 – 2026 (USD Million)
        1. 5.5.1.1. Asia Pacific Biliary Stents Market, by Country, 2016 - 2026 (USD Million)
      2. 5.5.2. Asia Pacific Biliary Stents Market, by Material, 2016 – 2026
        1. 5.5.2.1. Asia Pacific Biliary Stents Market, by Material, 2016 – 2026 (USD Million)
      3. 5.5.3. Asia Pacific Biliary Stents Market, by Application, 2016 – 2026
        1. 5.5.3.1. Asia Pacific Biliary Stents Market, by Application, 2016 – 2026 (USD Million)
      4. 5.5.4. Asia Pacific Biliary Stents Market, by End User, 2016 – 2026
        1. 5.5.4.1. Asia Pacific Biliary Stents Market, by End User, 2016 – 2026 (USD Million)
      5. 5.5.5. China
        1. 5.5.5.1. China Biliary Stents Market, 2016 – 2026 (USD Million)
      6. 5.5.6. Japan
        1. 5.5.6.1. Japan Biliary Stents Market, 2016 – 2026 (USD Million)
      7. 5.5.7. India
        1. 5.5.7.1. India Biliary Stents Market, 2016 – 2026 (USD Million)
      8. 5.5.8. South Korea
        1. 5.5.8.1. South Korea Biliary Stents Market, 2016 – 2026 (USD Million)
      9. 5.5.9. South-East Asia
        1. 5.5.9.1. South-East Asia Biliary Stents Market, 2016 – 2026 (USD Million)
      10. 5.5.10. Rest of Asia Pacific
        1. 5.5.10.1. Rest of Asia Pacific Biliary Stents Market, 2016 – 2026 (USD Million)
    6. 5.6. Latin America
      1. 5.6.1. Latin America Biliary Stents Market, 2016 – 2026 (USD Million)
        1. 5.6.1.1. Latin America Biliary Stents Market, by Country, 2016 - 2026 (USD Million)
      2. 5.6.2. Latin America Biliary Stents Market, by Material, 2016 – 2026
        1. 5.6.2.1. Latin America Biliary Stents Market, by Material, 2016 – 2026 (USD Million)
      3. 5.6.3. Latin America Biliary Stents Market, by Application, 2016 – 2026
        1. 5.6.3.1. Latin America Biliary Stents Market, by Application, 2016 – 2026 (USD Million)
      4. 5.6.4. Latin America Biliary Stents Market, by End User, 2016 – 2026
        1. 5.6.4.1. Latin America Biliary Stents Market, by End User, 2016 – 2026 (USD Million)
      5. 5.6.5. Brazil
        1. 5.6.5.1. Brazil Biliary Stents Market, 2016 – 2026 (USD Million)
      6. 5.6.6. Mexico
        1. 5.6.6.1. Mexico Biliary Stents Market, 2016 – 2026 (USD Million)
      7. 5.6.7. Rest of Latin America
        1. 5.6.7.1. Rest of Latin America Biliary Stents Market, 2016 – 2026 (USD Million)
    7. 5.7. The Middle-East and Africa
      1. 5.7.1. The Middle-East and Africa Biliary Stents Market, 2016 – 2026 (USD Million)
        1. 5.7.1.1. The Middle-East and Africa Biliary Stents Market, by Country, 2016 - 2026 (USD Million)
      2. 5.7.2. The Middle-East and Africa Biliary Stents Market, by Material, 2016 – 2026
        1. 5.7.2.1. The Middle-East and Africa Biliary Stents Market, by Material, 2016 – 2026 (USD Million)
      3. 5.7.3. The Middle-East and Africa Biliary Stents Market, by Application, 2016 – 2026
        1. 5.7.3.1. The Middle-East and Africa Biliary Stents Market, by Application, 2016 – 2026 (USD Million)
      4. 5.7.4. The Middle-East and Africa Biliary Stents Market, by End User, 2016 – 2026
        1. 5.7.4.1. The Middle-East and Africa Biliary Stents Market, by End User, 2016 – 2026 (USD Million)
      5. 5.7.5. GCC Countries
        1. 5.7.5.1. GCC Countries Biliary Stents Market, 2016 – 2026 (USD Million)
      6. 5.7.6. South Africa
        1. 5.7.6.1. South Africa Biliary Stents Market, 2016 – 2026 (USD Million)
      7. 5.7.7. Rest of Middle-East Africa
        1. 5.7.7.1. Rest of Middle-East Africa Biliary Stents Market, 2016 – 2026 (USD Million)
  6. Chapter 6 Biliary Stents Market – Competitive Landscape
    1. 6.1. Competitor Market Share – Revenue
    2. 6.2. Market Concentration Rate Analysis, Top 3 and Top 5 Players
    3. 6.3. Strategic Developments
      1. 6.3.1. Acquisitions and Mergers
      2. 6.3.2. New Products
      3. 6.3.3. Research & Development Activities
  7. Chapter 7 Company Profiles
    1. 7.1. Abbott Laboratories
      1. 7.1.1. Company Overview
      2. 7.1.2. Product/Service Portfolio
      3. 7.1.3. Abbott Laboratories Sales, Revenue, and Gross Margin
      4. 7.1.4. Abbott Laboratories Revenue and Growth Rate
      5. 7.1.5. Abbott Laboratories Market Share
      6. 7.1.6. Recent Initiatives, Funding/VC Activities, and Technological Innovations
    2. 7.2. Boston Scientific Corporation
      1. 7.2.1. Company Overview
      2. 7.2.2. Product/Service Portfolio
      3. 7.2.3. Boston Scientific Corporation Sales, Revenue, and Gross Margin
      4. 7.2.4. Boston Scientific Corporation Revenue and Growth Rate
      5. 7.2.5. Boston Scientific Corporation Market Share
      6. 7.2.6. Recent Initiatives, Funding/VC Activities, and Technological Innovations
    3. 7.3. CONMED Corporation
      1. 7.3.1. Company Overview
      2. 7.3.2. Product/Service Portfolio
      3. 7.3.3. CONMED Corporation Sales, Revenue, and Gross Margin
      4. 7.3.4. CONMED Corporation Revenue and Growth Rate
      5. 7.3.5. CONMED Corporation Market Share
      6. 7.3.6. Recent Initiatives, Funding/VC Activities, and Technological Innovations
    4. 7.4. Cook Medical
      1. 7.4.1. Company Overview
      2. 7.4.2. Product/Service Portfolio
      3. 7.4.3. Cook Medical Sales, Revenue, and Gross Margin
      4. 7.4.4. Cook Medical Revenue and Growth Rate
      5. 7.4.5. Cook Medical Market Share
      6. 7.4.6. Recent Initiatives, Funding/VC Activities, and Technological Innovations
      7. 7.5. B. Braun Melsungen AG
      8. 7.5.1. Company Overview
      9. 7.5.2. Product/Service Portfolio
        1. 7.5.3. B. Braun Melsungen AG Sales, Revenue, and Gross Margin
        2. 7.5.4. B. Braun Melsungen AG Revenue and Growth Rate
        3. 7.5.5. B. Braun Melsungen AG Market Share
      10. 7.5.6. Recent Initiatives, Funding/VC Activities, and Technological Innovations
    5. 7.6. Medtronic
      1. 7.6.1. Company Overview
      2. 7.6.2. Product/Service Portfolio
      3. 7.6.3. Medtronic Sales, Revenue, and Gross Margin
      4. 7.6.4. Medtronic Revenue and Growth Rate
      5. 7.6.5. Medtronic Market Share
      6. 7.6.6. Recent Initiatives, Funding/VC Activities, and Technological Innovations
    6. 7.7. Terumo Corporation
      1. 7.7.1. Company Overview
      2. 7.7.2. Product/Service Portfolio
      3. 7.7.3. Terumo Corporation Sales, Revenue, and Gross Margin
      4. 7.7.4. Terumo Corporation Revenue and Growth Rate
      5. 7.7.5. Terumo Corporation Market Share
      6. 7.7.6. Recent Initiatives, Funding/VC Activities, and Technological Innovations
    7. 7.8. Endotech
      1. 7.8.1. Company Overview
      2. 7.8.2. Product/Service Portfolio
      3. 7.8.3. Endotech Sales, Revenue, and Gross Margin
      4. 7.8.4. Endotech Revenue and Growth Rate
      5. 7.8.5. Endotech Market Share
      6. 7.8.6. Recent Initiatives, Funding/VC Activities, and Technological Innovations
    8. 7.9. Biotronik SE & Co. KG
      1. 7.9.1. Company Overview
      2. 7.9.2. Product/Service Portfolio
      3. 7.9.3. Biotronik SE & Co. KG Sales, Revenue, and Gross Margin
      4. 7.9.4. Biotronik SE & Co. KG Revenue and Growth Rate
      5. 7.9.5. Biotronik SE & Co. KG Market Share
      6. 7.9.6. Recent Initiatives, Funding/VC Activities, and Technological Innovations
    9. 7.10. Biosensors International Group, Ltd
      1. 7.10.1. Company Overview
      2. 7.10.2. Product/Service Portfolio
      3. 7.10.3. Biosensors International Group, Ltd Sales, Revenue, and Gross Margin
      4. 7.10.4. Biosensors International Group, Ltd Revenue and Growth Rate
      5. 7.10.5. Biosensors International Group, Ltd Market Share
      6. 7.10.6. Recent Initiatives, Funding/VC Activities, and Technological Innovations
  8. Chapter 8 Biliary Stents — Industry Analysis
    1. 8.1. Introduction and Taxonomy
    2. 8.2. Biliary Stents Market – Key Trends
      1. 8.2.1. Market Drivers
      2. 8.2.2. Market Restraints
      3. 8.2.3. Market Opportunities
    3. 8.3. Value Chain Analysis
    4. 8.4. Key Mandates and Regulations
    5. 8.5. Technology Roadmap and Timeline
    6. 8.6. Biliary Stents Market – Attractiveness Analysis
      1. 8.6.1. By Material
      2. 8.6.2. By Application
      3. 8.6.3. By End User
      4. 8.6.4. By Region
  9. Chapter 9 Industrial Chain, Sourcing Strategy, and Downstream Buyers
    1. 9.1. Biliary Stents Industrial Chain Analysis
    2. 9.2. Downstream Buyers
    3. 9.3. Distributors/Traders List
  10. Chapter 10 Marketing Strategy Analysis
    1. 10.1. Marketing Channel
    2. 10.2. Direct Marketing
    3. 10.3. Indirect Marketing
    4. 10.4. Marketing Channel Development Trends
    5. 10.5. Economic/Political Environmental Change
  11. Chapter 11 Report Conclusion & Key Insights
    1. 11.1. Key Insights from Primary Interviews & Surveys Respondents
    2. 11.2. Key Takeaways from Analysts, Consultants, and Industry Leaders
  12. Chapter 12 Research Approach & Methodology
    1. 12.1. Report Description
    2. 12.2. Research Scope
    3. 12.3. Research Methodology
      1. 12.3.1. Secondary Research
      2. 12.3.2. Primary Research
      3. 12.3.3. Statistical Models
        1. 12.3.3.1. Company Share Analysis Model
        2. 12.3.3.2. Revenue Based Modeling
      4. 12.3.4. Research Limitations

      List of Figures

      Fig.1	Product Picture of Biliary Stents
      Fig.2	Global Biliary Stents Market, 2016 – 2026 (USD Million)
      Fig.3	Global Biliary Stents Market Absolute Revenue Opportunity, 2016 – 2026 (USD Million)
      Fig.4	Global Biliary Stents Market Incremental Revenue Opportunity, 2020 – 2026 (USD Million)
      Fig.5	Global Biliary Stents Market Share, by Material, 2019 & 2026 (USD Million)
      Fig.6	Global Metal Biliary Stents Market, 2016 – 2026 (USD Million)
      Fig.7	Global Plastic Biliary Stents Market, 2016 – 2026 (USD Million)
      Fig.8	Global Biliary Stents Market Share, by Application, 2019 & 2026 (USD Million)
      Fig.9	Global Malignant Obstruction Biliary Stents Market, 2016 – 2026 (USD Million)
      Fig.10	Global Biliary Leaks Biliary Stents Market, 2016 – 2026 (USD Million)
      Fig.11	Global Benign Biliary Structures Biliary Stents Market, 2016 – 2026 (USD Million)
      Fig.12	Global Others Biliary Stents Market, 2016 – 2026 (USD Million)
      Fig.13	Global Biliary Stents Market Share, by End User, 2019 & 2026 (USD Million)
      Fig.14	Global Diagnostic Laboratories Biliary Stents Market, 2016 – 2026 (USD Million)
      Fig.15	Global Hospitals Biliary Stents Market, 2016 – 2026 (USD Million)
      Fig.16	Global Ambulance Surgical Centres Biliary Stents Market, 2016 – 2026 (USD Million)
      Fig.17	Global Speciality Clinics Biliary Stents Market, 2016 – 2026 (USD Million)
      Fig.18	Global Research and Academic Biliary Stents Market, 2016 – 2026 (USD Million)
      Fig.19	Global Institutes Biliary Stents Market, 2016 – 2026 (USD Million)
      Fig.20	Global Biliary Stents Market Share, by Region, 2019 & 2026 (USD Million)
      Fig.21	North America Biliary Stents Market, 2016 – 2026 (USD Million)
      Fig.22	U.S. Biliary Stents Market, 2016 – 2026 (USD Million)
      Fig.23	Canada Biliary Stents Market, 2016 – 2026 (USD Million)
      Fig.24	Europe Biliary Stents Market, 2016 – 2026 (USD Million)
      Fig.25	Germany Biliary Stents Market, 2016 – 2026 (USD Million)
      Fig.26	France Biliary Stents Market, 2016 – 2026 (USD Million)
      Fig.27	U.K. Biliary Stents Market, 2016 – 2026 (USD Million)
      Fig.28	Italy Biliary Stents Market, 2016 – 2026 (USD Million)
      Fig.29	Spain Biliary Stents Market, 2016 – 2026 (USD Million)
      Fig.30	Rest of Europe Biliary Stents Market, 2016 – 2026 (USD Million)
      Fig.31	Asia Pacific Biliary Stents Market, 2016 – 2026 (USD Million)
      Fig.32	China Biliary Stents Market, 2016 – 2026 (USD Million)
      Fig.33	Japan Biliary Stents Market, 2016 – 2026 (USD Million)
      Fig.34	India Biliary Stents Market, 2016 – 2026 (USD Million)
      Fig.35	South  Korea Biliary Stents Market, 2016 – 2026 (USD Million)
      Fig.36	South-East Asia Biliary Stents Market, 2016 – 2026 (USD Million)
      Fig.37	Rest of Asia Pacific Biliary Stents Market, 2016 – 2026 (USD Million)
      Fig.38	Latin America Biliary Stents Market, 2016 – 2026 (USD Million)
      Fig.39	Brazil Biliary Stents Market, 2016 – 2026 (USD Million)
      Fig.40	Mexico Biliary Stents Market, 2016 – 2026 (USD Million)
      Fig.41	Rest of Latin America Biliary Stents Market, 2016 – 2026 (USD Million)
      Fig.42	The Middle-East and Africa Biliary Stents Market, 2016 – 2026 (USD Million)
      Fig.43	GCC Countries Biliary Stents Market, 2016 – 2026 (USD Million)
      Fig.44	South Africa Biliary Stents Market, 2016 – 2026 (USD Million)
      Fig.45	Rest of Middle-East Africa Biliary Stents Market, 2016 – 2026 (USD Million)
      Fig.46	Competitor Market Share – Revenue
      Fig.47	Abbott Laboratories Revenue and Growth Rate
      Fig.48	Abbott Laboratories Market Share
      Fig.49	Boston Scientific Corporation Revenue and Growth Rate
      Fig.50	Boston Scientific Corporation Market Share
      Fig.51	CONMED Corporation Revenue and Growth Rate
      Fig.52	CONMED Corporation Market Share
      Fig.53	Cook Medical Revenue and Growth Rate
      Fig.54	Cook Medical Market Share
      Fig.55	B. Braun Melsungen AG Revenue and Growth Rate
      Fig.56	B. Braun Melsungen AG Market Share
      Fig.57	Medtronic Revenue and Growth Rate
      Fig.58	Medtronic Market Share
      Fig.59	Terumo Corporation Revenue and Growth Rate
      Fig.60	Terumo Corporation Market Share
      Fig.61	Endotech Revenue and Growth Rate
      Fig.62	Endotech Market Share
      Fig.63	Biotronik SE & Co. KG Revenue and Growth Rate
      Fig.64	Biotronik SE & Co. KG Market Share
      Fig.65	Biosensors International Group, Ltd Revenue and Growth Rate
      Fig.66	Biosensors International Group, Ltd Market Share
      Fig.67	Market Dynamics
      Fig.68	Global Biliary Stents – Value Chain Analysis
      Fig.69	Key Mandates and Regulations
      Fig.70	Technology Roadmap and Timeline
      Fig.71	Market Attractiveness Analysis – By Material
      Fig.72	Market Attractiveness Analysis – By Application
      Fig.73	Market Attractiveness Analysis – By End User
      Fig.74	Market Attractiveness Analysis – By Region
      Fig.75	Biliary Stents Industrial Chain Analysis
      Fig.76	Market Channels
      Fig.77	Marketing Channel Development Trend
      Fig.78	Growth in World Gross Product, 2008-2018
      

      List of Tables

      Table 1	Global Biliary Stents Market, 2019 & 2026 (USD Million)
      Table 2	Global Biliary Stents Market, by Material, 2016 – 2026 (USD Million)
      Table 3	Global Biliary Stents Market, by Application, 2016 – 2026 (USD Million)
      Table 4	Global Biliary Stents Market, by End User, 2016 – 2026 (USD Million)
      Table 5	Global Biliary Stents Market, by Region, 2016 – 2026 (USD Million)
      Table 6	North America Biliary Stents Market, by Country, 2016 – 2026 (USD Million)
      Table 7	North America Biliary Stents Market, by Material, 2016 – 2026 (USD Million)
      Table 8	North America Biliary Stents Market, by Application, 2016 – 2026 (USD Million)
      Table 9	North America Biliary Stents Market, by End User, 2016 – 2026 (USD Million)
      Table 10 Europe Biliary Stents Market, by Country, 2016 – 2026 (USD Million)
      Table 11 Europe Biliary Stents Market, by Material, 2016 – 2026 (USD Million)
      Table 12 Europe Biliary Stents Market, by Application, 2016 – 2026 (USD Million)
      Table 13 Europe Biliary Stents Market, by End User, 2016 – 2026 (USD Million)
      Table 14 Asia Pacific Biliary Stents Market, by Country, 2016 – 2026 (USD Million)
      Table 15 Asia Pacific Biliary Stents Market, by Material, 2016 – 2026 (USD Million)
      Table 16 Asia Pacific Biliary Stents Market, by Application, 2016 – 2026 (USD Million)
      Table 17 Asia Pacific Biliary Stents Market, by End User, 2016 – 2026 (USD Million)
      Table 18 Latin America Biliary Stents Market, by Country, 2016 – 2026 (USD Million)
      Table 19 Latin America Biliary Stents Market, by Material, 2016 – 2026 (USD Million)
      Table 20 Latin America Biliary Stents Market, by Application, 2016 – 2026 (USD Million)
      Table 21 Latin America Biliary Stents Market, by End User, 2016 – 2026 (USD Million)
      Table 22 The Middle-East and Africa Biliary Stents Market, by Country, 2016 – 2026 (USD Million)
      Table 23 The Middle-East and Africa Biliary Stents Market, by Material, 2016 – 2026 (USD Million)
      Table 24 The Middle-East and Africa Biliary Stents Market, by Application, 2016 – 2026 (USD Million)
      Table 25 The Middle-East and Africa Biliary Stents Market, by End User, 2016 – 2026 (USD Million)
      Table 26 Global Biliary Stents Market - Company Revenue Analysis, 2016 – 2019 (USD Million)
      Table 27 Global Biliary Stents Market - Company Revenue Share Analysis, 2016 – 2019 (%)
      Table 28 Acquisitions and Mergers
      Table 29 Market Drivers – Impact Analysis
      Table 30 Market Restraints
      Table 31 Market Opportunities
      Table 32 Major Buyers of Biliary Stents
      Table 33 Distributors/Traders of Biliary Stents by Region
      

Industry Major Market Players

  • Abbott Laboratories
  • Boston Scientific Corporation
  • CONMED Corporation
  • Cook Medical
  • B. Braun Melsungen AG
  • Medtronic
  • Terumo Corporation
  • Endotech
  • Biotronik SE & Co. KG
  • Biosensors International Group Ltd.