Search Market Research Report

Discover Our Latest Reports
Discover Our Featured Reports
Discover Top Selling Reports

Autonomous Delivery Robots Market Size, Share Global Analysis Report, , 2021 – 2026

report img

Autonomous Delivery Robots Market by Types (Semi-Autonomous Robots and Fully Autonomous Robots),by Load Carrying Capacity (Up to 10 kg, more than 50 kg), by Components (Hardware and Software), by Number of Wheels (Three wheels, Four wheels, and Six wheels), End-User Industry (Logistics, Healthcare, Food & Beverages, Retail, Postal, and Others): Global Industry Perspective, Comprehensive Analysis, and Forecast, 2021 – 2026

Industry Insights

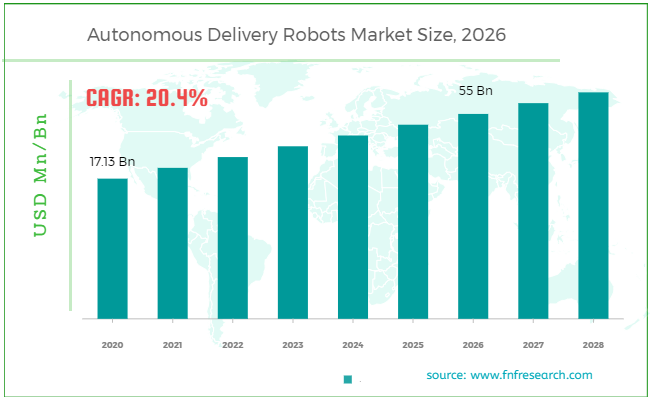
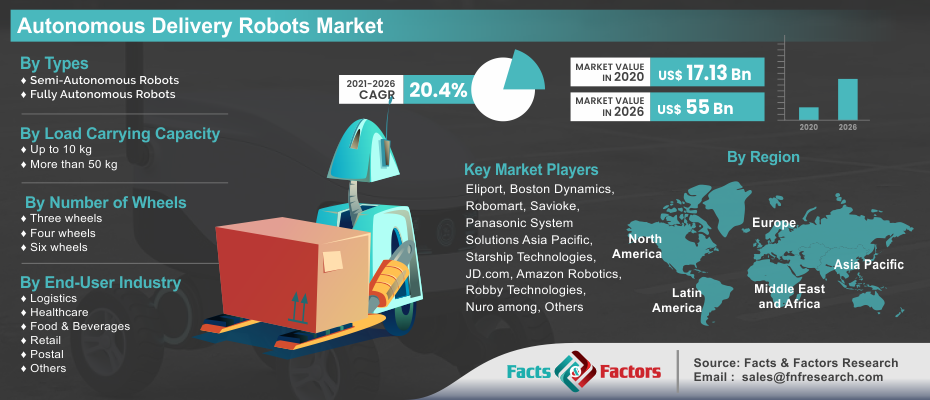
[222+ Pages Report] According to a Facts and Factors market research report, the global autonomous delivery robots market was estimated to be USD 17.13 Billion in 2020; and the revenue is expected to reach around USD 55 Billion by the end of 2026, increasing at a CAGR of around 20.4% from 2021 to 2026.

Autonomous Delivery Robots Market Size

To know more about this report | Request Free Sample Copy

logoMarket Overview

Autonomous delivery robots are electric-powered motorized vehicles that can deliver items or deliveries to customers without the assistance of a person or supervisor. The sensors and navigation technologies in the autonomous delivery robots allow them to navigate on highways and sidewalks without the need for a driver or on-site delivery workers.

Autonomous Delivery Robots Market

To know more about this report | Request Free Sample Copy

These robots have been programmed to deliver various types of items from one area to another. Couriers, food, supplies, and other goods are among the items to be delivered. Delivery methods have been changed thanks to autonomous delivery robots. They have the benefit of being a very efficient and cost-effective distribution method. Retail, hospitality, healthcare, logistics, and other industries employ autonomous delivery robots the most.

The primary drivers driving the market's growth are lower delivery costs in last-mile deliveries and an increase in venture capital funding. Furthermore, drivers fuelling the market's growth include the worldwide rise of the e-commerce business.

logoIndustry Growth Factors

The final phase of product delivery, from the warehouse or distribution center to the end-user, accounts for over 28% of the entire transportation cost in most supply chains. Congestion in urban areas, isolated places, erroneous or erroneous address info, difficult-to-find destinations, and a severe labour scarcity for supplying on-demand delivery services are all variables that affect last-mile delivery. All of these issues are preventing this phase's optimization. Customers in the realm of e-commerce are not just demanding, but they also like to buy high-quality goods at a reduced price. Autonomous delivery robots in e-commerce will not only provide customers with better convenience at a lower cost, but they will also fundamentally alter the competitive landscape.

The current COVID-19 pandemic has shone a spotlight on delivery robots for contactless package deliveries around the world, and strong market demand has pushed delivery robot developers to launch large-scale operations in a number of US locations. During the pandemic, the deployment and adoption of delivery robot technology are projected to strengthen the market for delivery robots. Food is also being delivered by delivery robots from restaurants. Delivery robots have been in use for several years; however, during the epidemic, end users, including restaurants, grocery stores, and other delivery service organizations, have shown a significant increase in interest in them.

logoSegmentation Analysis

On the basis of the type of autonomous delivery robots, the autonomous delivery robots market is segmented into semi-autonomous robots and fully autonomous robots. Fully Autonomous Robots held the biggest market share in 2020 and are expected to grow at the fastest rate throughout the forecast period. Fully autonomous delivery robots are fully automated delivery robots that do not require human interaction during delivery. Based onload carrying capacity of autonomous delivery robots, the autonomous delivery robots market is segmented into Up to 10 kg, more than 50 kg. On the basis of components of autonomous delivery robots, the autonomous delivery robots market is segmented into hardware and software. In 2020, hardware components accounted for a higher portion of the delivery robots’ market. The costlier components, such as LiDAR sensors and radars, account for the bigger hardware market share. However, due to the rising demand for delivery robots with auto navigation and autonomous decision-making skills, the market for software components is likely to rise at a faster CAGR during the forecast period.The autonomous delivery robot can be segmented on the basis of a number of wheels of autonomous delivery robots into 3 wheels, 4 wheels, and 6 wheels.In terms of value, the market for four-wheeled delivery robots held the highest proportion in 2020. Four-wheeled robots are available for a variety of tasks, including delivering groceries, meal orders, flowers, deliveries, and boxes. With 4-wheeled robots, reducing the distance between the front and back sets of wheels will result in improved zero-radius turning in any desired direction. As a result, four-wheeled delivery robots dominated the market. On the basis of the end-user industry of autonomous delivery robots, the autonomous delivery robots market is segmented into logistics, healthcare, food & beverages, retail, postal, and others.During the projection period, China's market is predicted to grow due to rising demand for delivery robots in the retail industry, as well as an elderly population. The lack of laws or standards for operating fully autonomous robots is projected to drive the delivery robots’ sector in South Korea to new heights.

logo Regional Analysis

North America, Europe, Asia Pacific, and the Rest of the World make up the Global Autonomous Delivery Robots Market. In 2020, North America held the highest market share, and it is expected to grow at a strong CAGR over the forecast period. Many of the leading market vendors are based here, and the region also includes a large number of manufacturers and start-ups devoted to the advancement of autonomous delivery robotic technology. In addition, when compared to other parts of the world, the region has a relatively high penetration of autonomous delivery robots among diverse end-users.

logoReport Scope

Report Attribute

Details

Market Size in 2020

USD 17.13 Billion

Projected Market Size in 2026

USD 55 Billion

CAGR Growth Rate

20.4% CAGR

Base Year

2020

Forecast Years

2021-2026

Key Market Players

Eliport, Boston Dynamics, Robomart, Panasonic System Solutions Asia Pacific, Savioke, Starship Technologies, JD.com, Amazon Robotics, Robby Technologies, and Nuro among others.

Key Segment

By Type, By Region

Major Regions Covered

North America, Europe, Asia Pacific, Latin America, and the Middle East & Africa

Purchase Options

Request customized purchase options to meet your research needs. Explore purchase options

logo Competitive Players

The major market players in the autonomous delivery robots market are :

  • Eliport
  • Boston Dynamics
  • Robomart
  • Panasonic System Solutions Asia Pacific
  • Savioke
  • Starship Technologies
  • JD.com
  • Amazon Robotics
  • Robby Technologies
  • Nuro

From January 2017 to December 2020, these companies used a variety of growth tactics to achieve growth in the delivery robots’ market, including expansions, partnerships, agreements, and collaborations, which helped them to expand their product portfolio and broaden their client base.

logo By Types Segmentation Analysis:

  • Semi-Autonomous Robots
  • Fully Autonomous Robots

logo By Load Carrying Capacity Segmentation Analysis

  • Up to 10 kg
  • More than 50 kg

logo By Components Segmentation Analysis

  • Hardware
  • Software

logo By Number of Wheels Segmentation Analysis

  • Three wheels
  • Four wheels
  • Six wheels

logo By End-User Industry Segmentation Analysis

  • Logistics
  • Healthcare
  • Food & Beverages
  • Retail
  • Postal
  • Others

logo Regional Segmentation Analysis

  • North America
    • U.S.
    • Canada
  • Europe
    • Germany
    • The UK
    • France
    • Spain
    • Italy
    • Rest of Europe
  • Asia Pacific
    • China
    • Japan
    • India
    • South Korea
    • Southeast Asia
    • Rest of Asia Pacific
  • Latin America
    • Brazil
    • Mexico
    • Rest of Latin America
  • Middle East & Africa
    • GCC Countries
    • South Africa
    • Rest of Middle East & Africa

Table of Content

  1. Chapter 1 Executive Summary
    1. 1.1. Introduction of Autonomous Delivery Robots
    2. 1.2. Global Autonomous Delivery Robots Market, 2020 & 2026 (USD Million)
    3. 1.3. Global Autonomous Delivery Robots Market, 2016 – 2026 (USD Million)
    4. 1.4. Global Autonomous Delivery Robots Market Absolute Revenue Opportunity, 2016 – 2026 (USD Million)
    5. 1.5. Global Autonomous Delivery Robots Market Incremental Revenue Opportunity, 2020 – 2026 (USD Million)
  2. Chapter 2 Autonomous Delivery Robots Market – Types Analysis
    1. 2.1. Global Autonomous Delivery Robots Market – Types Overview
    2. 2.2. Global Autonomous Delivery Robots Market Share, by Types, 2020 & 2026 (USD Million)
    3. 2.3. Semi-Autonomous Robots
      1. 2.3.1. Global Semi-Autonomous Robots Autonomous Delivery Robots Market, 2016 – 2026 (USD Million)
    4. 2.4. Fully Autonomous Robots
      1. 2.4.1. Global Fully Autonomous Robots Autonomous Delivery Robots Market, 2016 – 2026 (USD Million)
  3. Chapter 3 Autonomous Delivery Robots Market – Load Carrying Capacity Analysis
    1. 3.1. Global Autonomous Delivery Robots Market – Load Carrying Capacity Overview
    2. 3.2. Global Autonomous Delivery Robots Market Share, by Load Carrying Capacity, 2020 & 2026 (USD Million)
    3. 3.3. Up to 10 kg
      1. 3.3.1. Global Up to 10 kg Autonomous Delivery Robots Market, 2016 – 2026 (USD Million)
    4. 3.4. More than 50 kg
      1. 3.4.1. Global More than 50 kg Autonomous Delivery Robots Market, 2016 – 2026 (USD Million)
  4. Chapter 4 Autonomous Delivery Robots Market – Components Analysis
    1. 4.1. Global Autonomous Delivery Robots Market – Components Overview
    2. 4.2. Global Autonomous Delivery Robots Market Share, by Components, 2020 & 2026 (USD Million)
    3. 4.3. Hardware
      1. 4.3.1. Global Hardware Autonomous Delivery Robots Market, 2016 – 2026 (USD Million)
    4. 4.4. Software
      1. 4.4.1. Global Software Autonomous Delivery Robots Market, 2016 – 2026 (USD Million)
  5. Chapter 5 Autonomous Delivery Robots Market – Number of Wheels Analysis
    1. 5.1. Global Autonomous Delivery Robots Market – Number of Wheels Overview
    2. 5.2. Global Autonomous Delivery Robots Market Share, by Number of Wheels, 2020 & 2026 (USD Million)
    3. 5.3. Three Wheels
      1. 5.3.1. Global Three Wheels Autonomous Delivery Robots Market, 2016 – 2026 (USD Million)
    4. 5.4. Four Wheels
      1. 5.4.1. Global Four Wheels Autonomous Delivery Robots Market, 2016 – 2026 (USD Million)
    5. 5.5. Six Wheels
      1. 5.5.1. Global Six Wheels Autonomous Delivery Robots Market, 2016 – 2026 (USD Million)
  6. Chapter 6 Autonomous Delivery Robots Market – End-User Industry Analysis
    1. 6.1. Global Autonomous Delivery Robots Market – End-User Industry Overview
    2. 6.2. Global Autonomous Delivery Robots Market Share, by End-User Industry, 2020 & 2026 (USD Million)
    3. 6.3. Logistics
      1. 6.3.1. Global Logistics Autonomous Delivery Robots Market, 2016 – 2026 (USD Million)
    4. 6.4. Healthcare
      1. 6.4.1. Global Healthcare Autonomous Delivery Robots Market, 2016 – 2026 (USD Million)
    5. 6.5. Food & Beverages
      1. 6.5.1. Global Food & Beverages Autonomous Delivery Robots Market, 2016 – 2026 (USD Million)
    6. 6.6. Retail
      1. 6.6.1. Global Retail Autonomous Delivery Robots Market, 2016 – 2026 (USD Million)
    7. 6.7. Postal
      1. 6.7.1. Global Postal Autonomous Delivery Robots Market, 2016 – 2026 (USD Million)
    8. 6.8. Others
      1. 6.8.1. Global Others Autonomous Delivery Robots Market, 2016 – 2026 (USD Million)
  7. Chapter 7 Autonomous Delivery Robots Market – Regional Analysis
    1. 7.1. Global Autonomous Delivery Robots Market Regional Overview
    2. 7.2. Global Autonomous Delivery Robots Market Share, by Region, 2020 & 2026 (USD Million)
    3. 7.3. North America
      1. 7.3.1. North America Autonomous Delivery Robots Market, 2016 – 2026 (USD Million)
        1. 7.3.1.1. North America Autonomous Delivery Robots Market, by Country, 2016 - 2026 (USD Million)
      2. 7.3.2. North America Autonomous Delivery Robots Market, by Types, 2016 – 2026
        1. 7.3.2.1. North America Autonomous Delivery Robots Market, by Types, 2016 – 2026 (USD Million)
      3. 7.3.3. North America Autonomous Delivery Robots Market, by Load Carrying Capacity, 2016 – 2026
        1. 7.3.3.1. North America Autonomous Delivery Robots Market, by Load Carrying Capacity, 2016 – 2026 (USD Million)
      4. 7.3.4. North America Autonomous Delivery Robots Market, by Components, 2016 – 2026
        1. 7.3.4.1. North America Autonomous Delivery Robots Market, by Components, 2016 – 2026 (USD Million)
      5. 7.3.5. North America Autonomous Delivery Robots Market, by Number of Wheels, 2016 – 2026
        1. 7.3.5.1. North America Autonomous Delivery Robots Market, by Number of Wheels, 2016 – 2026 (USD Million)
      6. 7.3.6. North America Autonomous Delivery Robots Market, by End-User Industry, 2016 – 2026
        1. 7.3.6.1. North America Autonomous Delivery Robots Market, by End-User Industry, 2016 – 2026 (USD Million)
      7. 7.3.7. U.S.
        1. 7.3.7.1. U.S. Autonomous Delivery Robots Market, 2016 – 2026 (USD Million)
      8. 7.3.8. Canada
        1. 7.3.8.1. Canada Autonomous Delivery Robots Market, 2016 – 2026 (USD Million)
    4. 7.4. Europe
      1. 7.4.1. Europe Autonomous Delivery Robots Market, 2016 – 2026 (USD Million)
        1. 7.4.1.1. Europe Autonomous Delivery Robots Market, by Country, 2016 - 2026 (USD Million)
      2. 7.4.2. Europe Autonomous Delivery Robots Market, by Types, 2016 – 2026
        1. 7.4.2.1. Europe Autonomous Delivery Robots Market, by Types, 2016 – 2026 (USD Million)
      3. 7.4.3. Europe Autonomous Delivery Robots Market, by Load Carrying Capacity, 2016 – 2026
        1. 7.4.3.1. Europe Autonomous Delivery Robots Market, by Load Carrying Capacity, 2016 – 2026 (USD Million)
      4. 7.4.4. Europe Autonomous Delivery Robots Market, by Components, 2016 – 2026
        1. 7.4.4.1. Europe Autonomous Delivery Robots Market, by Components, 2016 – 2026 (USD Million)
      5. 7.4.5. Europe Autonomous Delivery Robots Market, by Number of Wheels, 2016 – 2026
        1. 7.4.5.1. Europe Autonomous Delivery Robots Market, by Number of Wheels, 2016 – 2026 (USD Million)
      6. 7.4.6. Europe Autonomous Delivery Robots Market, by End-User Industry, 2016 – 2026
        1. 7.4.6.1. Europe Autonomous Delivery Robots Market, by End-User Industry, 2016 – 2026 (USD Million)
      7. 7.4.7. Germany
        1. 7.4.7.1. Germany Autonomous Delivery Robots Market, 2016 – 2026 (USD Million)
      8. 7.4.8. France
        1. 7.4.8.1. France Autonomous Delivery Robots Market, 2016 – 2026 (USD Million)
      9. 7.4.9. U.K.
        1. 7.4.9.1. U.K. Autonomous Delivery Robots Market, 2016 – 2026 (USD Million)
      10. 7.4.10. Italy
        1. 7.4.10.1. Italy Autonomous Delivery Robots Market, 2016 – 2026 (USD Million)
      11. 7.4.11. Spain
        1. 7.4.11.1. Spain Autonomous Delivery Robots Market, 2016 – 2026 (USD Million)
      12. 7.4.12. Rest of Europe
        1. 7.4.12.1. Rest of Europe Autonomous Delivery Robots Market, 2016 – 2026 (USD Million)
    5. 7.5. Asia Pacific
      1. 7.5.1. Asia Pacific Autonomous Delivery Robots Market, 2016 – 2026 (USD Million)
        1. 7.5.1.1. Asia Pacific Autonomous Delivery Robots Market, by Country, 2016 - 2026 (USD Million)
      2. 7.5.2. Asia Pacific Autonomous Delivery Robots Market, by Types, 2016 – 2026
        1. 7.5.2.1. Asia Pacific Autonomous Delivery Robots Market, by Types, 2016 – 2026 (USD Million)
      3. 7.5.3. Asia Pacific Autonomous Delivery Robots Market, by Load Carrying Capacity, 2016 – 2026
        1. 7.5.3.1. Asia Pacific Autonomous Delivery Robots Market, by Load Carrying Capacity, 2016 – 2026 (USD Million)
      4. 7.5.4. Asia Pacific Autonomous Delivery Robots Market, by Components, 2016 – 2026
        1. 7.5.4.1. Asia Pacific Autonomous Delivery Robots Market, by Components, 2016 – 2026 (USD Million)
      5. 7.5.5. Asia Pacific Autonomous Delivery Robots Market, by Number of Wheels, 2016 – 2026
        1. 7.5.5.1. Asia Pacific Autonomous Delivery Robots Market, by Number of Wheels, 2016 – 2026 (USD Million)
      6. 7.5.6. Asia Pacific Autonomous Delivery Robots Market, by End-User Industry, 2016 – 2026
        1. 7.5.6.1. Asia Pacific Autonomous Delivery Robots Market, by End-User Industry, 2016 – 2026 (USD Million)
      7. 7.5.7. China
        1. 7.5.7.1. China Autonomous Delivery Robots Market, 2016 – 2026 (USD Million)
      8. 7.5.8. Japan
        1. 7.5.8.1. Japan Autonomous Delivery Robots Market, 2016 – 2026 (USD Million)
      9. 7.5.9. India
        1. 7.5.9.1. India Autonomous Delivery Robots Market, 2016 – 2026 (USD Million)
      10. 7.5.10. South Korea
        1. 7.5.10.1. South Korea Autonomous Delivery Robots Market, 2016 – 2026 (USD Million)
      11. 7.5.11. South-East Asia
        1. 7.5.11.1. South-East Asia Autonomous Delivery Robots Market, 2016 – 2026 (USD Million)
      12. 7.5.12. Rest of Asia Pacific
        1. 7.5.12.1. Rest of Asia Pacific Autonomous Delivery Robots Market, 2016 – 2026 (USD Million)
    6. 7.6. Latin America
      1. 7.6.1. Latin America Autonomous Delivery Robots Market, 2016 – 2026 (USD Million)
        1. 7.6.1.1. Latin America Autonomous Delivery Robots Market, by Country, 2016 - 2026 (USD Million)
      2. 7.6.2. Latin America Autonomous Delivery Robots Market, by Types, 2016 – 2026
        1. 7.6.2.1. Latin America Autonomous Delivery Robots Market, by Types, 2016 – 2026 (USD Million)
      3. 7.6.3. Latin America Autonomous Delivery Robots Market, by Load Carrying Capacity, 2016 – 2026
        1. 7.6.3.1. Latin America Autonomous Delivery Robots Market, by Load Carrying Capacity, 2016 – 2026 (USD Million)
      4. 7.6.4. Latin America Autonomous Delivery Robots Market, by Components, 2016 – 2026
        1. 7.6.4.1. Latin America Autonomous Delivery Robots Market, by Components, 2016 – 2026 (USD Million)
      5. 7.6.5. Latin America Autonomous Delivery Robots Market, by Number of Wheels, 2016 – 2026
        1. 7.6.5.1. Latin America Autonomous Delivery Robots Market, by Number of Wheels, 2016 – 2026 (USD Million)
      6. 7.6.6. Latin America Autonomous Delivery Robots Market, by End-User Industry, 2016 – 2026
        1. 7.6.6.1. Latin America Autonomous Delivery Robots Market, by End-User Industry, 2016 – 2026 (USD Million)
      7. 7.6.7. Brazil
        1. 7.6.7.1. Brazil Autonomous Delivery Robots Market, 2016 – 2026 (USD Million)
      8. 7.6.8. Mexico
        1. 7.6.8.1. Mexico Autonomous Delivery Robots Market, 2016 – 2026 (USD Million)
      9. 7.6.9. Rest of Latin America
        1. 7.6.9.1. Rest of Latin America Autonomous Delivery Robots Market, 2016 – 2026 (USD Million)
    7. 7.7. The Middle-East and Africa
      1. 7.7.1. The Middle-East and Africa Autonomous Delivery Robots Market, 2016 – 2026 (USD Million)
        1. 7.7.1.1. The Middle-East and Africa Autonomous Delivery Robots Market, by Country, 2016 - 2026 (USD Million)
      2. 7.7.2. The Middle-East and Africa Autonomous Delivery Robots Market, by Types, 2016 – 2026
        1. 7.7.2.1. The Middle-East and Africa Autonomous Delivery Robots Market, by Types, 2016 – 2026 (USD Million)
      3. 7.7.3. The Middle-East and Africa Autonomous Delivery Robots Market, by Load Carrying Capacity, 2016 – 2026
        1. 7.7.3.1. The Middle-East and Africa Autonomous Delivery Robots Market, by Load Carrying Capacity, 2016 – 2026 (USD Million)
      4. 7.7.4. The Middle-East and Africa Autonomous Delivery Robots Market, by Components, 2016 – 2026
        1. 7.7.4.1. The Middle-East and Africa Autonomous Delivery Robots Market, by Components, 2016 – 2026 (USD Million)
      5. 7.7.5. The Middle-East and Africa Autonomous Delivery Robots Market, by Number of Wheels, 2016 – 2026
        1. 7.7.5.1. The Middle-East and Africa Autonomous Delivery Robots Market, by Number of Wheels, 2016 – 2026 (USD Million)
      6. 7.7.6. The Middle-East and Africa Autonomous Delivery Robots Market, by End-User Industry, 2016 – 2026
        1. 7.7.6.1. The Middle-East and Africa Autonomous Delivery Robots Market, by End-User Industry, 2016 – 2026 (USD Million)
      7. 7.7.7. GCC Countries
        1. 7.7.7.1. GCC Countries Autonomous Delivery Robots Market, 2016 – 2026 (USD Million)
      8. 7.7.8. South Africa
        1. 7.7.8.1. South Africa Autonomous Delivery Robots Market, 2016 – 2026 (USD Million)
      9. 7.7.9. Rest of Middle-East Africa
        1. 7.7.9.1. Rest of Middle-East Africa Autonomous Delivery Robots Market, 2016 – 2026 (USD Million)
  8. Chapter 8 Autonomous Delivery Robots Market – Competitive Landscape
    1. 8.1. Competitor Market Share – Revenue
    2. 8.2. Market Concentration Rate Analysis, Top 3 and Top 5 Players
    3. 8.3. Strategic Developments
      1. 8.3.1. Acquisitions and Mergers
      2. 8.3.2. New Products
      3. 8.3.3. Research & Development Activities
  9. Chapter 9 Company Profiles
    1. 9.1. Eliport
      1. 9.1.1. Company Overview
      2. 9.1.2. Product/Service Portfolio
      3. 9.1.3. Eliport Sales, Revenue, and Gross Margin
      4. 9.1.4. Eliport Revenue and Growth Rate
      5. 9.1.5. Eliport Market Share
      6. 9.1.6. Recent Initiatives, Funding/VC Activities, and Technological Innovations
    2. 9.2. Boston Dynamics
      1. 9.2.1. Company Overview
      2. 9.2.2. Product/Service Portfolio
      3. 9.2.3. Boston Dynamics Sales, Revenue, and Gross Margin
      4. 9.2.4. Boston Dynamics Revenue and Growth Rate
      5. 9.2.5. Boston Dynamics Market Share
      6. 9.2.6. Recent Initiatives, Funding/VC Activities, and Technological Innovations
    3. 9.3. Robomart
      1. 9.3.1. Company Overview
      2. 9.3.2. Product/Service Portfolio
      3. 9.3.3. Robomart Sales, Revenue, and Gross Margin
      4. 9.3.4. Robomart Revenue and Growth Rate
      5. 9.3.5. Robomart Market Share
      6. 9.3.6. Recent Initiatives, Funding/VC Activities, and Technological Innovations
    4. 9.4. Panasonic System Solutions Asia Pacific
      1. 9.4.1. Company Overview
      2. 9.4.2. Product/Service Portfolio
      3. 9.4.3. Panasonic System Solutions Asia Pacific Sales, Revenue, and Gross Margin
      4. 9.4.4. Panasonic System Solutions Asia Pacific Revenue and Growth Rate
      5. 9.4.5. Panasonic System Solutions Asia Pacific Market Share
      6. 9.4.6. Recent Initiatives, Funding/VC Activities, and Technological Innovations
    5. 9.5. Savioke
      1. 9.5.1. Company Overview
      2. 9.5.2. Product/Service Portfolio
      3. 9.5.3. Savioke Sales, Revenue, and Gross Margin
      4. 9.5.4. Savioke Revenue and Growth Rate
      5. 9.5.5. Savioke Market Share
      6. 9.5.6. Recent Initiatives, Funding/VC Activities, and Technological Innovations
    6. 9.6. Starship Technologies
      1. 9.6.1. Company Overview
      2. 9.6.2. Product/Service Portfolio
      3. 9.6.3. Starship Technologies Sales, Revenue, and Gross Margin
      4. 9.6.4. Starship Technologies Revenue and Growth Rate
      5. 9.6.5. Starship Technologies Market Share
      6. 9.6.6. Recent Initiatives, Funding/VC Activities, and Technological Innovations
      7. 9.7. JD.com
      8. 9.7.1. Company Overview
      9. 9.7.2. Product/Service Portfolio
        1. 9.7.3. JD.com Sales, Revenue, and Gross Margin
        2. 9.7.4. JD.com Revenue and Growth Rate
        3. 9.7.5. JD.com Market Share
      10. 9.7.6. Recent Initiatives, Funding/VC Activities, and Technological Innovations
    7. 9.8. Amazon Robotics
      1. 9.8.1. Company Overview
      2. 9.8.2. Product/Service Portfolio
      3. 9.8.3. Amazon Robotics Sales, Revenue, and Gross Margin
      4. 9.8.4. Amazon Robotics Revenue and Growth Rate
      5. 9.8.5. Amazon Robotics Market Share
      6. 9.8.6. Recent Initiatives, Funding/VC Activities, and Technological Innovations
    8. 9.9. Robby Technologies
      1. 9.9.1. Company Overview
      2. 9.9.2. Product/Service Portfolio
      3. 9.9.3. Robby Technologies Sales, Revenue, and Gross Margin
      4. 9.9.4. Robby Technologies Revenue and Growth Rate
      5. 9.9.5. Robby Technologies Market Share
      6. 9.9.6. Recent Initiatives, Funding/VC Activities, and Technological Innovations
    9. 9.10. Nuro
      1. 9.10.1. Company Overview
      2. 9.10.2. Product/Service Portfolio
      3. 9.10.3. Nuro Sales, Revenue, and Gross Margin
      4. 9.10.4. Nuro Revenue and Growth Rate
      5. 9.10.5. Nuro Market Share
      6. 9.10.6. Recent Initiatives, Funding/VC Activities, and Technological Innovations
  10. Chapter 10 Autonomous Delivery Robots — Industry Analysis
    1. 10.1. Introduction and Taxonomy
    2. 10.2. Autonomous Delivery Robots Market – Key Trends
      1. 10.2.1. Market Drivers
      2. 10.2.2. Market Restraints
      3. 10.2.3. Market Opportunities
    3. 10.3. Value Chain Analysis
    4. 10.4. Key Mandates and Regulations
    5. 10.5. Technology Roadmap and Timeline
    6. 10.6. Autonomous Delivery Robots Market – Attractiveness Analysis
      1. 10.6.1. By Types
      2. 10.6.2. By Load Carrying Capacity
      3. 10.6.3. By Components
      4. 10.6.4. By Number of Wheels
      5. 10.6.5. By End-User Industry
      6. 10.6.6. By Region
  11. Chapter 11 Industrial Chain, Sourcing Strategy, and Downstream Buyers
    1. 11.1. Autonomous Delivery Robots Industrial Chain Analysis
    2. 11.2. Downstream Buyers
    3. 11.3. Distributors/Traders List
  12. Chapter 12 Marketing Strategy Analysis
    1. 12.1. Marketing Channel
    2. 12.2. Direct Marketing
    3. 12.3. Indirect Marketing
    4. 12.4. Marketing Channel Development Trends
    5. 12.5. Economic/Political Environmental Change
  13. Chapter 13 Report Conclusion & Key Insights
    1. 13.1. Key Insights from Primary Interviews & Surveys Respondents
    2. 13.2. Key Takeaways from Analysts, Consultants, and Industry Leaders
  14. Chapter 14 Research Approach & Methodology
    1. 14.1. Report Description
    2. 14.2. Research Scope
    3. 14.3. Research Methodology
      1. 14.3.1. Secondary Research
      2. 14.3.2. Primary Research
      3. 14.3.3. Statistical Models
        1. 14.3.3.1. Company Share Analysis Model
        2. 14.3.3.2. Revenue Based Modeling
      4. 14.3.4. Research Limitations

      List of Figures

      Fig.1	Product Picture of Autonomous Delivery Robots
      Fig.2	Global Autonomous Delivery Robots Market, 2016 – 2026 (USD Million)
      Fig.3	Global Autonomous Delivery Robots Market Absolute Revenue Opportunity, 2016 – 2026 (USD Million)
      Fig.4	Global Autonomous Delivery Robots Market Incremental Revenue Opportunity, 2020 – 2026 (USD Million)
      Fig.5	Global Autonomous Delivery Robots Market Share, by Types, 2020 & 2026 (USD Million)
      Fig.6	Global Semi-Autonomous Robots Autonomous Delivery Robots Market, 2016 – 2026 (USD Million)
      Fig.7	Global Fully Autonomous Robots Autonomous Delivery Robots Market, 2016 – 2026 (USD Million)
      Fig.8	Global Autonomous Delivery Robots Market Share, by Load Carrying Capacity, 2020 & 2026 (USD Million)
      Fig.9	Global Up to 10 kg Autonomous Delivery Robots Market, 2016 – 2026 (USD Million)
      Fig.10	Global More than 50 kg Autonomous Delivery Robots Market, 2016 – 2026 (USD Million)
      Fig.11	Global Autonomous Delivery Robots Market Share, by Components, 2020 & 2026 (USD Million)
      Fig.12	Global Hardware Autonomous Delivery Robots Market, 2016 – 2026 (USD Million)
      Fig.13	Global Software Autonomous Delivery Robots Market, 2016 – 2026 (USD Million)
      Fig.14	Global Autonomous Delivery Robots Market Share, by Number of Wheels, 2020 & 2026 (USD Million)
      Fig.15	Global Three Wheels Autonomous Delivery Robots Market, 2016 – 2026 (USD Million)
      Fig.16	Global Four Wheels Autonomous Delivery Robots Market, 2016 – 2026 (USD Million)
      Fig.17	Global Six Wheels Autonomous Delivery Robots Market, 2016 – 2026 (USD Million)
      Fig.18	Global Autonomous Delivery Robots Market Share, by End-User Industry, 2020 & 2026 (USD Million)
      Fig.19	Global Logistics Autonomous Delivery Robots Market, 2016 – 2026 (USD Million)
      Fig.20	Global Healthcare Autonomous Delivery Robots Market, 2016 – 2026 (USD Million)
      Fig.21	Global Food & Beverages Autonomous Delivery Robots Market, 2016 – 2026 (USD Million)
      Fig.22	Global Retail Autonomous Delivery Robots Market, 2016 – 2026 (USD Million)
      Fig.23	Global Postal Autonomous Delivery Robots Market, 2016 – 2026 (USD Million)
      Fig.24	Global Others Autonomous Delivery Robots Market, 2016 – 2026 (USD Million)
      Fig.25	Global Autonomous Delivery Robots Market Share, by Region, 2020 & 2026 (USD Million)
      Fig.26	North America Autonomous Delivery Robots Market, 2016 – 2026 (USD Million)
      Fig.27	U.S. Autonomous Delivery Robots Market, 2016 – 2026 (USD Million)
      Fig.28	Canada Autonomous Delivery Robots Market, 2016 – 2026 (USD Million)
      Fig.29	Europe Autonomous Delivery Robots Market, 2016 – 2026 (USD Million)
      Fig.30	Germany Autonomous Delivery Robots Market, 2016 – 2026 (USD Million)
      Fig.31	France Autonomous Delivery Robots Market, 2016 – 2026 (USD Million)
      Fig.32	U.K. Autonomous Delivery Robots Market, 2016 – 2026 (USD Million)
      Fig.33	Italy Autonomous Delivery Robots Market, 2016 – 2026 (USD Million)
      Fig.34	Spain Autonomous Delivery Robots Market, 2016 – 2026 (USD Million)
      Fig.35	Rest of Europe Autonomous Delivery Robots Market, 2016 – 2026 (USD Million)
      Fig.36	Asia Pacific Autonomous Delivery Robots Market, 2016 – 2026 (USD Million)
      Fig.37	China Autonomous Delivery Robots Market, 2016 – 2026 (USD Million)
      Fig.38	Japan Autonomous Delivery Robots Market, 2016 – 2026 (USD Million)
      Fig.39	India Autonomous Delivery Robots Market, 2016 – 2026 (USD Million)
      Fig.40	South  Korea Autonomous Delivery Robots Market, 2016 – 2026 (USD Million)
      Fig.41	South-East Asia Autonomous Delivery Robots Market, 2016 – 2026 (USD Million)
      Fig.42	Rest of Asia Pacific Autonomous Delivery Robots Market, 2016 – 2026 (USD Million)
      Fig.43	Latin America Autonomous Delivery Robots Market, 2016 – 2026 (USD Million)
      Fig.44	Brazil Autonomous Delivery Robots Market, 2016 – 2026 (USD Million)
      Fig.45	Mexico Autonomous Delivery Robots Market, 2016 – 2026 (USD Million)
      Fig.46	Rest of Latin America Autonomous Delivery Robots Market, 2016 – 2026 (USD Million)
      Fig.47	The Middle-East and Africa Autonomous Delivery Robots Market, 2016 – 2026 (USD Million)
      Fig.48	GCC Countries Autonomous Delivery Robots Market, 2016 – 2026 (USD Million)
      Fig.49	South Africa Autonomous Delivery Robots Market, 2016 – 2026 (USD Million)
      Fig.50	Rest of Middle-East Africa Autonomous Delivery Robots Market, 2016 – 2026 (USD Million)
      Fig.51	Competitor Market Share – Revenue
      Fig.52	Eliport Revenue and Growth Rate
      Fig.53	Eliport Market Share
      Fig.54	Boston Dynamics Revenue and Growth Rate
      Fig.55	Boston Dynamics Market Share
      Fig.56	Robomart Revenue and Growth Rate
      Fig.57	Robomart Market Share
      Fig.58	Panasonic System Solutions Asia Pacific Revenue and Growth Rate
      Fig.59	Panasonic System Solutions Asia Pacific Market Share
      Fig.60	Savioke Revenue and Growth Rate
      Fig.61	Savioke Market Share
      Fig.62	Starship Technologies Revenue and Growth Rate
      Fig.63	Starship Technologies Market Share
      Fig.64	JD.com Revenue and Growth Rate
      Fig.65	JD.com Market Share
      Fig.66	Amazon Robotics Revenue and Growth Rate
      Fig.67	Amazon Robotics Market Share
      Fig.68	Robby Technologies Revenue and Growth Rate
      Fig.69	Robby Technologies Market Share
      Fig.70	Nuro Revenue and Growth Rate
      Fig.71	Nuro Market Share
      Fig.72	Market Dynamics
      Fig.73	Global Autonomous Delivery Robots – Value Chain Analysis
      Fig.74	Key Mandates and Regulations
      Fig.75	Technology Roadmap and Timeline
      Fig.76	Market Attractiveness Analysis – By Types
      Fig.77	Market Attractiveness Analysis – By Load Carrying Capacity
      Fig.78	Market Attractiveness Analysis – By Components
      Fig.79	Market Attractiveness Analysis – By Number of Wheels
      Fig.80	Market Attractiveness Analysis – By End-User Industry
      Fig.81	Market Attractiveness Analysis – By Region
      Fig.82	Autonomous Delivery Robots Industrial Chain Analysis
      Fig.83	Market Channels
      Fig.84	Marketing Channel Development Trend
      Fig.85	Growth in World Gross Product, 2008-2018
      

      List of Tables

      Table 1	Global Autonomous Delivery Robots Market, 2020 & 2026 (USD Million)
      Table 2	Global Autonomous Delivery Robots Market, by Types, 2016 – 2026 (USD Million)
      Table 3	Global Autonomous Delivery Robots Market, by Load Carrying Capacity, 2016 – 2026 (USD Million)
      Table 4	Global Autonomous Delivery Robots Market, by Components, 2016 – 2026 (USD Million)
      Table 5	Global Autonomous Delivery Robots Market, by Number of Wheels, 2016 – 2026 (USD Million)
      Table 6	Global Autonomous Delivery Robots Market, by End-User Industry, 2016 – 2026 (USD Million)
      Table 7	Global Autonomous Delivery Robots Market, by Region, 2016 – 2026 (USD Million)
      Table 8	North America Autonomous Delivery Robots Market, by Country, 2016 – 2026 (USD Million)
      Table 9	North America Autonomous Delivery Robots Market, by Types, 2016 – 2026 (USD Million)
      Table 10 North America Autonomous Delivery Robots Market, by Load Carrying Capacity, 2016 – 2026 (USD Million)
      Table 11 North America Autonomous Delivery Robots Market, by Components, 2016 – 2026 (USD Million)
      Table 12 North America Autonomous Delivery Robots Market, by Number of Wheels, 2016 – 2026 (USD Million)
      Table 13 North America Autonomous Delivery Robots Market, by End-User Industry, 2016 – 2026 (USD Million)
      Table 14 Europe Autonomous Delivery Robots Market, by Country, 2016 – 2026 (USD Million)
      Table 15 Europe Autonomous Delivery Robots Market, by Types, 2016 – 2026 (USD Million)
      Table 16 Europe Autonomous Delivery Robots Market, by Load Carrying Capacity, 2016 – 2026 (USD Million)
      Table 17 Europe Autonomous Delivery Robots Market, by Components, 2016 – 2026 (USD Million)
      Table 18 Europe Autonomous Delivery Robots Market, by Number of Wheels, 2016 – 2026 (USD Million)
      Table 19 Europe Autonomous Delivery Robots Market, by End-User Industry, 2016 – 2026 (USD Million)
      Table 20 Asia Pacific Autonomous Delivery Robots Market, by Country, 2016 – 2026 (USD Million)
      Table 21 Asia Pacific Autonomous Delivery Robots Market, by Types, 2016 – 2026 (USD Million)
      Table 22 Asia Pacific Autonomous Delivery Robots Market, by Load Carrying Capacity, 2016 – 2026 (USD Million)
      Table 23 Asia Pacific Autonomous Delivery Robots Market, by Components, 2016 – 2026 (USD Million)
      Table 24 Asia Pacific Autonomous Delivery Robots Market, by Number of Wheels, 2016 – 2026 (USD Million)
      Table 25 Asia Pacific Autonomous Delivery Robots Market, by End-User Industry, 2016 – 2026 (USD Million)
      Table 26 Latin America Autonomous Delivery Robots Market, by Country, 2016 – 2026 (USD Million)
      Table 27 Latin America Autonomous Delivery Robots Market, by Types, 2016 – 2026 (USD Million)
      Table 28 Latin America Autonomous Delivery Robots Market, by Load Carrying Capacity, 2016 – 2026 (USD Million)
      Table 29 Latin America Autonomous Delivery Robots Market, by Components, 2016 – 2026 (USD Million)
      Table 30 Latin America Autonomous Delivery Robots Market, by Number of Wheels, 2016 – 2026 (USD Million)
      Table 31 Latin America Autonomous Delivery Robots Market, by End-User Industry, 2016 – 2026 (USD Million)
      Table 32 The Middle-East and Africa Autonomous Delivery Robots Market, by Country, 2016 – 2026 (USD Million)
      Table 33 The Middle-East and Africa Autonomous Delivery Robots Market, by Types, 2016 – 2026 (USD Million)
      Table 34 The Middle-East and Africa Autonomous Delivery Robots Market, by Load Carrying Capacity, 2016 – 2026 (USD Million)
      Table 35 The Middle-East and Africa Autonomous Delivery Robots Market, by Components, 2016 – 2026 (USD Million)
      Table 36 The Middle-East and Africa Autonomous Delivery Robots Market, by Number of Wheels, 2016 – 2026 (USD Million)
      Table 37 The Middle-East and Africa Autonomous Delivery Robots Market, by End-User Industry, 2016 – 2026 (USD Million)
      Table 38 Global Autonomous Delivery Robots Market - Company Revenue Analysis, 2016 – 2020 (USD Million)
      Table 39 Global Autonomous Delivery Robots Market - Company Revenue Share Analysis, 2016 – 2020 (%)
      Table 40 Acquisitions and Mergers
      Table 41 Market Drivers – Impact Analysis
      Table 42 Market Restraints
      Table 43 Market Opportunities
      Table 44 Major Buyers of Autonomous Delivery Robots
      Table 45 Distributors/Traders of Autonomous Delivery Robots by Region
      

Industry Major Market Players

  • Eliport
  • Boston Dynamics
  • Robomart
  • Panasonic System Solutions Asia Pacific
  • Savioke
  • Starship Technologies
  • JD.com
  • Amazon Robotics
  • Robby Technologies
  • Nuro