Search Market Research Report

Discover Our Latest Reports
Discover Our Featured Reports
Discover Top Selling Reports

Augmented and Virtual Reality Market Size, Share Global Analysis Report, 2021 – 2026

report img

Augmented and Virtual Reality Market By Technology (Augmented Reality & Virtual Reality), By Offering (Hardware & Software), By Application (Augmented Reality & Virtual Reality), And By Regions - Global & Regional Industry Perspective, Comprehensive Analysis, and Forecast 2021 – 2026

Industry Insights

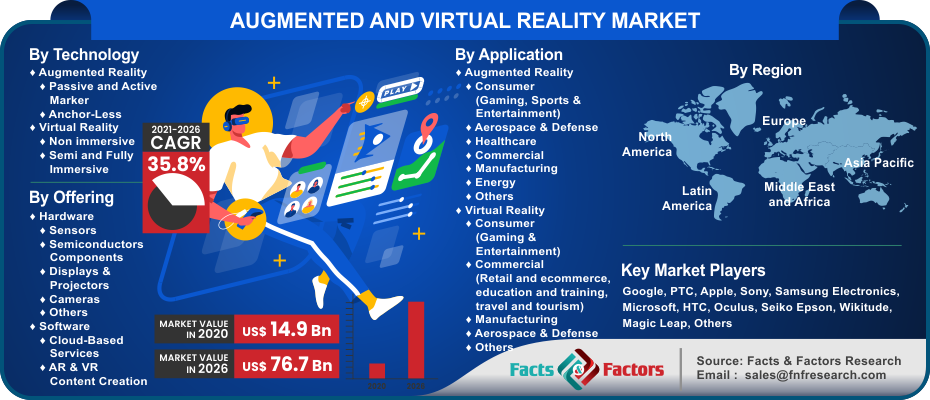
[197+ Pages Report] The latest findings and offers on the augmented and virtual reality market released by Facts & Factors offer a complete market overview. In this report, the global augmented and virtual reality market is estimated to have valued at USD 14.9 Billion in the year 2020 and will grow at an estimated CAGR rate of 35.8% to an overall value of USD 76.7 Billion in the year 2026.

logoMarket Overview

Augmented reality or AR is an advanced version of reality that used technology for providing digital information in the form of an image. The most common usage of AR-based applications is found in smartphones and tablets. Virtual reality is a technology that has the ability to create a digital environment that offers the user an experience with the help of simulated computer technology. Most of the applications that are often viewed on AR and VR are perceived as a real place and can be further photographed and captured.

logoIndustry Growth Factors

The global augmented and virtual reality market is expected to grow at an exception rate during the advent of the forecast period owing to contributing factors such as rising demands from applications in healthcare coupled with increasing investments in the AR sector to name a few. Additionally, rising demand for AR in the retail and e-commerce sector coupled with the increasing availability of affordable VR devices will increase the footprint of the global augmented and virtual reality market during the advent of the forecast period. Moreover, factors pertaining to the increased adoption of HMDs coupled with advancements of technologies will fuel the growth of the global augmented and virtual reality market during the advent of the forecast period.

The global augmented and virtual reality market is driven by rising investment opportunities and increasing demands from the gaming and entertainment sector to name a few. Factors such as increasing usage of AR and VR in visualization measures coupled with caring and supporting solutions for patients after they are discharged will fuel the growth of the global augmented and virtual reality market during the advent of the forecast period. However, a higher cost of implementation coupled with increasing technical complexities is expected to hamper the growth of the global augmented and virtual reality market during the advent of the forecast period.

Augmented and Virtual Reality Market

To know more about this report | Request Free Sample Copy

logoSegmentation Analysis

The global augmented and virtual reality market is segmented into technology, offering, application, and regions.

On the basis of technology, the global augmented and virtual reality market is divided into augmented reality & virtual reality. The segment pertaining to virtual reality is expected to witness the largest market share during the advent of the forecast period owing to the increased focus of most companies on developing immersive video games coupled with increasing innovative measures in VR-enabled headsets HMDs to name a few. Based on offering, the global augmented and virtual reality market is categorized into hardware and software. The software segment is expected to witness the largest market share during the advent of the forecast period owing to rising demand for mass consumerization coupled with increasing need for maintaining social distancing measures toward curbing the spread of the ongoing pandemic to name a few. The global augmented and virtual reality market is fragmented into augmented reality and virtual reality. The augmented reality segment is expected to occupy the largest market share during the advent of the forecast period owing to technological advancements coupled with the rising integration of AR based measures toward the sector of retail sales to name a few.

logo Report Scope

Report Attribute

Details

Market Size in 2020

USD 14.9 Billion

Projected Market Size in 2026

USD 76.7 Billion

CAGR Growth Rate

35.8% CAGR

Base Year

2020

Forecast Years

2021-2026

Key Market Players

Google, PTC, Apple, Sony, Samsung Electronics, Microsoft, HTC, Oculus, Seiko Epson, Wikitude, Magic Leap, and Others

Key Segments

Technology, Offering, Application, and Region

Major Regions Covered

North America, Europe, Asia Pacific, Latin America, and Middle East & Africa

Purchase Options

Request customized purchase options to meet your research needs. Explore purchase options

logo Regional Analysis

Asia-Pacific is expected to witness the fastest growing CAGR during the advent of the forecast period owing to the presence of display panel manufacturers in the region coupled with increased adoption of advanced technologies to name a few. Additionally, the rising number of players in the region coupled with higher growth in the commercial and consumer sector is expected to increase the footprint of the augmented and virtual reality market during the advent of the forecast period. Rising investment opportunities created by lucrative business dealings will further push the boundaries of the augmented and virtual reality market during the advent of the forecast period.

logo Competitive Players

The key market participants for the global augmented and virtual reality market are :

  • Google
  • PTC
  • Apple
  • Sony
  • Samsung Electronics
  • Microsoft
  • HTC
  • Oculus
  • Seiko Epson
  • Wikitude
  • Magic Leap
  • Blippar
  • Upskill
  • MAXST
  • EON Reality
  • Vuzix
  • CyberGlove Systems
  • Leap Motion
  • Sixense Enterprises
  • DAQRI
  • Zugara
  • among others

logo By Technology Segment Analysis

  • Augmented Reality
    • Passive and Active Marker
    • Anchor-Less
  • Virtual Reality
    • Non immersive
    • Semi and Fully Immersive

logo By Offering Segment Analysis

  • Hardware
    • Sensors
    • Semiconductors Components
    • Displays & Projectors
    • Cameras
    • Others
  • Software
    • Cloud-Based Services
    • AR & VR Content Creation

logo By Application Segment Analysis

  • Augmented Reality
    • Consumer (Gaming, Sports & Entertainment)
    • Aerospace & Defense
    • Healthcare
    • Commercial
    • Manufacturing
    • Energy
    • Others
  • Virtual Reality
    • Consumer (Gaming & Entertainment)
    • Commercial (Retail and ecommerce, education and training, travel and tourism)
    • Manufacturing
    • Aerospace & Defense
    • Others

logo By Regional Segment Analysis

  • North America
    • U.S.
    • Canada
  • Europe
    • UK
    • France
    • Germany
    • Italy
    • Spain
    • Rest of Europe
  • Asia Pacific
    • China
    • Japan
    • India
    • South Korea
    • Southeast Asia
    • Rest of Asia Pacific
  • Latin America
    • Brazil
    • Mexico
    • Rest of Latin America
  • Middle East and Africa
    • GCC Countries
    • South Africa
    • Rest of MEA

Table of Content

  1. Chapter 1 Executive Summary
    1. 1.1. Introduction of Augmented and Virtual Reality
    2. 1.2. Global Augmented and Virtual Reality Market, 2019 & 2026 (USD Billion)
    3. 1.3. Global Augmented and Virtual Reality Market, 2016 – 2026 (USD Billion)
    4. 1.4. Global Augmented and Virtual Reality Market Absolute Revenue Opportunity, 2016 – 2026 (USD Billion)
    5. 1.5. Global Augmented and Virtual Reality Market Incremental Revenue Opportunity, 2020 – 2026 (USD Billion)
  2. Chapter 2 Augmented and Virtual Reality Market – Technology Analysis
    1. 2.1. Global Augmented and Virtual Reality Market – Technology Overview
    2. 2.2. Global Augmented and Virtual Reality Market Share, by Technology, 2019 & 2026 (USD Billion)
    3. 2.3. Augmented Reality
      1. 2.3.1. Global Augmented Reality Augmented and Virtual Reality Market, 2016 – 2026 (USD Billion)
    4. 2.4. Virtual Reality
      1. 2.4.1. Global Virtual Reality Augmented and Virtual Reality Market, 2016 – 2026 (USD Billion)
  3. Chapter 3 Augmented and Virtual Reality Market – Offering Analysis
    1. 3.1. Global Augmented and Virtual Reality Market – Offering Overview
    2. 3.2. Global Augmented and Virtual Reality Market Share, by Offering, 2019 & 2026 (USD Billion)
    3. 3.3. Hardware
      1. 3.3.1. Global Hardware Augmented and Virtual Reality Market, 2016 – 2026 (USD Billion)
    4. 3.4. Software
      1. 3.4.1. Global Software Augmented and Virtual Reality Market, 2016 – 2026 (USD Billion)
  4. Chapter 4 Augmented and Virtual Reality Market – Application Analysis
    1. 4.1. Global Augmented and Virtual Reality Market – Application Overview
    2. 4.2. Global Augmented and Virtual Reality Market Share, by Application, 2019 & 2026 (USD Billion)
    3. 4.3. Augmented Reality
      1. 4.3.1. Global Augmented Reality Augmented and Virtual Reality Market, 2016 – 2026 (USD Billion)
    4. 4.4. Virtual Reality
      1. 4.4.1. Global Virtual Reality Augmented and Virtual Reality Market, 2016 – 2026 (USD Billion)
  5. Chapter 5 Augmented and Virtual Reality Market – Regional Analysis
    1. 5.1. Global Augmented and Virtual Reality Market Regional Overview
    2. 5.2. Global Augmented and Virtual Reality Market Share, by Region, 2019 & 2026 (USD Billion)
    3. 5.3. North America
      1. 5.3.1. North America Augmented and Virtual Reality Market, 2016 – 2026 (USD Billion)
        1. 5.3.1.1. North America Augmented and Virtual Reality Market, by Country, 2016 - 2026 (USD Billion)
      2. 5.3.2. North America Augmented and Virtual Reality Market, by Technology, 2016 – 2026
        1. 5.3.2.1. North America Augmented and Virtual Reality Market, by Technology, 2016 – 2026 (USD Billion)
      3. 5.3.3. North America Augmented and Virtual Reality Market, by Offering, 2016 – 2026
        1. 5.3.3.1. North America Augmented and Virtual Reality Market, by Offering, 2016 – 2026 (USD Billion)
      4. 5.3.4. North America Augmented and Virtual Reality Market, by Application, 2016 – 2026
        1. 5.3.4.1. North America Augmented and Virtual Reality Market, by Application, 2016 – 2026 (USD Billion)
      5. 5.3.5. U.S.
        1. 5.3.5.1. U.S. Augmented and Virtual Reality Market, 2016 – 2026 (USD Billion)
      6. 5.3.6. Canada
        1. 5.3.6.1. Canada Augmented and Virtual Reality Market, 2016 – 2026 (USD Billion)
    4. 5.4. Europe
      1. 5.4.1. Europe Augmented and Virtual Reality Market, 2016 – 2026 (USD Billion)
        1. 5.4.1.1. Europe Augmented and Virtual Reality Market, by Country, 2016 - 2026 (USD Billion)
      2. 5.4.2. Europe Augmented and Virtual Reality Market, by Technology, 2016 – 2026
        1. 5.4.2.1. Europe Augmented and Virtual Reality Market, by Technology, 2016 – 2026 (USD Billion)
      3. 5.4.3. Europe Augmented and Virtual Reality Market, by Offering, 2016 – 2026
        1. 5.4.3.1. Europe Augmented and Virtual Reality Market, by Offering, 2016 – 2026 (USD Billion)
      4. 5.4.4. Europe Augmented and Virtual Reality Market, by Application, 2016 – 2026
        1. 5.4.4.1. Europe Augmented and Virtual Reality Market, by Application, 2016 – 2026 (USD Billion)
      5. 5.4.5. Germany
        1. 5.4.5.1. Germany Augmented and Virtual Reality Market, 2016 – 2026 (USD Billion)
      6. 5.4.6. France
        1. 5.4.6.1. France Augmented and Virtual Reality Market, 2016 – 2026 (USD Billion)
      7. 5.4.7. U.K.
        1. 5.4.7.1. U.K. Augmented and Virtual Reality Market, 2016 – 2026 (USD Billion)
      8. 5.4.8. Italy
        1. 5.4.8.1. Italy Augmented and Virtual Reality Market, 2016 – 2026 (USD Billion)
      9. 5.4.9. Spain
        1. 5.4.9.1. Spain Augmented and Virtual Reality Market, 2016 – 2026 (USD Billion)
      10. 5.4.10. Rest of Europe
        1. 5.4.10.1. Rest of Europe Augmented and Virtual Reality Market, 2016 – 2026 (USD Billion)
    5. 5.5. Asia Pacific
      1. 5.5.1. Asia Pacific Augmented and Virtual Reality Market, 2016 – 2026 (USD Billion)
        1. 5.5.1.1. Asia Pacific Augmented and Virtual Reality Market, by Country, 2016 - 2026 (USD Billion)
      2. 5.5.2. Asia Pacific Augmented and Virtual Reality Market, by Technology, 2016 – 2026
        1. 5.5.2.1. Asia Pacific Augmented and Virtual Reality Market, by Technology, 2016 – 2026 (USD Billion)
      3. 5.5.3. Asia Pacific Augmented and Virtual Reality Market, by Offering, 2016 – 2026
        1. 5.5.3.1. Asia Pacific Augmented and Virtual Reality Market, by Offering, 2016 – 2026 (USD Billion)
      4. 5.5.4. Asia Pacific Augmented and Virtual Reality Market, by Application, 2016 – 2026
        1. 5.5.4.1. Asia Pacific Augmented and Virtual Reality Market, by Application, 2016 – 2026 (USD Billion)
      5. 5.5.5. China
        1. 5.5.5.1. China Augmented and Virtual Reality Market, 2016 – 2026 (USD Billion)
      6. 5.5.6. Japan
        1. 5.5.6.1. Japan Augmented and Virtual Reality Market, 2016 – 2026 (USD Billion)
      7. 5.5.7. India
        1. 5.5.7.1. India Augmented and Virtual Reality Market, 2016 – 2026 (USD Billion)
      8. 5.5.8. South Korea
        1. 5.5.8.1. South Korea Augmented and Virtual Reality Market, 2016 – 2026 (USD Billion)
      9. 5.5.9. South-East Asia
        1. 5.5.9.1. South-East Asia Augmented and Virtual Reality Market, 2016 – 2026 (USD Billion)
      10. 5.5.10. Rest of Asia Pacific
        1. 5.5.10.1. Rest of Asia Pacific Augmented and Virtual Reality Market, 2016 – 2026 (USD Billion)
    6. 5.6. Latin America
      1. 5.6.1. Latin America Augmented and Virtual Reality Market, 2016 – 2026 (USD Billion)
        1. 5.6.1.1. Latin America Augmented and Virtual Reality Market, by Country, 2016 - 2026 (USD Billion)
      2. 5.6.2. Latin America Augmented and Virtual Reality Market, by Technology, 2016 – 2026
        1. 5.6.2.1. Latin America Augmented and Virtual Reality Market, by Technology, 2016 – 2026 (USD Billion)
      3. 5.6.3. Latin America Augmented and Virtual Reality Market, by Offering, 2016 – 2026
        1. 5.6.3.1. Latin America Augmented and Virtual Reality Market, by Offering, 2016 – 2026 (USD Billion)
      4. 5.6.4. Latin America Augmented and Virtual Reality Market, by Application, 2016 – 2026
        1. 5.6.4.1. Latin America Augmented and Virtual Reality Market, by Application, 2016 – 2026 (USD Billion)
      5. 5.6.5. Brazil
        1. 5.6.5.1. Brazil Augmented and Virtual Reality Market, 2016 – 2026 (USD Billion)
      6. 5.6.6. Mexico
        1. 5.6.6.1. Mexico Augmented and Virtual Reality Market, 2016 – 2026 (USD Billion)
      7. 5.6.7. Rest of Latin America
        1. 5.6.7.1. Rest of Latin America Augmented and Virtual Reality Market, 2016 – 2026 (USD Billion)
    7. 5.7. The Middle-East and Africa
      1. 5.7.1. The Middle-East and Africa Augmented and Virtual Reality Market, 2016 – 2026 (USD Billion)
        1. 5.7.1.1. The Middle-East and Africa Augmented and Virtual Reality Market, by Country, 2016 - 2026 (USD Billion)
      2. 5.7.2. The Middle-East and Africa Augmented and Virtual Reality Market, by Technology, 2016 – 2026
        1. 5.7.2.1. The Middle-East and Africa Augmented and Virtual Reality Market, by Technology, 2016 – 2026 (USD Billion)
      3. 5.7.3. The Middle-East and Africa Augmented and Virtual Reality Market, by Offering, 2016 – 2026
        1. 5.7.3.1. The Middle-East and Africa Augmented and Virtual Reality Market, by Offering, 2016 – 2026 (USD Billion)
      4. 5.7.4. The Middle-East and Africa Augmented and Virtual Reality Market, by Application, 2016 – 2026
        1. 5.7.4.1. The Middle-East and Africa Augmented and Virtual Reality Market, by Application, 2016 – 2026 (USD Billion)
      5. 5.7.5. GCC Countries
        1. 5.7.5.1. GCC Countries Augmented and Virtual Reality Market, 2016 – 2026 (USD Billion)
      6. 5.7.6. South Africa
        1. 5.7.6.1. South Africa Augmented and Virtual Reality Market, 2016 – 2026 (USD Billion)
      7. 5.7.7. Rest of Middle-East Africa
        1. 5.7.7.1. Rest of Middle-East Africa Augmented and Virtual Reality Market, 2016 – 2026 (USD Billion)
  6. Chapter 6 Augmented and Virtual Reality Market – Competitive Landscape
    1. 6.1. Competitor Market Share – Revenue
    2. 6.2. Market Concentration Rate Analysis, Top 3 and Top 5 Players
    3. 6.3. Strategic Developments
      1. 6.3.1. Acquisitions and Mergers
      2. 6.3.2. New Products
      3. 6.3.3. Research & Development Activities
  7. Chapter 7 Company Profiles
    1. 7.1. Google
      1. 7.1.1. Company Overview
      2. 7.1.2. Product/Service Portfolio
      3. 7.1.3. Google Sales, Revenue, and Gross Margin
      4. 7.1.4. Google Revenue and Growth Rate
      5. 7.1.5. Google Market Share
      6. 7.1.6. Recent Initiatives, Funding/VC Activities, and Technological Innovations
    2. 7.2. PTC
      1. 7.2.1. Company Overview
      2. 7.2.2. Product/Service Portfolio
      3. 7.2.3. PTC Sales, Revenue, and Gross Margin
      4. 7.2.4. PTC Revenue and Growth Rate
      5. 7.2.5. PTC Market Share
      6. 7.2.6. Recent Initiatives, Funding/VC Activities, and Technological Innovations
    3. 7.3. Apple
      1. 7.3.1. Company Overview
      2. 7.3.2. Product/Service Portfolio
      3. 7.3.3. Apple Sales, Revenue, and Gross Margin
      4. 7.3.4. Apple Revenue and Growth Rate
      5. 7.3.5. Apple Market Share
      6. 7.3.6. Recent Initiatives, Funding/VC Activities, and Technological Innovations
    4. 7.4. Sony
      1. 7.4.1. Company Overview
      2. 7.4.2. Product/Service Portfolio
      3. 7.4.3. Sony Sales, Revenue, and Gross Margin
      4. 7.4.4. Sony Revenue and Growth Rate
      5. 7.4.5. Sony Market Share
      6. 7.4.6. Recent Initiatives, Funding/VC Activities, and Technological Innovations
    5. 7.5. Samsung Electronics
      1. 7.5.1. Company Overview
      2. 7.5.2. Product/Service Portfolio
      3. 7.5.3. Samsung Electronics Sales, Revenue, and Gross Margin
      4. 7.5.4. Samsung Electronics Revenue and Growth Rate
      5. 7.5.5. Samsung Electronics Market Share
      6. 7.5.6. Recent Initiatives, Funding/VC Activities, and Technological Innovations
    6. 7.6. Microsoft
      1. 7.6.1. Company Overview
      2. 7.6.2. Product/Service Portfolio
      3. 7.6.3. Microsoft Sales, Revenue, and Gross Margin
      4. 7.6.4. Microsoft Revenue and Growth Rate
      5. 7.6.5. Microsoft Market Share
      6. 7.6.6. Recent Initiatives, Funding/VC Activities, and Technological Innovations
    7. 7.7. HTC
      1. 7.7.1. Company Overview
      2. 7.7.2. Product/Service Portfolio
      3. 7.7.3. HTC Sales, Revenue, and Gross Margin
      4. 7.7.4. HTC Revenue and Growth Rate
      5. 7.7.5. HTC Market Share
      6. 7.7.6. Recent Initiatives, Funding/VC Activities, and Technological Innovations
    8. 7.8. Oculus
      1. 7.8.1. Company Overview
      2. 7.8.2. Product/Service Portfolio
      3. 7.8.3. Oculus Sales, Revenue, and Gross Margin
      4. 7.8.4. Oculus Revenue and Growth Rate
      5. 7.8.5. Oculus Market Share
      6. 7.8.6. Recent Initiatives, Funding/VC Activities, and Technological Innovations
    9. 7.9. Seiko Epson
      1. 7.9.1. Company Overview
      2. 7.9.2. Product/Service Portfolio
      3. 7.9.3. Seiko Epson Sales, Revenue, and Gross Margin
      4. 7.9.4. Seiko Epson Revenue and Growth Rate
      5. 7.9.5. Seiko Epson Market Share
      6. 7.9.6. Recent Initiatives, Funding/VC Activities, and Technological Innovations
    10. 7.10. Wikitude
      1. 7.10.1. Company Overview
      2. 7.10.2. Product/Service Portfolio
      3. 7.10.3. Wikitude Sales, Revenue, and Gross Margin
      4. 7.10.4. Wikitude Revenue and Growth Rate
      5. 7.10.5. Wikitude Market Share
      6. 7.10.6. Recent Initiatives, Funding/VC Activities, and Technological Innovations
    11. 7.11. Magic Leap
      1. 7.11.1. Company Overview
      2. 7.11.2. Product/Service Portfolio
      3. 7.11.3. Magic Leap Sales, Revenue, and Gross Margin
      4. 7.11.4. Magic Leap Revenue and Growth Rate
      5. 7.11.5. Magic Leap Market Share
      6. 7.11.6. Recent Initiatives, Funding/VC Activities, and Technological Innovations
    12. 7.12. Blippar
      1. 7.12.1. Company Overview
      2. 7.12.2. Product/Service Portfolio
      3. 7.12.3. Blippar Sales, Revenue, and Gross Margin
      4. 7.12.4. Blippar Revenue and Growth Rate
      5. 7.12.5. Blippar Market Share
      6. 7.12.6. Recent Initiatives, Funding/VC Activities, and Technological Innovations
    13. 7.13. Upskill
      1. 7.13.1. Company Overview
      2. 7.13.2. Product/Service Portfolio
      3. 7.13.3. Upskill Sales, Revenue, and Gross Margin
      4. 7.13.4. Upskill Revenue and Growth Rate
      5. 7.13.5. Upskill Market Share
      6. 7.13.6. Recent Initiatives, Funding/VC Activities, and Technological Innovations
    14. 7.14. MAXST
      1. 7.14.1. Company Overview
      2. 7.14.2. Product/Service Portfolio
      3. 7.14.3. MAXST Sales, Revenue, and Gross Margin
      4. 7.14.4. MAXST Revenue and Growth Rate
      5. 7.14.5. MAXST Market Share
      6. 7.14.6. Recent Initiatives, Funding/VC Activities, and Technological Innovations
    15. 7.15. EON Reality
      1. 7.15.1. Company Overview
      2. 7.15.2. Product/Service Portfolio
      3. 7.15.3. EON Reality Sales, Revenue, and Gross Margin
      4. 7.15.4. EON Reality Revenue and Growth Rate
      5. 7.15.5. EON Reality Market Share
      6. 7.15.6. Recent Initiatives, Funding/VC Activities, and Technological Innovations
    16. 7.16. Vuzix
      1. 7.16.1. Company Overview
      2. 7.16.2. Product/Service Portfolio
      3. 7.16.3. Vuzix Sales, Revenue, and Gross Margin
      4. 7.16.4. Vuzix Revenue and Growth Rate
      5. 7.16.5. Vuzix Market Share
      6. 7.16.6. Recent Initiatives, Funding/VC Activities, and Technological Innovations
    17. 7.17. CyberGlove Systems
      1. 7.17.1. Company Overview
      2. 7.17.2. Product/Service Portfolio
      3. 7.17.3. CyberGlove Systems Sales, Revenue, and Gross Margin
      4. 7.17.4. CyberGlove Systems Revenue and Growth Rate
      5. 7.17.5. CyberGlove Systems Market Share
      6. 7.17.6. Recent Initiatives, Funding/VC Activities, and Technological Innovations
    18. 7.18. Leap Motion
      1. 7.18.1. Company Overview
      2. 7.18.2. Product/Service Portfolio
      3. 7.18.3. Leap Motion Sales, Revenue, and Gross Margin
      4. 7.18.4. Leap Motion Revenue and Growth Rate
      5. 7.18.5. Leap Motion Market Share
      6. 7.18.6. Recent Initiatives, Funding/VC Activities, and Technological Innovations
    19. 7.19. Sixense Enterprises
      1. 7.19.1. Company Overview
      2. 7.19.2. Product/Service Portfolio
      3. 7.19.3. Sixense Enterprises Sales, Revenue, and Gross Margin
      4. 7.19.4. Sixense Enterprises Revenue and Growth Rate
      5. 7.19.5. Sixense Enterprises Market Share
      6. 7.19.6. Recent Initiatives, Funding/VC Activities, and Technological Innovations
    20. 7.20. DAQRI
      1. 7.20.1. Company Overview
      2. 7.20.2. Product/Service Portfolio
      3. 7.20.3. DAQRI Sales, Revenue, and Gross Margin
      4. 7.20.4. DAQRI Revenue and Growth Rate
      5. 7.20.5. DAQRI Market Share
      6. 7.20.6. Recent Initiatives, Funding/VC Activities, and Technological Innovations
    21. 7.21. Zugara
      1. 7.21.1. Company Overview
      2. 7.21.2. Product/Service Portfolio
      3. 7.21.3. Zugara Sales, Revenue, and Gross Margin
      4. 7.21.4. Zugara Revenue and Growth Rate
      5. 7.21.5. Zugara Market Share
      6. 7.21.6. Recent Initiatives, Funding/VC Activities, and Technological Innovations
  8. Chapter 8 Augmented and Virtual Reality — Industry Analysis
    1. 8.1. Introduction and Taxonomy
    2. 8.2. Augmented and Virtual Reality Market – Key Trends
      1. 8.2.1. Market Drivers
      2. 8.2.2. Market Restraints
      3. 8.2.3. Market Opportunities
    3. 8.3. Value Chain Analysis
    4. 8.4. Key Mandates and Regulations
    5. 8.5. Technology Roadmap and Timeline
    6. 8.6. Augmented and Virtual Reality Market – Attractiveness Analysis
      1. 8.6.1. By Technology
      2. 8.6.2. By Offering
      3. 8.6.3. By Application
      4. 8.6.4. By Region
  9. Chapter 9 Industrial Chain, Sourcing Strategy, and Downstream Buyers
    1. 9.1. Augmented and Virtual Reality Industrial Chain Analysis
    2. 9.2. Downstream Buyers
    3. 9.3. Distributors/Traders List
  10. Chapter 10 Marketing Strategy Analysis
    1. 10.1. Marketing Channel
    2. 10.2. Direct Marketing
    3. 10.3. Indirect Marketing
    4. 10.4. Marketing Channel Development Trends
    5. 10.5. Economic/Political Environmental Change
  11. Chapter 11 Report Conclusion & Key Insights
    1. 11.1. Key Insights from Primary Interviews & Surveys Respondents
    2. 11.2. Key Takeaways from Analysts, Consultants, and Industry Leaders
  12. Chapter 12 Research Approach & Methodology
    1. 12.1. Report Description
    2. 12.2. Research Scope
    3. 12.3. Research Methodology
      1. 12.3.1. Secondary Research
      2. 12.3.2. Primary Research
      3. 12.3.3. Statistical Models
        1. 12.3.3.1. Company Share Analysis Model
        2. 12.3.3.2. Revenue Based Modeling
      4. 12.3.4. Research Limitations

      List of Figures

      Fig.1	Product Picture of Augmented and Virtual Reality
      Fig.2	Global Augmented and Virtual Reality Market, 2016 – 2026 (USD Billion)
      Fig.3	Global Augmented and Virtual Reality Market Absolute Revenue Opportunity, 2016 – 2026 (USD Billion)
      Fig.4	Global Augmented and Virtual Reality Market Incremental Revenue Opportunity, 2020 – 2026 (USD Billion)
      Fig.5	Global Augmented and Virtual Reality Market Share, by Technology, 2019 & 2026 (USD Billion)
      Fig.6	Global Augmented Reality Augmented and Virtual Reality Market, 2016 – 2026 (USD Billion)
      Fig.7	Global Virtual Reality Augmented and Virtual Reality Market, 2016 – 2026 (USD Billion)
      Fig.8	Global Augmented and Virtual Reality Market Share, by Offering, 2019 & 2026 (USD Billion)
      Fig.9	Global Hardware  Augmented and Virtual Reality Market, 2016 – 2026 (USD Billion)
      Fig.10	Global Software Augmented and Virtual Reality Market, 2016 – 2026 (USD Billion)
      Fig.11	Global Augmented and Virtual Reality Market Share, by Application, 2019 & 2026 (USD Billion)
      Fig.12	Global Augmented Reality  Augmented and Virtual Reality Market, 2016 – 2026 (USD Billion)
      Fig.13	Global Virtual Reality Augmented and Virtual Reality Market, 2016 – 2026 (USD Billion)
      Fig.14	Global Augmented and Virtual Reality Market Share, by Region, 2019 & 2026 (USD Billion)
      Fig.15	North America Augmented and Virtual Reality Market, 2016 – 2026 (USD Billion)
      Fig.16	U.S. Augmented and Virtual Reality Market, 2016 – 2026 (USD Billion)
      Fig.17	Canada Augmented and Virtual Reality Market, 2016 – 2026 (USD Billion)
      Fig.18	Europe Augmented and Virtual Reality Market, 2016 – 2026 (USD Billion)
      Fig.19	Germany Augmented and Virtual Reality Market, 2016 – 2026 (USD Billion)
      Fig.20	France Augmented and Virtual Reality Market, 2016 – 2026 (USD Billion)
      Fig.21	U.K. Augmented and Virtual Reality Market, 2016 – 2026 (USD Billion)
      Fig.22	Italy Augmented and Virtual Reality Market, 2016 – 2026 (USD Billion)
      Fig.23	Spain Augmented and Virtual Reality Market, 2016 – 2026 (USD Billion)
      Fig.24	Rest of Europe Augmented and Virtual Reality Market, 2016 – 2026 (USD Billion)
      Fig.25	Asia Pacific Augmented and Virtual Reality Market, 2016 – 2026 (USD Billion)
      Fig.26	China Augmented and Virtual Reality Market, 2016 – 2026 (USD Billion)
      Fig.27	Japan Augmented and Virtual Reality Market, 2016 – 2026 (USD Billion)
      Fig.28	India Augmented and Virtual Reality Market, 2016 – 2026 (USD Billion)
      Fig.29	South  Korea Augmented and Virtual Reality Market, 2016 – 2026 (USD Billion)
      Fig.30	South-East Asia Augmented and Virtual Reality Market, 2016 – 2026 (USD Billion)
      Fig.31	Rest of Asia Pacific Augmented and Virtual Reality Market, 2016 – 2026 (USD Billion)
      Fig.32	Latin America Augmented and Virtual Reality Market, 2016 – 2026 (USD Billion)
      Fig.33	Brazil Augmented and Virtual Reality Market, 2016 – 2026 (USD Billion)
      Fig.34	Mexico Augmented and Virtual Reality Market, 2016 – 2026 (USD Billion)
      Fig.35	Rest of Latin America Augmented and Virtual Reality Market, 2016 – 2026 (USD Billion)
      Fig.36	The Middle-East and Africa Augmented and Virtual Reality Market, 2016 – 2026 (USD Billion)
      Fig.37	GCC Countries Augmented and Virtual Reality Market, 2016 – 2026 (USD Billion)
      Fig.38	South Africa Augmented and Virtual Reality Market, 2016 – 2026 (USD Billion)
      Fig.39	Rest of Middle-East Africa Augmented and Virtual Reality Market, 2016 – 2026 (USD Billion)
      Fig.40	Competitor Market Share – Revenue
      Fig.41	Google Revenue and Growth Rate
      Fig.42	Google Market Share
      Fig.43	PTC Revenue and Growth Rate
      Fig.44	PTC Market Share
      Fig.45	Apple Revenue and Growth Rate
      Fig.46	Apple Market Share
      Fig.47	Sony Revenue and Growth Rate
      Fig.48	Sony Market Share
      Fig.49	Samsung Electronics Revenue and Growth Rate
      Fig.50	Samsung Electronics Market Share
      Fig.51	Microsoft Revenue and Growth Rate
      Fig.52	Microsoft Market Share
      Fig.53	HTC Revenue and Growth Rate
      Fig.54	HTC Market Share
      Fig.55	Oculus Revenue and Growth Rate
      Fig.56	Oculus Market Share
      Fig.57	Seiko Epson Revenue and Growth Rate
      Fig.58	Seiko Epson Market Share
      Fig.59	Wikitude Revenue and Growth Rate
      Fig.60	Wikitude Market Share
      Fig.61	Magic Leap Revenue and Growth Rate
      Fig.62	Magic Leap Market Share
      Fig.63	Blippar Revenue and Growth Rate
      Fig.64	Blippar Market Share
      Fig.65	Upskill Revenue and Growth Rate
      Fig.66	Upskill Market Share
      Fig.67	MAXST Revenue and Growth Rate
      Fig.68	MAXST Market Share
      Fig.69	EON Reality Revenue and Growth Rate
      Fig.70	EON Reality Market Share
      Fig.71	Vuzix Revenue and Growth Rate
      Fig.72	Vuzix Market Share
      Fig.73	CyberGlove Systems Revenue and Growth Rate
      Fig.74	CyberGlove Systems Market Share
      Fig.75	Leap Motion Revenue and Growth Rate
      Fig.76	Leap Motion Market Share
      Fig.77	Sixense Enterprises Revenue and Growth Rate
      Fig.78	Sixense Enterprises Market Share
      Fig.79	DAQRI Revenue and Growth Rate
      Fig.80	DAQRI Market Share
      Fig.81	Zugara Revenue and Growth Rate
      Fig.82	Zugara Market Share
      Fig.83	Market Dynamics
      Fig.84	Global Augmented and Virtual Reality – Value Chain Analysis
      Fig.85	Key Mandates and Regulations
      Fig.86	Technology Roadmap and Timeline
      Fig.87	Market Attractiveness Analysis – By Technology
      Fig.88	Market Attractiveness Analysis – By Offering
      Fig.89	Market Attractiveness Analysis – By Application
      Fig.90	Market Attractiveness Analysis – By Region
      Fig.91	Augmented and Virtual Reality Industrial Chain Analysis
      Fig.92	Market Channels
      Fig.93	Marketing Channel Development Trend
      Fig.94	Growth in World Gross Product, 2008-2018
      

      List of Tables

      Table 1	Global Augmented and Virtual Reality Market, 2019 & 2026 (USD Billion)
      Table 2	Global Augmented and Virtual Reality Market, by Technology, 2016 – 2026 (USD Billion)
      Table 3	Global Augmented and Virtual Reality Market, by Offering, 2016 – 2026 (USD Billion)
      Table 4	Global Augmented and Virtual Reality Market, by Application, 2016 – 2026 (USD Billion)
      Table 5	Global Augmented and Virtual Reality Market, by Region, 2016 – 2026 (USD Billion)
      Table 6	North America Augmented and Virtual Reality Market, by Country, 2016 – 2026 (USD Billion)
      Table 7	North America Augmented and Virtual Reality Market, by Technology, 2016 – 2026 (USD Billion)
      Table 8	North America Augmented and Virtual Reality Market, by Offering, 2016 – 2026 (USD Billion)
      Table 9	North America Augmented and Virtual Reality Market, by Application, 2016 – 2026 (USD Billion)
      Table 10 Europe Augmented and Virtual Reality Market, by Country, 2016 – 2026 (USD Billion)
      Table 11 Europe Augmented and Virtual Reality Market, by Technology, 2016 – 2026 (USD Billion)
      Table 12 Europe Augmented and Virtual Reality Market, by Offering, 2016 – 2026 (USD Billion)
      Table 13 Europe Augmented and Virtual Reality Market, by Application, 2016 – 2026 (USD Billion)
      Table 14 Asia Pacific Augmented and Virtual Reality Market, by Country, 2016 – 2026 (USD Billion)
      Table 15 Asia Pacific Augmented and Virtual Reality Market, by Technology, 2016 – 2026 (USD Billion)
      Table 16 Asia Pacific Augmented and Virtual Reality Market, by Offering, 2016 – 2026 (USD Billion)
      Table 17 Asia Pacific Augmented and Virtual Reality Market, by Application, 2016 – 2026 (USD Billion)
      Table 18 Latin America Augmented and Virtual Reality Market, by Country, 2016 – 2026 (USD Billion)
      Table 19 Latin America Augmented and Virtual Reality Market, by Technology, 2016 – 2026 (USD Billion)
      Table 20 Latin America Augmented and Virtual Reality Market, by Offering, 2016 – 2026 (USD Billion)
      Table 21 Latin America Augmented and Virtual Reality Market, by Application, 2016 – 2026 (USD Billion)
      Table 22 The Middle-East and Africa Augmented and Virtual Reality Market, by Country, 2016 – 2026 (USD Billion)
      Table 23 The Middle-East and Africa Augmented and Virtual Reality Market, by Technology, 2016 – 2026 (USD Billion)
      Table 24 The Middle-East and Africa Augmented and Virtual Reality Market, by Offering, 2016 – 2026 (USD Billion)
      Table 25 The Middle-East and Africa Augmented and Virtual Reality Market, by Application, 2016 – 2026 (USD Billion)
      Table 26 Global Augmented and Virtual Reality Market - Company Revenue Analysis, 2016 – 2019 (USD Billion)
      Table 27 Global Augmented and Virtual Reality Market - Company Revenue Share Analysis, 2016 – 2019 (%)
      Table 28 Acquisitions and Mergers
      Table 29 Market Drivers – Impact Analysis
      Table 30 Market Restraints
      Table 31 Market Opportunities
      Table 32 Major Buyers of Augmented and Virtual Reality
      Table 33 Distributors/Traders of Augmented and Virtual Reality by Region
      

Industry Major Market Players

  • Google
  • PTC
  • Apple
  • Sony
  • Samsung Electronics
  • Microsoft
  • HTC
  • Oculus
  • Seiko Epson
  • Wikitude
  • Magic Leap
  • Blippar
  • Upskill
  • MAXST
  • EON Reality
  • Vuzix
  • CyberGlove Systems
  • Leap Motion
  • Sixense Enterprises
  • DAQRI
  • Zugara