Search Market Research Report

Discover Our Latest Reports
Discover Our Featured Reports
Discover Top Selling Reports

Anesthesia Equipment Market Size, Share Global Analysis Report, 2021 – 2026

report img

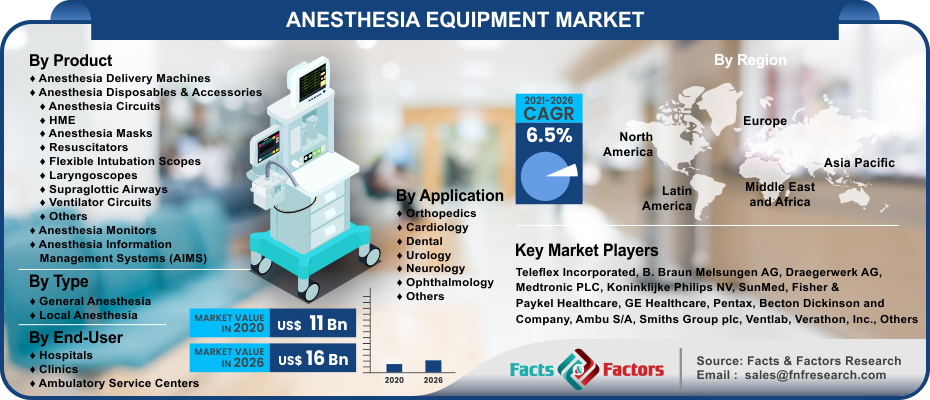
Anesthesia Equipment Market: By Product (Anesthesia Disposables & Accessories, Anesthesia Delivery Machines, Anesthesia Monitors, Anesthesia Workstations, Anesthesia Ventilators, and Anesthesia Information Management Systems (AIMS)), By Type (General and Local), By Application (Cardiology, Neurology, Dental, Orthopedics, Ophthalmology, Urology, and Others), and By End-User (Clinics, Hospitals, and Ambulatory Service Centers), And By Regions – Global & Regional Industry Perspective, Comprehensive Analysis, and Forecast 2021 – 2026

Industry Insights

According to Facts & Factors, the report on the “Global Anesthesia Equipment Market” encompasses the complete history and forecast details. In this report, the market value was witnessed to be around USD 11 Billion in 2020 and with a CAGR of 6.5% will acquire USD 16 Billion by 2026.

logoReport Overview

Anesthesia equipment is commonly referred to as Boyle’s machine. This medical care equipment is of great application among the anesthesiologists, their assistants, and nurses. Anesthesia is known to induce unconsciousness as well as low protective reflexes during surgical procedures in order to reduce sensation and central nervous system activities. It helps gain control over blood pressure, heart rate, blood flow, breathing, and pain. The anesthesia equipment helps deliver anesthetic agents in controlled doses during the surgical process.

logoIndustry Growth Factors

The growing aging population coupled with the prevalence of chronic disorders like high cholesterol, diabetes, and cancer is projected to help proliferate the demand for anesthesia equipment during the forecast period. Additionally, the rising healthcare expenditure, medical tourism, and high requirement for anesthesia delivery machines offer better market opportunities. The increasing surgical processes due to rising degenerative & chronic illnesses across the globe will enhance the demand for anesthesia equipment.

Rising investments in advancing this equipment have a positive impact on the growth of the global anesthesia equipment market, thereby helping rapid application in the healthcare industry. However, the government regulations, installation charges, and maintenance issues act as major restraining factors for the growth of the market. Other factors such as microbial contamination and time-consuming, complex, & low validation standards will further hamper the market expansion.

Anesthesia Equipment Market

To know more about this report | Request Free Sample Copy

logoSegmentation Analysis

The global anesthesia equipment market is segmented based on product, type, application, end-user, and regions.

On the basis of product, the anesthesia market is divided into anesthesia disposables & accessories, anesthesia delivery machines, anesthesia monitors, anesthesia workstations, anesthesia ventilators, and anesthesia information management systems (AIMS). From these, the anesthesia monitors segment holds the largest market owing to ease in tracking as well as displaying the anesthetic chemical administration in the form of gas, medicines, or fluids. The growing demand for anesthesia monitors coupled with rising investments will bring about industrial innovation and improvement in pain evaluation, thereby propelling the anesthesia market.

Based on type, the market is categorized into general and local. By application, the anesthesia equipment market is categorized into cardiology, neurology, dental, orthopedics, ophthalmology, urology, and others. Liable to the end-user segment, the market is fragmented into clinics, hospitals, and ambulatory service centers. From all these, the hospitals segment is anticipated to dominate the anesthesia market owing to the rising demand for laryngeal mask airways, portable anesthesia machines, etc. in the hospitals for surgical procedures.

Also, the provision of skilled professionals and qualified equipment in the hospitals will surge the sales over the forecast period. The availability of reimbursement policies and advanced healthcare facilities are likely to drive the demand for anesthesia equipment in the hospitals.

logoReport Scope

Report Attribute

Details

Market Size in 2020

USD 11 Billion

Projected Market Size in 2026

USD 16 Billion

CAGR Growth Rate

6.5% CAGR

Base Year

2020

Forecast Years

2021-2026

Key Market Players

Teleflex Incorporated, B. Braun Melsungen AG, Draegerwerk AG, Medtronic PLC, Koninklijke Philips NV, SunMed, Fisher & Paykel Healthcare, GE Healthcare, Pentax, Becton Dickinson and Company, Ambu S/A, Smiths Group plc, Ventlab, Verathon, Inc., Drägerwerk AG & Co. KGaA, 3M Company, Airsep Corporation, Koninklijke Philips N.V., Karl Storz GmbH & Co. KG, Aircraft Medical, and others.

Key Segment

By Product, By Type, By Application, By End-User, and By Region

Major Regions Covered

North America, Europe, Asia Pacific, Latin America, and the Middle East & Africa

Purchase Options

Request customized purchase options to meet your research needs. Explore purchase options

logoRegional Analysis

North America will dominate the global anesthesia market during the forecast period owing to the rising number of diseases like diabetes, obesity, cancer, and cardiovascular diseases in the region. Additionally, the rising invasive surgeries and adoption of these equipment will further promote the anesthesia equipment market. The high healthcare expenditure and advancements in anesthesia equipment are projected to trigger market growth.

logoCompetitive Players

Some of the market players dominating the global anesthesia equipment market is :

  • Teleflex Incorporated
  • B. Braun Melsungen AG
  • Draegerwerk AG
  • Medtronic PLC
  • Koninklijke Philips NV
  • SunMed
  • Fisher & Paykel Healthcare
  • GE Healthcare
  • Pentax
  • Becton Dickinson and Company
  • Ambu S/A
  • Smiths Group plc
  • Ventlab
  • Verathon Inc.
  • Drägerwerk AG & Co. KGaA
  • 3M Company
  • Airsep Corporation
  • Koninklijke Philips N.V.
  • Karl Storz GmbH & Co. KG
  • Aircraft Medical
  • among others

logoBy Product Segment Analysis

  • Anesthesia Delivery Machines
  • Anesthesia Disposables & Accessories
    • Anesthesia Circuits
    • HME
    • Anesthesia Masks
    • Resuscitators
    • Flexible Intubation Scopes
    • Laryngoscopes
    • Supraglottic Airways
    • Ventilator Circuits
    • Others
  • Anesthesia Monitors
  • Anesthesia Information Management Systems (AIMS)

logoBy Type Segment Analysis

  • General Anesthesia
  • Local Anesthesia

logoBy Application Segment Analysis

  • Orthopedics
  • Cardiology
  • Dental
  • Urology
  • Neurology
  • Ophthalmology
  • Others

logoBy End-User Segment Analysis

  • Hospitals
  • Clinics
  • Ambulatory Service Centers

logoBy Regional Segment Analysis

  • North America
    • U.S.
    • Canada
  • Europe
    • UK
    • France
    • Germany
    • Italy
    • Spain
    • Rest of Europe
  • Asia Pacific
    • China
    • Japan
    • India
    • South Korea
    • Southeast Asia
    • Rest of Asia Pacific
  • Latin America
    • Brazil
    • Mexico
    • Rest of Latin America
  • Middle East and Africa
    • GCC Countries
    • South Africa
    • Rest of MEA

Table of Content

  1. Chapter 1 Executive Summary
    1. 1.1. Introduction of Anesthesia Equipment
    2. 1.2. Global Anesthesia Equipment Market, 2019 & 2026 (USD Billion)
    3. 1.3. Global Anesthesia Equipment Market, 2016 – 2026 (USD Billion)
    4. 1.4. Global Anesthesia Equipment Market Absolute Revenue Opportunity, 2016 – 2026 (USD Billion)
    5. 1.5. Global Anesthesia Equipment Market Incremental Revenue Opportunity, 2020 – 2026 (USD Billion)
  2. Chapter 2 Anesthesia Equipment Market – Product Analysis
    1. 2.1. Global Anesthesia Equipment Market – Product Overview
    2. 2.2. Global Anesthesia Equipment Market Share, by Product, 2019 & 2026 (USD Billion)
    3. 2.3. Anesthesia Disposables & Accessories
      1. 2.3.1. Global Anesthesia Disposables & Accessories Anesthesia Equipment Market, 2016 – 2026 (USD Billion)
    4. 2.4. Anesthesia Delivery Machines
      1. 2.4.1. Global Anesthesia Delivery Machines Anesthesia Equipment Market, 2016 – 2026 (USD Billion)
    5. 2.5. Anesthesia Monitors
      1. 2.5.1. Global Anesthesia Monitors Anesthesia Equipment Market, 2016 – 2026 (USD Billion)
    6. 2.6. Anesthesia Workstations
      1. 2.6.1. Global Anesthesia Workstations Anesthesia Equipment Market, 2016 – 2026 (USD Billion)
    7. 2.7. Anesthesia Ventilators
      1. 2.7.1. Global Anesthesia Ventilators Anesthesia Equipment Market, 2016 – 2026 (USD Billion)
    8. 2.8. Anesthesia Information Management Systems (AIMS)
      1. 2.8.1. Global Anesthesia Information Management Systems (AIMS) Anesthesia Equipment Market, 2016 – 2026 (USD Billion)
  3. Chapter 3 Anesthesia Equipment Market – Type Analysis
    1. 3.1. Global Anesthesia Equipment Market – Type Overview
    2. 3.2. Global Anesthesia Equipment Market Share, by Type, 2019 & 2026 (USD Billion)
    3. 3.3. General
      1. 3.3.1. Global General Anesthesia Equipment Market, 2016 – 2026 (USD Billion)
    4. 3.4. Local
      1. 3.4.1. Global Local Anesthesia Equipment Market, 2016 – 2026 (USD Billion)
  4. Chapter 4 Anesthesia Equipment Market – Application Analysis
    1. 4.1. Global Anesthesia Equipment Market – Application Overview
    2. 4.2. Global Anesthesia Equipment Market Share, by Application, 2019 & 2026 (USD Billion)
    3. 4.3. Cardiology
      1. 4.3.1. Global Cardiology Anesthesia Equipment Market, 2016 – 2026 (USD Billion)
    4. 4.4. Neurology
      1. 4.4.1. Global Neurology Anesthesia Equipment Market, 2016 – 2026 (USD Billion)
    5. 4.5. Dental
      1. 4.5.1. Global Dental Anesthesia Equipment Market, 2016 – 2026 (USD Billion)
    6. 4.6. Orthopedics
      1. 4.6.1. Global Orthopedics Anesthesia Equipment Market, 2016 – 2026 (USD Billion)
    7. 4.7. Ophthalmology
      1. 4.7.1. Global Ophthalmology Anesthesia Equipment Market, 2016 – 2026 (USD Billion)
    8. 4.8. Urology
      1. 4.8.1. Global Urology Anesthesia Equipment Market, 2016 – 2026 (USD Billion)
    9. 4.9. Others
      1. 4.9.1. Global Others Anesthesia Equipment Market, 2016 – 2026 (USD Billion)
  5. Chapter 5 Anesthesia Equipment Market – End-User Analysis
    1. 5.1. Global Anesthesia Equipment Market – End-User Overview
    2. 5.2. Global Anesthesia Equipment Market Share, by End-User, 2019 & 2026 (USD Billion)
    3. 5.3. Clinics
      1. 5.3.1. Global Clinics Anesthesia Equipment Market, 2016 – 2026 (USD Billion)
    4. 5.4. Hospitals
      1. 5.4.1. Global Hospitals Anesthesia Equipment Market, 2016 – 2026 (USD Billion)
    5. 5.5. Ambulatory Service Centers
      1. 5.5.1. Global Ambulatory Service Centers Anesthesia Equipment Market, 2016 – 2026 (USD Billion)
  6. Chapter 6 Anesthesia Equipment Market – Regional Analysis
    1. 6.1. Global Anesthesia Equipment Market Regional Overview
    2. 6.2. Global Anesthesia Equipment Market Share, by Region, 2019 & 2026 (USD Billion)
    3. 6.3. North America
      1. 6.3.1. North America Anesthesia Equipment Market, 2016 – 2026 (USD Billion)
        1. 6.3.1.1. North America Anesthesia Equipment Market, by Country, 2016 - 2026 (USD Billion)
      2. 6.3.2. North America Anesthesia Equipment Market, by Product, 2016 – 2026
        1. 6.3.2.1. North America Anesthesia Equipment Market, by Product, 2016 – 2026 (USD Billion)
      3. 6.3.3. North America Anesthesia Equipment Market, by Type, 2016 – 2026
        1. 6.3.3.1. North America Anesthesia Equipment Market, by Type, 2016 – 2026 (USD Billion)
      4. 6.3.4. North America Anesthesia Equipment Market, by Application, 2016 – 2026
        1. 6.3.4.1. North America Anesthesia Equipment Market, by Application, 2016 – 2026 (USD Billion)
      5. 6.3.5. North America Anesthesia Equipment Market, by End-User, 2016 – 2026
        1. 6.3.5.1. North America Anesthesia Equipment Market, by End-User, 2016 – 2026 (USD Billion)
      6. 6.3.6. U.S.
        1. 6.3.6.1. U.S. Anesthesia Equipment Market, 2016 – 2026 (USD Billion)
      7. 6.3.7. Canada
        1. 6.3.7.1. Canada Anesthesia Equipment Market, 2016 – 2026 (USD Billion)
    4. 6.4. Europe
      1. 6.4.1. Europe Anesthesia Equipment Market, 2016 – 2026 (USD Billion)
        1. 6.4.1.1. Europe Anesthesia Equipment Market, by Country, 2016 - 2026 (USD Billion)
      2. 6.4.2. Europe Anesthesia Equipment Market, by Product, 2016 – 2026
        1. 6.4.2.1. Europe Anesthesia Equipment Market, by Product, 2016 – 2026 (USD Billion)
      3. 6.4.3. Europe Anesthesia Equipment Market, by Type, 2016 – 2026
        1. 6.4.3.1. Europe Anesthesia Equipment Market, by Type, 2016 – 2026 (USD Billion)
      4. 6.4.4. Europe Anesthesia Equipment Market, by Application, 2016 – 2026
        1. 6.4.4.1. Europe Anesthesia Equipment Market, by Application, 2016 – 2026 (USD Billion)
      5. 6.4.5. Europe Anesthesia Equipment Market, by End-User, 2016 – 2026
        1. 6.4.5.1. Europe Anesthesia Equipment Market, by End-User, 2016 – 2026 (USD Billion)
      6. 6.4.6. Germany
        1. 6.4.6.1. Germany Anesthesia Equipment Market, 2016 – 2026 (USD Billion)
      7. 6.4.7. France
        1. 6.4.7.1. France Anesthesia Equipment Market, 2016 – 2026 (USD Billion)
      8. 6.4.8. U.K.
        1. 6.4.8.1. U.K. Anesthesia Equipment Market, 2016 – 2026 (USD Billion)
      9. 6.4.9. Italy
        1. 6.4.9.1. Italy Anesthesia Equipment Market, 2016 – 2026 (USD Billion)
      10. 6.4.10. Spain
        1. 6.4.10.1. Spain Anesthesia Equipment Market, 2016 – 2026 (USD Billion)
      11. 6.4.11. Rest of Europe
        1. 6.4.11.1. Rest of Europe Anesthesia Equipment Market, 2016 – 2026 (USD Billion)
    5. 6.5. Asia Pacific
      1. 6.5.1. Asia Pacific Anesthesia Equipment Market, 2016 – 2026 (USD Billion)
        1. 6.5.1.1. Asia Pacific Anesthesia Equipment Market, by Country, 2016 - 2026 (USD Billion)
      2. 6.5.2. Asia Pacific Anesthesia Equipment Market, by Product, 2016 – 2026
        1. 6.5.2.1. Asia Pacific Anesthesia Equipment Market, by Product, 2016 – 2026 (USD Billion)
      3. 6.5.3. Asia Pacific Anesthesia Equipment Market, by Type, 2016 – 2026
        1. 6.5.3.1. Asia Pacific Anesthesia Equipment Market, by Type, 2016 – 2026 (USD Billion)
      4. 6.5.4. Asia Pacific Anesthesia Equipment Market, by Application, 2016 – 2026
        1. 6.5.4.1. Asia Pacific Anesthesia Equipment Market, by Application, 2016 – 2026 (USD Billion)
      5. 6.5.5. Asia Pacific Anesthesia Equipment Market, by End-User, 2016 – 2026
        1. 6.5.5.1. Asia Pacific Anesthesia Equipment Market, by End-User, 2016 – 2026 (USD Billion)
      6. 6.5.6. China
        1. 6.5.6.1. China Anesthesia Equipment Market, 2016 – 2026 (USD Billion)
      7. 6.5.7. Japan
        1. 6.5.7.1. Japan Anesthesia Equipment Market, 2016 – 2026 (USD Billion)
      8. 6.5.8. India
        1. 6.5.8.1. India Anesthesia Equipment Market, 2016 – 2026 (USD Billion)
      9. 6.5.9. South Korea
        1. 6.5.9.1. South Korea Anesthesia Equipment Market, 2016 – 2026 (USD Billion)
      10. 6.5.10. South-East Asia
        1. 6.5.10.1. South-East Asia Anesthesia Equipment Market, 2016 – 2026 (USD Billion)
      11. 6.5.11. Rest of Asia Pacific
        1. 6.5.11.1. Rest of Asia Pacific Anesthesia Equipment Market, 2016 – 2026 (USD Billion)
    6. 6.6. Latin America
      1. 6.6.1. Latin America Anesthesia Equipment Market, 2016 – 2026 (USD Billion)
        1. 6.6.1.1. Latin America Anesthesia Equipment Market, by Country, 2016 - 2026 (USD Billion)
      2. 6.6.2. Latin America Anesthesia Equipment Market, by Product, 2016 – 2026
        1. 6.6.2.1. Latin America Anesthesia Equipment Market, by Product, 2016 – 2026 (USD Billion)
      3. 6.6.3. Latin America Anesthesia Equipment Market, by Type, 2016 – 2026
        1. 6.6.3.1. Latin America Anesthesia Equipment Market, by Type, 2016 – 2026 (USD Billion)
      4. 6.6.4. Latin America Anesthesia Equipment Market, by Application, 2016 – 2026
        1. 6.6.4.1. Latin America Anesthesia Equipment Market, by Application, 2016 – 2026 (USD Billion)
      5. 6.6.5. Latin America Anesthesia Equipment Market, by End-User, 2016 – 2026
        1. 6.6.5.1. Latin America Anesthesia Equipment Market, by End-User, 2016 – 2026 (USD Billion)
      6. 6.6.6. Brazil
        1. 6.6.6.1. Brazil Anesthesia Equipment Market, 2016 – 2026 (USD Billion)
      7. 6.6.7. Mexico
        1. 6.6.7.1. Mexico Anesthesia Equipment Market, 2016 – 2026 (USD Billion)
      8. 6.6.8. Rest of Latin America
        1. 6.6.8.1. Rest of Latin America Anesthesia Equipment Market, 2016 – 2026 (USD Billion)
    7. 6.7. The Middle-East and Africa
      1. 6.7.1. The Middle-East and Africa Anesthesia Equipment Market, 2016 – 2026 (USD Billion)
        1. 6.7.1.1. The Middle-East and Africa Anesthesia Equipment Market, by Country, 2016 - 2026 (USD Billion)
      2. 6.7.2. The Middle-East and Africa Anesthesia Equipment Market, by Product, 2016 – 2026
        1. 6.7.2.1. The Middle-East and Africa Anesthesia Equipment Market, by Product, 2016 – 2026 (USD Billion)
      3. 6.7.3. The Middle-East and Africa Anesthesia Equipment Market, by Type, 2016 – 2026
        1. 6.7.3.1. The Middle-East and Africa Anesthesia Equipment Market, by Type, 2016 – 2026 (USD Billion)
      4. 6.7.4. The Middle-East and Africa Anesthesia Equipment Market, by Application, 2016 – 2026
        1. 6.7.4.1. The Middle-East and Africa Anesthesia Equipment Market, by Application, 2016 – 2026 (USD Billion)
      5. 6.7.5. The Middle-East and Africa Anesthesia Equipment Market, by End-User, 2016 – 2026
        1. 6.7.5.1. The Middle-East and Africa Anesthesia Equipment Market, by End-User, 2016 – 2026 (USD Billion)
      6. 6.7.6. GCC Countries
        1. 6.7.6.1. GCC Countries Anesthesia Equipment Market, 2016 – 2026 (USD Billion)
      7. 6.7.7. South Africa
        1. 6.7.7.1. South Africa Anesthesia Equipment Market, 2016 – 2026 (USD Billion)
      8. 6.7.8. Rest of Middle-East Africa
        1. 6.7.8.1. Rest of Middle-East Africa Anesthesia Equipment Market, 2016 – 2026 (USD Billion)
  7. Chapter 7 Anesthesia Equipment Market – Competitive Landscape
    1. 7.1. Competitor Market Share – Revenue
    2. 7.2. Market Concentration Rate Analysis, Top 3 and Top 5 Players
    3. 7.3. Strategic Developments
      1. 7.3.1. Acquisitions and Mergers
      2. 7.3.2. New Products
      3. 7.3.3. Research & Development Activities
  8. Chapter 8 Company Profiles
    1. 8.1. Teleflex Incorporated
      1. 8.1.1. Company Overview
      2. 8.1.2. Product/Service Portfolio
      3. 8.1.3. Teleflex Incorporated Sales, Revenue, and Gross Margin
      4. 8.1.4. Teleflex Incorporated Revenue and Growth Rate
      5. 8.1.5. Teleflex Incorporated Market Share
      6. 8.1.6. Recent Initiatives, Funding/VC Activities, and Technological Innovations
      7. 8.2. B. Braun Melsungen AG
      8. 8.2.1. Company Overview
      9. 8.2.2. Product/Service Portfolio
        1. 8.2.3. B. Braun Melsungen AG Sales, Revenue, and Gross Margin
        2. 8.2.4. B. Braun Melsungen AG Revenue and Growth Rate
        3. 8.2.5. B. Braun Melsungen AG Market Share
      10. 8.2.6. Recent Initiatives, Funding/VC Activities, and Technological Innovations
    2. 8.3. Draegerwerk AG
      1. 8.3.1. Company Overview
      2. 8.3.2. Product/Service Portfolio
      3. 8.3.3. Draegerwerk AG Sales, Revenue, and Gross Margin
      4. 8.3.4. Draegerwerk AG Revenue and Growth Rate
      5. 8.3.5. Draegerwerk AG Market Share
      6. 8.3.6. Recent Initiatives, Funding/VC Activities, and Technological Innovations
    3. 8.4. Medtronic PLC
      1. 8.4.1. Company Overview
      2. 8.4.2. Product/Service Portfolio
      3. 8.4.3. Medtronic PLC Sales, Revenue, and Gross Margin
      4. 8.4.4. Medtronic PLC Revenue and Growth Rate
      5. 8.4.5. Medtronic PLC Market Share
      6. 8.4.6. Recent Initiatives, Funding/VC Activities, and Technological Innovations
    4. 8.5. Koninklijke Philips NV
      1. 8.5.1. Company Overview
      2. 8.5.2. Product/Service Portfolio
      3. 8.5.3. Koninklijke Philips NV Sales, Revenue, and Gross Margin
      4. 8.5.4. Koninklijke Philips NV Revenue and Growth Rate
      5. 8.5.5. Koninklijke Philips NV Market Share
      6. 8.5.6. Recent Initiatives, Funding/VC Activities, and Technological Innovations
    5. 8.6. SunMed
      1. 8.6.1. Company Overview
      2. 8.6.2. Product/Service Portfolio
      3. 8.6.3. SunMed Sales, Revenue, and Gross Margin
      4. 8.6.4. SunMed Revenue and Growth Rate
      5. 8.6.5. SunMed Market Share
      6. 8.6.6. Recent Initiatives, Funding/VC Activities, and Technological Innovations
    6. 8.7. Fisher & Paykel Healthcare
      1. 8.7.1. Company Overview
      2. 8.7.2. Product/Service Portfolio
      3. 8.7.3. Fisher & Paykel Healthcare Sales, Revenue, and Gross Margin
      4. 8.7.4. Fisher & Paykel Healthcare Revenue and Growth Rate
      5. 8.7.5. Fisher & Paykel Healthcare Market Share
      6. 8.7.6. Recent Initiatives, Funding/VC Activities, and Technological Innovations
    7. 8.8. GE Healthcare
      1. 8.8.1. Company Overview
      2. 8.8.2. Product/Service Portfolio
      3. 8.8.3. GE Healthcare Sales, Revenue, and Gross Margin
      4. 8.8.4. GE Healthcare Revenue and Growth Rate
      5. 8.8.5. GE Healthcare Market Share
      6. 8.8.6. Recent Initiatives, Funding/VC Activities, and Technological Innovations
    8. 8.9. Pentax
      1. 8.9.1. Company Overview
      2. 8.9.2. Product/Service Portfolio
      3. 8.9.3. Pentax Sales, Revenue, and Gross Margin
      4. 8.9.4. Pentax Revenue and Growth Rate
      5. 8.9.5. Pentax Market Share
      6. 8.9.6. Recent Initiatives, Funding/VC Activities, and Technological Innovations
    9. 8.10. Becton Dickinson and Company
      1. 8.10.1. Company Overview
      2. 8.10.2. Product/Service Portfolio
      3. 8.10.3. Becton Dickinson and Company Sales, Revenue, and Gross Margin
      4. 8.10.4. Becton Dickinson and Company Revenue and Growth Rate
      5. 8.10.5. Becton Dickinson and Company Market Share
      6. 8.10.6. Recent Initiatives, Funding/VC Activities, and Technological Innovations
    10. 8.11. Ambu S/A
      1. 8.11.1. Company Overview
      2. 8.11.2. Product/Service Portfolio
      3. 8.11.3. Ambu S/A Sales, Revenue, and Gross Margin
      4. 8.11.4. Ambu S/A Revenue and Growth Rate
      5. 8.11.5. Ambu S/A Market Share
      6. 8.11.6. Recent Initiatives, Funding/VC Activities, and Technological Innovations
    11. 8.12. Smiths Group plc
      1. 8.12.1. Company Overview
      2. 8.12.2. Product/Service Portfolio
      3. 8.12.3. Smiths Group plc Sales, Revenue, and Gross Margin
      4. 8.12.4. Smiths Group plc Revenue and Growth Rate
      5. 8.12.5. Smiths Group plc Market Share
      6. 8.12.6. Recent Initiatives, Funding/VC Activities, and Technological Innovations
    12. 8.13. Ventlab
      1. 8.13.1. Company Overview
      2. 8.13.2. Product/Service Portfolio
      3. 8.13.3. Ventlab Sales, Revenue, and Gross Margin
      4. 8.13.4. Ventlab Revenue and Growth Rate
      5. 8.13.5. Ventlab Market Share
      6. 8.13.6. Recent Initiatives, Funding/VC Activities, and Technological Innovations
    13. 8.14. Verathon Inc.
      1. 8.14.1. Company Overview
      2. 8.14.2. Product/Service Portfolio
      3. 8.14.3. Verathon Inc. Sales, Revenue, and Gross Margin
      4. 8.14.4. Verathon Inc. Revenue and Growth Rate
      5. 8.14.5. Verathon Inc. Market Share
      6. 8.14.6. Recent Initiatives, Funding/VC Activities, and Technological Innovations
    14. 8.15. Drägerwerk AG & Co. KGaA
      1. 8.15.1. Company Overview
      2. 8.15.2. Product/Service Portfolio
      3. 8.15.3. Drägerwerk AG & Co. KGaA Sales, Revenue, and Gross Margin
      4. 8.15.4. Drägerwerk AG & Co. KGaA Revenue and Growth Rate
      5. 8.15.5. Drägerwerk AG & Co. KGaA Market Share
      6. 8.15.6. Recent Initiatives, Funding/VC Activities, and Technological Innovations
    15. 8.16. 3M Company
      1. 8.16.1. Company Overview
      2. 8.16.2. Product/Service Portfolio
      3. 8.16.3. 3M Company Sales, Revenue, and Gross Margin
      4. 8.16.4. 3M Company Revenue and Growth Rate
      5. 8.16.5. 3M Company Market Share
      6. 8.16.6. Recent Initiatives, Funding/VC Activities, and Technological Innovations
    16. 8.17. Airsep Corporation Koninklijke Philips N.V.
      1. 8.17.1. Company Overview
      2. 8.17.2. Product/Service Portfolio
      3. 8.17.3. Airsep Corporation Koninklijke Philips N.V. Sales, Revenue, and Gross Margin
      4. 8.17.4. Airsep Corporation Koninklijke Philips N.V. Revenue and Growth Rate
      5. 8.17.5. Airsep Corporation Koninklijke Philips N.V. Market Share
      6. 8.17.6. Recent Initiatives, Funding/VC Activities, and Technological Innovations
    17. 8.18. Karl Storz GmbH & Co. KG
      1. 8.18.1. Company Overview
      2. 8.18.2. Product/Service Portfolio
      3. 8.18.3. Karl Storz GmbH & Co. KG Sales, Revenue, and Gross Margin
      4. 8.18.4. Karl Storz GmbH & Co. KG Revenue and Growth Rate
      5. 8.18.5. Karl Storz GmbH & Co. KG Market Share
      6. 8.18.6. Recent Initiatives, Funding/VC Activities, and Technological Innovations
    18. 8.19. Aircraft Medical
      1. 8.19.1. Company Overview
      2. 8.19.2. Product/Service Portfolio
      3. 8.19.3. Aircraft Medical Sales, Revenue, and Gross Margin
      4. 8.19.4. Aircraft Medical Revenue and Growth Rate
      5. 8.19.5. Aircraft Medical Market Share
      6. 8.19.6. Recent Initiatives, Funding/VC Activities, and Technological Innovations
  9. Chapter 9 Anesthesia Equipment — Industry Analysis
    1. 9.1. Introduction and Taxonomy
    2. 9.2. Anesthesia Equipment Market – Key Trends
      1. 9.2.1. Market Drivers
      2. 9.2.2. Market Restraints
      3. 9.2.3. Market Opportunities
    3. 9.3. Value Chain Analysis
    4. 9.4. Key Mandates and Regulations
    5. 9.5. Technology Roadmap and Timeline
    6. 9.6. Anesthesia Equipment Market – Attractiveness Analysis
      1. 9.6.1. By Product
      2. 9.6.2. By Type
      3. 9.6.3. By Application
      4. 9.6.4. By End-User
      5. 9.6.5. By Region
  10. Chapter 10 Industrial Chain, Sourcing Strategy, and Downstream Buyers
    1. 10.1. Anesthesia Equipment Industrial Chain Analysis
    2. 10.2. Downstream Buyers
    3. 10.3. Distributors/Traders List
  11. Chapter 11 Marketing Strategy Analysis
    1. 11.1. Marketing Channel
    2. 11.2. Direct Marketing
    3. 11.3. Indirect Marketing
    4. 11.4. Marketing Channel Development Trends
    5. 11.5. Economic/Political Environmental Change
  12. Chapter 12 Report Conclusion & Key Insights
    1. 12.1. Key Insights from Primary Interviews & Surveys Respondents
    2. 12.2. Key Takeaways from Analysts, Consultants, and Industry Leaders
  13. Chapter 13 Research Approach & Methodology
    1. 13.1. Report Description
    2. 13.2. Research Scope
    3. 13.3. Research Methodology
      1. 13.3.1. Secondary Research
      2. 13.3.2. Primary Research
      3. 13.3.3. Statistical Models
        1. 13.3.3.1. Company Share Analysis Model
        2. 13.3.3.2. Revenue Based Modeling
      4. 13.3.4. Research Limitations

      List of Figures

      Fig.1	Product Picture of Anesthesia Equipment
      Fig.2	Global Anesthesia Equipment Market, 2016 – 2026 (USD Billion)
      Fig.3	Global Anesthesia Equipment Market Absolute Revenue Opportunity, 2016 – 2026 (USD Billion)
      Fig.4	Global Anesthesia Equipment Market Incremental Revenue Opportunity, 2020 – 2026 (USD Billion)
      Fig.5	Global Anesthesia Equipment Market Share, by Product, 2019 & 2026 (USD Billion)
      Fig.6	Global Anesthesia Disposables & Accessories Anesthesia Equipment Market, 2016 – 2026 (USD Billion)
      Fig.7	Global Anesthesia Delivery Machines Anesthesia Equipment Market, 2016 – 2026 (USD Billion)
      Fig.8	Global Anesthesia Monitors Anesthesia Equipment Market, 2016 – 2026 (USD Billion)
      Fig.9	Global Anesthesia Workstations Anesthesia Equipment Market, 2016 – 2026 (USD Billion)
      Fig.10	Global Anesthesia Ventilators Anesthesia Equipment Market, 2016 – 2026 (USD Billion)
      Fig.11	Global Anesthesia Information Management Systems (AIMS) Anesthesia Equipment Market, 2016 – 2026 (USD Billion)
      Fig.12	Global Anesthesia Equipment Market Share, by Type, 2019 & 2026 (USD Billion)
      Fig.13	Global General Anesthesia Equipment Market, 2016 – 2026 (USD Billion)
      Fig.14	Global Local Anesthesia Equipment Market, 2016 – 2026 (USD Billion)
      Fig.15	Global Anesthesia Equipment Market Share, by Application, 2019 & 2026 (USD Billion)
      Fig.16	Global Cardiology Anesthesia Equipment Market, 2016 – 2026 (USD Billion)
      Fig.17	Global Neurology Anesthesia Equipment Market, 2016 – 2026 (USD Billion)
      Fig.18	Global Dental Anesthesia Equipment Market, 2016 – 2026 (USD Billion)
      Fig.19	Global Orthopedics Anesthesia Equipment Market, 2016 – 2026 (USD Billion)
      Fig.20	Global Ophthalmology Anesthesia Equipment Market, 2016 – 2026 (USD Billion)
      Fig.21	Global Urology Anesthesia Equipment Market, 2016 – 2026 (USD Billion)
      Fig.22	Global Others Anesthesia Equipment Market, 2016 – 2026 (USD Billion)
      Fig.23	Global Anesthesia Equipment Market Share, by End-User, 2019 & 2026 (USD Billion)
      Fig.24	Global Clinics Anesthesia Equipment Market, 2016 – 2026 (USD Billion)
      Fig.25	Global Hospitals Anesthesia Equipment Market, 2016 – 2026 (USD Billion)
      Fig.26	Global Ambulatory Service Centers Anesthesia Equipment Market, 2016 – 2026 (USD Billion)
      Fig.27	Global Anesthesia Equipment Market Share, by Region, 2019 & 2026 (USD Billion)
      Fig.28	North America Anesthesia Equipment Market, 2016 – 2026 (USD Billion)
      Fig.29	U.S. Anesthesia Equipment Market, 2016 – 2026 (USD Billion)
      Fig.30	Canada Anesthesia Equipment Market, 2016 – 2026 (USD Billion)
      Fig.31	Europe Anesthesia Equipment Market, 2016 – 2026 (USD Billion)
      Fig.32	Germany Anesthesia Equipment Market, 2016 – 2026 (USD Billion)
      Fig.33	France Anesthesia Equipment Market, 2016 – 2026 (USD Billion)
      Fig.34	U.K. Anesthesia Equipment Market, 2016 – 2026 (USD Billion)
      Fig.35	Italy Anesthesia Equipment Market, 2016 – 2026 (USD Billion)
      Fig.36	Spain Anesthesia Equipment Market, 2016 – 2026 (USD Billion)
      Fig.37	Rest of Europe Anesthesia Equipment Market, 2016 – 2026 (USD Billion)
      Fig.38	Asia Pacific Anesthesia Equipment Market, 2016 – 2026 (USD Billion)
      Fig.39	China Anesthesia Equipment Market, 2016 – 2026 (USD Billion)
      Fig.40	Japan Anesthesia Equipment Market, 2016 – 2026 (USD Billion)
      Fig.41	India Anesthesia Equipment Market, 2016 – 2026 (USD Billion)
      Fig.42	South  Korea Anesthesia Equipment Market, 2016 – 2026 (USD Billion)
      Fig.43	South-East Asia Anesthesia Equipment Market, 2016 – 2026 (USD Billion)
      Fig.44	Rest of Asia Pacific Anesthesia Equipment Market, 2016 – 2026 (USD Billion)
      Fig.45	Latin America Anesthesia Equipment Market, 2016 – 2026 (USD Billion)
      Fig.46	Brazil Anesthesia Equipment Market, 2016 – 2026 (USD Billion)
      Fig.47	Mexico Anesthesia Equipment Market, 2016 – 2026 (USD Billion)
      Fig.48	Rest of Latin America Anesthesia Equipment Market, 2016 – 2026 (USD Billion)
      Fig.49	The Middle-East and Africa Anesthesia Equipment Market, 2016 – 2026 (USD Billion)
      Fig.50	GCC Countries Anesthesia Equipment Market, 2016 – 2026 (USD Billion)
      Fig.51	South Africa Anesthesia Equipment Market, 2016 – 2026 (USD Billion)
      Fig.52	Rest of Middle-East Africa Anesthesia Equipment Market, 2016 – 2026 (USD Billion)
      Fig.53	Competitor Market Share – Revenue
      Fig.54	Teleflex Incorporated Revenue and Growth Rate
      Fig.55	Teleflex Incorporated Market Share
      Fig.56	B. Braun Melsungen AG Revenue and Growth Rate
      Fig.57	B. Braun Melsungen AG Market Share
      Fig.58	Draegerwerk AG Revenue and Growth Rate
      Fig.59	Draegerwerk AG Market Share
      Fig.60	Medtronic PLC Revenue and Growth Rate
      Fig.61	Medtronic PLC Market Share
      Fig.62	Koninklijke Philips NV Revenue and Growth Rate
      Fig.63	Koninklijke Philips NV Market Share
      Fig.64	SunMed Revenue and Growth Rate
      Fig.65	SunMed Market Share
      Fig.66	Fisher & Paykel Healthcare Revenue and Growth Rate
      Fig.67	Fisher & Paykel Healthcare Market Share
      Fig.68	GE Healthcare Revenue and Growth Rate
      Fig.69	GE Healthcare Market Share
      Fig.70	Pentax Revenue and Growth Rate
      Fig.71	Pentax Market Share
      Fig.72	Becton Dickinson and Company Revenue and Growth Rate
      Fig.73	Becton Dickinson and Company Market Share
      Fig.74	Ambu S/A Revenue and Growth Rate
      Fig.75	Ambu S/A Market Share
      Fig.76	Smiths Group plc Revenue and Growth Rate
      Fig.77	Smiths Group plc Market Share
      Fig.78	Ventlab Revenue and Growth Rate
      Fig.79	Ventlab Market Share
      Fig.80	Verathon Inc. Revenue and Growth Rate
      Fig.81	Verathon Inc. Market Share
      Fig.82	Drägerwerk AG & Co. KGaA Revenue and Growth Rate
      Fig.83	Drägerwerk AG & Co. KGaA Market Share
      Fig.84	3M Company Revenue and Growth Rate
      Fig.85	3M Company Market Share
      Fig.86	Airsep Corporation Koninklijke Philips N.V. Revenue and Growth Rate
      Fig.87	Airsep Corporation Koninklijke Philips N.V. Market Share
      Fig.88	Karl Storz GmbH & Co. KG Revenue and Growth Rate
      Fig.89	Karl Storz GmbH & Co. KG Market Share
      Fig.90	Aircraft Medical Revenue and Growth Rate
      Fig.91	Aircraft Medical Market Share
      Fig.92	Market Dynamics
      Fig.93	Global Anesthesia Equipment – Value Chain Analysis
      Fig.94	Key Mandates and Regulations
      Fig.95	Technology Roadmap and Timeline
      Fig.96	Market Attractiveness Analysis – By Product
      Fig.97	Market Attractiveness Analysis – By Type
      Fig.98	Market Attractiveness Analysis – By Application
      Fig.99	Market Attractiveness Analysis – By End-User
      Fig.100	Market Attractiveness Analysis – By Region
      Fig.101	Anesthesia Equipment Industrial Chain Analysis
      Fig.102	Market Channels
      Fig.103	Marketing Channel Development Trend
      Fig.104	Growth in World Gross Product, 2008-2018
      

      List of Tables

      Table 1	Global Anesthesia Equipment Market, 2019 & 2026 (USD Billion)
      Table 2	Global Anesthesia Equipment Market, by Product, 2016 – 2026 (USD Billion)
      Table 3	Global Anesthesia Equipment Market, by Type, 2016 – 2026 (USD Billion)
      Table 4	Global Anesthesia Equipment Market, by Application, 2016 – 2026 (USD Billion)
      Table 5	Global Anesthesia Equipment Market, by End-User, 2016 – 2026 (USD Billion)
      Table 6	Global Anesthesia Equipment Market, by Region, 2016 – 2026 (USD Billion)
      Table 7	North America Anesthesia Equipment Market, by Country, 2016 – 2026 (USD Billion)
      Table 8	North America Anesthesia Equipment Market, by Product, 2016 – 2026 (USD Billion)
      Table 9	North America Anesthesia Equipment Market, by Type, 2016 – 2026 (USD Billion)
      Table 10 North America Anesthesia Equipment Market, by Application, 2016 – 2026 (USD Billion)
      Table 11 North America Anesthesia Equipment Market, by End-User, 2016 – 2026 (USD Billion)
      Table 12 Europe Anesthesia Equipment Market, by Country, 2016 – 2026 (USD Billion)
      Table 13 Europe Anesthesia Equipment Market, by Product, 2016 – 2026 (USD Billion)
      Table 14 Europe Anesthesia Equipment Market, by Type, 2016 – 2026 (USD Billion)
      Table 15 Europe Anesthesia Equipment Market, by Application, 2016 – 2026 (USD Billion)
      Table 16 Europe Anesthesia Equipment Market, by End-User, 2016 – 2026 (USD Billion)
      Table 17 Asia Pacific Anesthesia Equipment Market, by Country, 2016 – 2026 (USD Billion)
      Table 18 Asia Pacific Anesthesia Equipment Market, by Product, 2016 – 2026 (USD Billion)
      Table 19 Asia Pacific Anesthesia Equipment Market, by Type, 2016 – 2026 (USD Billion)
      Table 20 Asia Pacific Anesthesia Equipment Market, by Application, 2016 – 2026 (USD Billion)
      Table 21 Asia Pacific Anesthesia Equipment Market, by End-User, 2016 – 2026 (USD Billion)
      Table 22 Latin America Anesthesia Equipment Market, by Country, 2016 – 2026 (USD Billion)
      Table 23 Latin America Anesthesia Equipment Market, by Product, 2016 – 2026 (USD Billion)
      Table 24 Latin America Anesthesia Equipment Market, by Type, 2016 – 2026 (USD Billion)
      Table 25 Latin America Anesthesia Equipment Market, by Application, 2016 – 2026 (USD Billion)
      Table 26 Latin America Anesthesia Equipment Market, by End-User, 2016 – 2026 (USD Billion)
      Table 27 The Middle-East and Africa Anesthesia Equipment Market, by Country, 2016 – 2026 (USD Billion)
      Table 28 The Middle-East and Africa Anesthesia Equipment Market, by Product, 2016 – 2026 (USD Billion)
      Table 29 The Middle-East and Africa Anesthesia Equipment Market, by Type, 2016 – 2026 (USD Billion)
      Table 30 The Middle-East and Africa Anesthesia Equipment Market, by Application, 2016 – 2026 (USD Billion)
      Table 31 The Middle-East and Africa Anesthesia Equipment Market, by End-User, 2016 – 2026 (USD Billion)
      Table 32 Global Anesthesia Equipment Market - Company Revenue Analysis, 2016 – 2019 (USD Billion)
      Table 33 Global Anesthesia Equipment Market - Company Revenue Share Analysis, 2016 – 2019 (%)
      Table 34 Acquisitions and Mergers
      Table 35 Market Drivers – Impact Analysis
      Table 36 Market Restraints
      Table 37 Market Opportunities
      Table 38 Major Buyers of Anesthesia Equipment
      Table 39 Distributors/Traders of Anesthesia Equipment by Region
      

Industry Major Market Players

  • Teleflex Incorporated
  • B. Braun Melsungen AG
  • Draegerwerk AG
  • Medtronic PLC
  • Koninklijke Philips NV
  • SunMed
  • Fisher & Paykel Healthcare
  • GE Healthcare
  • Pentax
  • Becton Dickinson and Company
  • Ambu S/A
  • Smiths Group plc
  • Ventlab
  • Verathon Inc.
  • Drägerwerk AG & Co. KGaA
  • 3M Company
  • Airsep Corporation Koninklijke Philips N.V.
  • Karl Storz GmbH & Co. KG
  • Aircraft Medical