Search Market Research Report

Discover Our Latest Reports
Discover Our Featured Reports
Discover Top Selling Reports

Ammunition Market Size, Share Global Analysis Report, 2021 - 2026

report img

Ammunition Market By Caliber (Small Caliber, Medium Caliber, Large Caliber, & Rockets, Missiles, And Others), By Product (Rimfire & Centerfire), By Application (Civil & Commercial & Defense), And By Regions - Global & Regional Industry Perspective, Comprehensive Analysis, and Forecast 2021 - 2026

Industry Insights

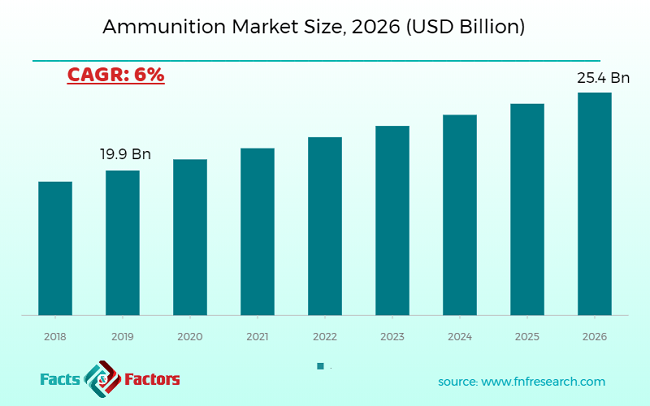
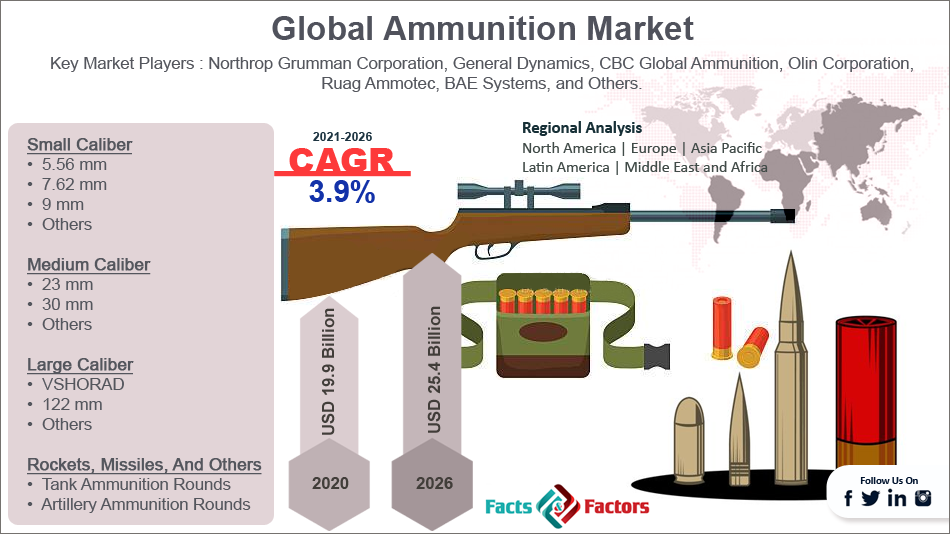
[110+ Pages Report] The latest finding surrounding the Global Ammunition Market published by Facts & Factors offers a neatly packaged and comprehensive read. In the study, the global ammunition market is estimated to reach a projected value of USD 25.4 Billion by 2026 growing at a CAGR of 3.9% from an initial value of USD 19.9 Billion in the year 2020.

Ammunition Market Size

To know more about this report | Request Free Sample Copy

logoMarket Overview

Ammunition is the material that is often fired, scattered, dropped, or denoted from any form of weapons in the form of bombs or rockets and is dispersed in the amount of shrapnel, bullets, or shells. Ammunition is often used as an expandable form of weapon and a component of a bigger weapon system that has a tantalizing effect on a target. Oftentimes, there is a variety of ammunition types that has the ability to create various effects on targets such as armor-piercing shells and tracer ammunition.


logoKey Insights from Primary Research

  • As per our primary respondents, the global ammunition market is set to grow annually at a rate of around 3%
  • It was established through primary research that the ammunition market was valued at around USD 25,650 Million in 2019
  • North America is presently holding the largest revenue share among all the regions and is further expected to maintain its position throughout the forecast period
  • The “military” category, on the basis of application segmentation, was the leading revenue-generating category accounting for more than 80% share, in 2019
  • On the basis of type segmentation, the “small caliber ammunition” segment held the leading share at more than 30%, in 2019

global-ammunition-market-size

To know more about this report | Request Free Sample Copy

logoKey Recommendations from Analysts

  • Consistent rise in spending on the modernization of armed forces is acting as the major driving factor for the ammunitions market
  • The strategic and competitive advantage provided by the availability of advanced ammunition in large quantities to a country is anticipated to be the key factor driving the growth of this market globally
  • Our team of analysts has identified, the civilian application segment as the fastest-growing category offering potential opportunities for the players operating in this marketplace
  • In recent years, the Asia Pacific region is growing with the highest growth rate implying the presence of the most populous as well as militarily strong nations such as China and India.

logoIndustry Growth Factors

The global ammunition market is likely to attain a high market share during the advent of the forecast period owing to the shifting nature of warfare, increased militarization of police forces, and rising incidence of drug trafficking countermeasures to name a few. Additionally, increasing instances of modernization of armed forces coupled with increasing R&D activities will fuel the growth of the global ammunition market during the advent of the forecast period. Factors pertaining to the rising number of mergers & acquisitions and the increasing number of product launches will increase the footprint of the global ammunition market during the advent of the forecast period.

The global ammunition market is driven by increasing procurement of defense equipment owing to increasing hostilities and terrorist activities coupled with the rising popularity of sports activities utilizing rifles and pistols to name a few. Factors pertaining to technological advancements in terms of polymer-based cases coupled with the rising adoption of online sales media channels will push the existing boundaries of the global ammunition market during the advent of the forecast period. However, increasing legal, economic, and political regulations affecting the production of procurement of ammunition will decrease the market share during the advent of the forecast period.

logoSegmentation Analysis

The global ammunition market is segmented into caliber, product, application, and region.

On the basis of caliber, the global ammunition market is divided into small caliber, medium caliber, large caliber, and rockets, missiles, and others. The segment pertaining to smaller caliber ammunition is expected to witness the largest market owing to a wider berth of applications in terms of shotgun pistols, assault rifles, rifles, and revolvers coupled with the rising demand for small-caliber ammunition from security forces toward increasing incidences of armed conflicts on a global scale. Based on product, the global ammunition market is classified into rimfire and centerfire.

The segment pertaining to centerfire ammunition is expected to witness the largest market share during the advent of the forecast period owing to the latter product being placed in a viable position of the gun barrel coupled with the added benefit of centerfire rounds being reloadable at a rapid pace to name a few. On the basis of application, the global ammunition market is fragmented into civil & commercial, and defense. The defense segment is expected to witness the largest market share during the advent of the forecast period owing to rising cross-border conflicts around a global purview coupled with increasing geopolitical conflicts in the form of terrorist activities to name a few.

logo Report Scope

Report Attribute

Details

Market Size in 2020

USD 19.9 Billion

Projected Market Size in 2026

USD 25.4 Billion

CAGR Growth Rate

3.9% CAGR

Base Year

2020

Forecast Years

2021-2026

Key Market Players

Northrop Grumman Corporation, General Dynamics, CBC Global Ammunition, Olin Corporation, Ruag Ammotec, BAE Systems, Thales Group, Rheinmetal AG, Nexter KNDS Group, Elbit Systems, Nammo AS, ST Engineering, Remington Arms Company, Sierra Builders, Ruag Corporation

Key Segments

By Caliber, Products, Applications, and Region

Major Regions Covered

North America, Europe, Asia Pacific, Latin America, and Middle East & Africa

Purchase Options

Request customized purchase options to meet your research needs. Explore purchase options

logo Regional Analysis

North America is expected to witness the largest market share during the advent of the forecast period owing to rising terrorist activities in the region coupled with lenient gun laws in the form of favorable government policies to name a few. Additionally, increased military spending from the United States of America coupled with development and a rapid acquirement process of warfare will increase the footprint of the global ammunition market during the advent of the forecast period.

Asia-Pacific is expected to witness the fastest growing CAGR during the advent of the forecast period owing to the region being the hotbed of increasing geopolitical conflicts and increasing threats of terrorist attacks to name a few. Moreover, increasing factors in terms of reducing the accentuating crime rate coupled with increased procurement of bullets from various government bodies across the region will push the existing boundaries of the ammunition market in the region during the forecast.

logo Competitive Players

  • Northrop Grumman Corporation
  • General Dynamics
  • CBC Global Ammunition
  • Olin Corporation
  • Ruag Ammotec
  • BAE Systems
  • Thales Group
  • Rheinmetal AG
  • Nexter KNDS Group
  • Elbit Systems
  • Nammo AS
  • ST Engineering
  • Remington Arms Company
  • Sierra Builders
  • Ruag Corporation

logo By Caliber Segment Analysis

  • Small Caliber
    • 5.56 mm
    • 7.62 mm
    • 9 mm
      • Others
  • Medium Caliber
    • 23 mm
    • 30 mm
    • Others
  • Large Caliber
    • VSHORAD
    • 122 mm
    • Others
  • Rockets, Missiles, And Others
    • Tank Ammunition Rounds
    • Artillery Ammunition Rounds

logo By Product Segment Analysis

  • Rimfire
  • Centerfire

logo By Application Segment Analysis

  • Civil & Commercial
    • Sports & Hunting
  • Defense
    • Military
    • Law Enforcement

logo By Regional Segment Analysis

  • North America
    • The U.S.
    • Canada
  • Europe
    • UK
    • France
    • Germany
    • Italy
    • Spain
    • Rest of Europe
  • Asia Pacific
    • China
    • Japan
    • India
    • South Korea
    • Southeast Asia
    • Rest of Asia Pacific
  • Latin America
    • Brazil
    • Mexico
    • Rest of Latin America
  • Middle East and Africa
    • GCC Countries
    • South Africa
    • Rest of MEA

Table of Content

  1. Chapter 1 Executive Summary
    1. 1.1. Introduction of Ammunition
    2. 1.2. Global Ammunition Market, 2019 & 2026 (USD Billion)
    3. 1.3. Global Ammunition Market, 2016 – 2026 (USD Billion)
    4. 1.4. Global Ammunition Market Absolute Revenue Opportunity, 2016 – 2026 (USD Billion)
    5. 1.5. Global Ammunition Market Incremental Revenue Opportunity, 2020 – 2026 (USD Billion)
  2. Chapter 2 Ammunition Market – Caliber Analysis
    1. 2.1. Global Ammunition Market – Caliber Overview
    2. 2.2. Global Ammunition Market Share, by Caliber, 2019 & 2026 (USD Billion)
    3. 2.3. Small Caliber
      1. 2.3.1. Global Small Caliber Ammunition Market, 2016 – 2026 (USD Billion)
    4. 2.4. Medium Caliber
      1. 2.4.1. Global Medium Caliber Ammunition Market, 2016 – 2026 (USD Billion)
    5. 2.5. Large Caliber
      1. 2.5.1. Global Large Caliber Ammunition Market, 2016 – 2026 (USD Billion)
    6. 2.6. Rockets, Missiles, And Others
      1. 2.6.1. Global Rockets, Missiles, And Others Ammunition Market, 2016 – 2026 (USD Billion)
  3. Chapter 3 Ammunition Market – Product Analysis
    1. 3.1. Global Ammunition Market – Product Overview
    2. 3.2. Global Ammunition Market Share, by Product, 2019 & 2026 (USD Billion)
    3. 3.3. Rimfire
      1. 3.3.1. Global Rimfire Ammunition Market, 2016 – 2026 (USD Billion)
    4. 3.4. Centerfire
      1. 3.4.1. Global Centerfire Ammunition Market, 2016 – 2026 (USD Billion)
  4. Chapter 4 Ammunition Market – Application Analysis
    1. 4.1. Global Ammunition Market – Application Overview
    2. 4.2. Global Ammunition Market Share, by Application, 2019 & 2026 (USD Billion)
    3. 4.3. Civil & Commercial
      1. 4.3.1. Global Civil & Commercial Ammunition Market, 2016 – 2026 (USD Billion)
    4. 4.4. Defense
      1. 4.4.1. Global Defense Ammunition Market, 2016 – 2026 (USD Billion)
  5. Chapter 5 Ammunition Market – Regional Analysis
    1. 5.1. Global Ammunition Market Regional Overview
    2. 5.2. Global Ammunition Market Share, by Region, 2019 & 2026 (USD Billion)
    3. 5.3. North America
      1. 5.3.1. North America Ammunition Market, 2016 – 2026 (USD Billion)
        1. 5.3.1.1. North America Ammunition Market, by Country, 2016 - 2026 (USD Billion)
      2. 5.3.2. North America Ammunition Market, by Caliber, 2016 – 2026
        1. 5.3.2.1. North America Ammunition Market, by Caliber, 2016 – 2026 (USD Billion)
      3. 5.3.3. North America Ammunition Market, by Product, 2016 – 2026
        1. 5.3.3.1. North America Ammunition Market, by Product, 2016 – 2026 (USD Billion)
      4. 5.3.4. North America Ammunition Market, by Application, 2016 – 2026
        1. 5.3.4.1. North America Ammunition Market, by Application, 2016 – 2026 (USD Billion)
      5. 5.3.5. U.S.
        1. 5.3.5.1. U.S. Ammunition Market, 2016 – 2026 (USD Billion)
      6. 5.3.6. Canada
        1. 5.3.6.1. Canada Ammunition Market, 2016 – 2026 (USD Billion)
    4. 5.4. Europe
      1. 5.4.1. Europe Ammunition Market, 2016 – 2026 (USD Billion)
        1. 5.4.1.1. Europe Ammunition Market, by Country, 2016 - 2026 (USD Billion)
      2. 5.4.2. Europe Ammunition Market, by Caliber, 2016 – 2026
        1. 5.4.2.1. Europe Ammunition Market, by Caliber, 2016 – 2026 (USD Billion)
      3. 5.4.3. Europe Ammunition Market, by Product, 2016 – 2026
        1. 5.4.3.1. Europe Ammunition Market, by Product, 2016 – 2026 (USD Billion)
      4. 5.4.4. Europe Ammunition Market, by Application, 2016 – 2026
        1. 5.4.4.1. Europe Ammunition Market, by Application, 2016 – 2026 (USD Billion)
      5. 5.4.5. Germany
        1. 5.4.5.1. Germany Ammunition Market, 2016 – 2026 (USD Billion)
      6. 5.4.6. France
        1. 5.4.6.1. France Ammunition Market, 2016 – 2026 (USD Billion)
      7. 5.4.7. U.K.
        1. 5.4.7.1. U.K. Ammunition Market, 2016 – 2026 (USD Billion)
      8. 5.4.8. Italy
        1. 5.4.8.1. Italy Ammunition Market, 2016 – 2026 (USD Billion)
      9. 5.4.9. Spain
        1. 5.4.9.1. Spain Ammunition Market, 2016 – 2026 (USD Billion)
      10. 5.4.10. Rest of Europe
        1. 5.4.10.1. Rest of Europe Ammunition Market, 2016 – 2026 (USD Billion)
    5. 5.5. Asia Pacific
      1. 5.5.1. Asia Pacific Ammunition Market, 2016 – 2026 (USD Billion)
        1. 5.5.1.1. Asia Pacific Ammunition Market, by Country, 2016 - 2026 (USD Billion)
      2. 5.5.2. Asia Pacific Ammunition Market, by Caliber, 2016 – 2026
        1. 5.5.2.1. Asia Pacific Ammunition Market, by Caliber, 2016 – 2026 (USD Billion)
      3. 5.5.3. Asia Pacific Ammunition Market, by Product, 2016 – 2026
        1. 5.5.3.1. Asia Pacific Ammunition Market, by Product, 2016 – 2026 (USD Billion)
      4. 5.5.4. Asia Pacific Ammunition Market, by Application, 2016 – 2026
        1. 5.5.4.1. Asia Pacific Ammunition Market, by Application, 2016 – 2026 (USD Billion)
      5. 5.5.5. China
        1. 5.5.5.1. China Ammunition Market, 2016 – 2026 (USD Billion)
      6. 5.5.6. Japan
        1. 5.5.6.1. Japan Ammunition Market, 2016 – 2026 (USD Billion)
      7. 5.5.7. India
        1. 5.5.7.1. India Ammunition Market, 2016 – 2026 (USD Billion)
      8. 5.5.8. South Korea
        1. 5.5.8.1. South Korea Ammunition Market, 2016 – 2026 (USD Billion)
      9. 5.5.9. South-East Asia
        1. 5.5.9.1. South-East Asia Ammunition Market, 2016 – 2026 (USD Billion)
      10. 5.5.10. Rest of Asia Pacific
        1. 5.5.10.1. Rest of Asia Pacific Ammunition Market, 2016 – 2026 (USD Billion)
    6. 5.6. Latin America
      1. 5.6.1. Latin America Ammunition Market, 2016 – 2026 (USD Billion)
        1. 5.6.1.1. Latin America Ammunition Market, by Country, 2016 - 2026 (USD Billion)
      2. 5.6.2. Latin America Ammunition Market, by Caliber, 2016 – 2026
        1. 5.6.2.1. Latin America Ammunition Market, by Caliber, 2016 – 2026 (USD Billion)
      3. 5.6.3. Latin America Ammunition Market, by Product, 2016 – 2026
        1. 5.6.3.1. Latin America Ammunition Market, by Product, 2016 – 2026 (USD Billion)
      4. 5.6.4. Latin America Ammunition Market, by Application, 2016 – 2026
        1. 5.6.4.1. Latin America Ammunition Market, by Application, 2016 – 2026 (USD Billion)
      5. 5.6.5. Brazil
        1. 5.6.5.1. Brazil Ammunition Market, 2016 – 2026 (USD Billion)
      6. 5.6.6. Mexico
        1. 5.6.6.1. Mexico Ammunition Market, 2016 – 2026 (USD Billion)
      7. 5.6.7. Rest of Latin America
        1. 5.6.7.1. Rest of Latin America Ammunition Market, 2016 – 2026 (USD Billion)
    7. 5.7. The Middle-East and Africa
      1. 5.7.1. The Middle-East and Africa Ammunition Market, 2016 – 2026 (USD Billion)
        1. 5.7.1.1. The Middle-East and Africa Ammunition Market, by Country, 2016 - 2026 (USD Billion)
      2. 5.7.2. The Middle-East and Africa Ammunition Market, by Caliber, 2016 – 2026
        1. 5.7.2.1. The Middle-East and Africa Ammunition Market, by Caliber, 2016 – 2026 (USD Billion)
      3. 5.7.3. The Middle-East and Africa Ammunition Market, by Product, 2016 – 2026
        1. 5.7.3.1. The Middle-East and Africa Ammunition Market, by Product, 2016 – 2026 (USD Billion)
      4. 5.7.4. The Middle-East and Africa Ammunition Market, by Application, 2016 – 2026
        1. 5.7.4.1. The Middle-East and Africa Ammunition Market, by Application, 2016 – 2026 (USD Billion)
      5. 5.7.5. GCC Countries
        1. 5.7.5.1. GCC Countries Ammunition Market, 2016 – 2026 (USD Billion)
      6. 5.7.6. South Africa
        1. 5.7.6.1. South Africa Ammunition Market, 2016 – 2026 (USD Billion)
      7. 5.7.7. Rest of Middle-East Africa
        1. 5.7.7.1. Rest of Middle-East Africa Ammunition Market, 2016 – 2026 (USD Billion)
  6. Chapter 6 Ammunition Market – Competitive Landscape
    1. 6.1. Competitor Market Share – Revenue
    2. 6.2. Market Concentration Rate Analysis, Top 3 and Top 5 Players
    3. 6.3. Strategic Developments
      1. 6.3.1. Acquisitions and Mergers
      2. 6.3.2. New Products
      3. 6.3.3. Research & Development Activities
  7. Chapter 7 Company Profiles
    1. 7.1. Northrop Grumman Corporation
      1. 7.1.1. Company Overview
      2. 7.1.2. Product/Service Portfolio
      3. 7.1.3. Northrop Grumman Corporation Sales, Revenue, and Gross Margin
      4. 7.1.4. Northrop Grumman Corporation Revenue and Growth Rate
      5. 7.1.5. Northrop Grumman Corporation Market Share
      6. 7.1.6. Recent Initiatives, Funding/VC Activities, and Technological Innovations
    2. 7.2. General Dynamics
      1. 7.2.1. Company Overview
      2. 7.2.2. Product/Service Portfolio
      3. 7.2.3. General Dynamics Sales, Revenue, and Gross Margin
      4. 7.2.4. General Dynamics Revenue and Growth Rate
      5. 7.2.5. General Dynamics Market Share
      6. 7.2.6. Recent Initiatives, Funding/VC Activities, and Technological Innovations
    3. 7.3. CBC Global Ammunition
      1. 7.3.1. Company Overview
      2. 7.3.2. Product/Service Portfolio
      3. 7.3.3. CBC Global Ammunition Sales, Revenue, and Gross Margin
      4. 7.3.4. CBC Global Ammunition Revenue and Growth Rate
      5. 7.3.5. CBC Global Ammunition Market Share
      6. 7.3.6. Recent Initiatives, Funding/VC Activities, and Technological Innovations
    4. 7.4. Olin Corporation
      1. 7.4.1. Company Overview
      2. 7.4.2. Product/Service Portfolio
      3. 7.4.3. Olin Corporation Sales, Revenue, and Gross Margin
      4. 7.4.4. Olin Corporation Revenue and Growth Rate
      5. 7.4.5. Olin Corporation Market Share
      6. 7.4.6. Recent Initiatives, Funding/VC Activities, and Technological Innovations
    5. 7.5. Ruag Ammotec
      1. 7.5.1. Company Overview
      2. 7.5.2. Product/Service Portfolio
      3. 7.5.3. Ruag Ammotec Sales, Revenue, and Gross Margin
      4. 7.5.4. Ruag Ammotec Revenue and Growth Rate
      5. 7.5.5. Ruag Ammotec Market Share
      6. 7.5.6. Recent Initiatives, Funding/VC Activities, and Technological Innovations
    6. 7.6. BAE Systems
      1. 7.6.1. Company Overview
      2. 7.6.2. Product/Service Portfolio
      3. 7.6.3. BAE Systems Sales, Revenue, and Gross Margin
      4. 7.6.4. BAE Systems Revenue and Growth Rate
      5. 7.6.5. BAE Systems Market Share
      6. 7.6.6. Recent Initiatives, Funding/VC Activities, and Technological Innovations
    7. 7.7. Thales Group
      1. 7.7.1. Company Overview
      2. 7.7.2. Product/Service Portfolio
      3. 7.7.3. Thales Group Sales, Revenue, and Gross Margin
      4. 7.7.4. Thales Group Revenue and Growth Rate
      5. 7.7.5. Thales Group Market Share
      6. 7.7.6. Recent Initiatives, Funding/VC Activities, and Technological Innovations
    8. 7.8. Rheinmetal AG
      1. 7.8.1. Company Overview
      2. 7.8.2. Product/Service Portfolio
      3. 7.8.3. Rheinmetal AG Sales, Revenue, and Gross Margin
      4. 7.8.4. Rheinmetal AG Revenue and Growth Rate
      5. 7.8.5. Rheinmetal AG Market Share
      6. 7.8.6. Recent Initiatives, Funding/VC Activities, and Technological Innovations
    9. 7.9. Nexter KNDS Group
      1. 7.9.1. Company Overview
      2. 7.9.2. Product/Service Portfolio
      3. 7.9.3. Nexter KNDS Group Sales, Revenue, and Gross Margin
      4. 7.9.4. Nexter KNDS Group Revenue and Growth Rate
      5. 7.9.5. Nexter KNDS Group Market Share
      6. 7.9.6. Recent Initiatives, Funding/VC Activities, and Technological Innovations
    10. 7.10. Elbit Systems
      1. 7.10.1. Company Overview
      2. 7.10.2. Product/Service Portfolio
      3. 7.10.3. Elbit Systems Sales, Revenue, and Gross Margin
      4. 7.10.4. Elbit Systems Revenue and Growth Rate
      5. 7.10.5. Elbit Systems Market Share
      6. 7.10.6. Recent Initiatives, Funding/VC Activities, and Technological Innovations
    11. 7.11. Nammo AS
      1. 7.11.1. Company Overview
      2. 7.11.2. Product/Service Portfolio
      3. 7.11.3. Nammo AS Sales, Revenue, and Gross Margin
      4. 7.11.4. Nammo AS Revenue and Growth Rate
      5. 7.11.5. Nammo AS Market Share
      6. 7.11.6. Recent Initiatives, Funding/VC Activities, and Technological Innovations
    12. 7.12. ST Engineering
      1. 7.12.1. Company Overview
      2. 7.12.2. Product/Service Portfolio
      3. 7.12.3. ST Engineering Sales, Revenue, and Gross Margin
      4. 7.12.4. ST Engineering Revenue and Growth Rate
      5. 7.12.5. ST Engineering Market Share
      6. 7.12.6. Recent Initiatives, Funding/VC Activities, and Technological Innovations
    13. 7.13. Remington Arms Company
      1. 7.13.1. Company Overview
      2. 7.13.2. Product/Service Portfolio
      3. 7.13.3. Remington Arms Company Sales, Revenue, and Gross Margin
      4. 7.13.4. Remington Arms Company Revenue and Growth Rate
      5. 7.13.5. Remington Arms Company Market Share
      6. 7.13.6. Recent Initiatives, Funding/VC Activities, and Technological Innovations
    14. 7.14. Sierra Bullters
      1. 7.14.1. Company Overview
      2. 7.14.2. Product/Service Portfolio
      3. 7.14.3. Sierra Bullters Sales, Revenue, and Gross Margin
      4. 7.14.4. Sierra Bullters Revenue and Growth Rate
      5. 7.14.5. Sierra Bullters Market Share
      6. 7.14.6. Recent Initiatives, Funding/VC Activities, and Technological Innovations
    15. 7.15. Ruag Corporation
      1. 7.15.1. Company Overview
      2. 7.15.2. Product/Service Portfolio
      3. 7.15.3. Ruag Corporation Sales, Revenue, and Gross Margin
      4. 7.15.4. Ruag Corporation Revenue and Growth Rate
      5. 7.15.5. Ruag Corporation Market Share
      6. 7.15.6. Recent Initiatives, Funding/VC Activities, and Technological Innovations
  8. Chapter 8 Ammunition — Industry Analysis
    1. 8.1. Introduction and Taxonomy
    2. 8.2. Ammunition Market – Key Trends
      1. 8.2.1. Market Drivers
      2. 8.2.2. Market Restraints
      3. 8.2.3. Market Opportunities
    3. 8.3. Value Chain Analysis
    4. 8.4. Key Mandates and Regulations
    5. 8.5. Technology Roadmap and Timeline
    6. 8.6. Ammunition Market – Attractiveness Analysis
      1. 8.6.1. By Caliber
      2. 8.6.2. By Product
      3. 8.6.3. By Application
      4. 8.6.4. By Region
  9. Chapter 9 Industrial Chain, Sourcing Strategy, and Downstream Buyers
    1. 9.1. Ammunition Industrial Chain Analysis
    2. 9.2. Downstream Buyers
    3. 9.3. Distributors/Traders List
  10. Chapter 10 Marketing Strategy Analysis
    1. 10.1. Marketing Channel
    2. 10.2. Direct Marketing
    3. 10.3. Indirect Marketing
    4. 10.4. Marketing Channel Development Trends
    5. 10.5. Economic/Political Environmental Change
  11. Chapter 11 Report Conclusion & Key Insights
    1. 11.1. Key Insights from Primary Interviews & Surveys Respondents
    2. 11.2. Key Takeaways from Analysts, Consultants, and Industry Leaders
  12. Chapter 12 Research Approach & Methodology
    1. 12.1. Report Description
    2. 12.2. Research Scope
    3. 12.3. Research Methodology
      1. 12.3.1. Secondary Research
      2. 12.3.2. Primary Research
      3. 12.3.3. Statistical Models
        1. 12.3.3.1. Company Share Analysis Model
        2. 12.3.3.2. Revenue Based Modeling
      4. 12.3.4. Research Limitations

      List of Figures

      Fig.1	Product Picture of Ammunition
      Fig.2	Global Ammunition Market, 2016 – 2026 (USD Billion)
      Fig.3	Global Ammunition Market Absolute Revenue Opportunity, 2016 – 2026 (USD Billion)
      Fig.4	Global Ammunition Market Incremental Revenue Opportunity, 2020 – 2026 (USD Billion)
      Fig.5	Global Ammunition Market Share, by Caliber, 2019 & 2026 (USD Billion)
      Fig.6	Global Small Caliber Ammunition Market, 2016 – 2026 (USD Billion)
      Fig.7	Global Medium Caliber  Ammunition Market, 2016 – 2026 (USD Billion)
      Fig.8	Global Large Caliber Ammunition Market, 2016 – 2026 (USD Billion)
      Fig.9	Global Rockets, Missiles, And Others Ammunition Market, 2016 – 2026 (USD Billion)
      Fig.10	Global Ammunition Market Share, by Product, 2019 & 2026 (USD Billion)
      Fig.11	Global Rimfire Ammunition Market, 2016 – 2026 (USD Billion)
      Fig.12	Global Centerfire Ammunition Market, 2016 – 2026 (USD Billion)
      Fig.13	Global Ammunition Market Share, by Application, 2019 & 2026 (USD Billion)
      Fig.14	Global Civil & Commercial Ammunition Market, 2016 – 2026 (USD Billion)
      Fig.15	Global Defense Ammunition Market, 2016 – 2026 (USD Billion)
      Fig.16	Global Ammunition Market Share, by Region, 2019 & 2026 (USD Billion)
      Fig.17	North America Ammunition Market, 2016 – 2026 (USD Billion)
      Fig.18	U.S. Ammunition Market, 2016 – 2026 (USD Billion)
      Fig.19	Canada Ammunition Market, 2016 – 2026 (USD Billion)
      Fig.20	Europe Ammunition Market, 2016 – 2026 (USD Billion)
      Fig.21	Germany Ammunition Market, 2016 – 2026 (USD Billion)
      Fig.22	France Ammunition Market, 2016 – 2026 (USD Billion)
      Fig.23	U.K. Ammunition Market, 2016 – 2026 (USD Billion)
      Fig.24	Italy Ammunition Market, 2016 – 2026 (USD Billion)
      Fig.25	Spain Ammunition Market, 2016 – 2026 (USD Billion)
      Fig.26	Rest of Europe Ammunition Market, 2016 – 2026 (USD Billion)
      Fig.27	Asia Pacific Ammunition Market, 2016 – 2026 (USD Billion)
      Fig.28	China Ammunition Market, 2016 – 2026 (USD Billion)
      Fig.29	Japan Ammunition Market, 2016 – 2026 (USD Billion)
      Fig.30	India Ammunition Market, 2016 – 2026 (USD Billion)
      Fig.31	South  Korea Ammunition Market, 2016 – 2026 (USD Billion)
      Fig.32	South-East Asia Ammunition Market, 2016 – 2026 (USD Billion)
      Fig.33	Rest of Asia Pacific Ammunition Market, 2016 – 2026 (USD Billion)
      Fig.34	Latin America Ammunition Market, 2016 – 2026 (USD Billion)
      Fig.35	Brazil Ammunition Market, 2016 – 2026 (USD Billion)
      Fig.36	Mexico Ammunition Market, 2016 – 2026 (USD Billion)
      Fig.37	Rest of Latin America Ammunition Market, 2016 – 2026 (USD Billion)
      Fig.38	The Middle-East and Africa Ammunition Market, 2016 – 2026 (USD Billion)
      Fig.39	GCC Countries Ammunition Market, 2016 – 2026 (USD Billion)
      Fig.40	South Africa Ammunition Market, 2016 – 2026 (USD Billion)
      Fig.41	Rest of Middle-East Africa Ammunition Market, 2016 – 2026 (USD Billion)
      Fig.42	Competitor Market Share – Revenue
      Fig.43	Northrop Grumman Corporation Revenue and Growth Rate
      Fig.44	Northrop Grumman Corporation Market Share
      Fig.45	General Dynamics Revenue and Growth Rate
      Fig.46	General Dynamics Market Share
      Fig.47	CBC Global Ammunition Revenue and Growth Rate
      Fig.48	CBC Global Ammunition Market Share
      Fig.49	Olin Corporation Revenue and Growth Rate
      Fig.50	Olin Corporation Market Share
      Fig.51	Ruag Ammotec Revenue and Growth Rate
      Fig.52	Ruag Ammotec Market Share
      Fig.53	BAE Systems Revenue and Growth Rate
      Fig.54	BAE Systems Market Share
      Fig.55	Thales Group Revenue and Growth Rate
      Fig.56	Thales Group Market Share
      Fig.57	Rheinmetal AG Revenue and Growth Rate
      Fig.58	Rheinmetal AG Market Share
      Fig.59	Nexter KNDS Group Revenue and Growth Rate
      Fig.60	Nexter KNDS Group Market Share
      Fig.61	Elbit Systems Revenue and Growth Rate
      Fig.62	Elbit Systems Market Share
      Fig.63	Nammo AS Revenue and Growth Rate
      Fig.64	Nammo AS Market Share
      Fig.65	ST Engineering Revenue and Growth Rate
      Fig.66	ST Engineering Market Share
      Fig.67	Remington Arms Company Revenue and Growth Rate
      Fig.68	Remington Arms Company Market Share
      Fig.69	Sierra Bullters Revenue and Growth Rate
      Fig.70	Sierra Bullters Market Share
      Fig.71	Ruag Corporation Revenue and Growth Rate
      Fig.72	Ruag Corporation Market Share
      Fig.73	Market Dynamics
      Fig.74	Global Ammunition – Value Chain Analysis
      Fig.75	Key Mandates and Regulations
      Fig.76	Technology Roadmap and Timeline
      Fig.77	Market Attractiveness Analysis – By Caliber
      Fig.78	Market Attractiveness Analysis – By Product
      Fig.79	Market Attractiveness Analysis – By Application
      Fig.80	Market Attractiveness Analysis – By Region
      Fig.81	Ammunition Industrial Chain Analysis
      Fig.82	Market Channels
      Fig.83	Marketing Channel Development Trend
      Fig.84	Growth in World Gross Product, 2008-2018
      

      List of Tables

      Table 1	Global Ammunition Market, 2019 & 2026 (USD Billion)
      Table 2	Global Ammunition Market, by Caliber, 2016 – 2026 (USD Billion)
      Table 3	Global Ammunition Market, by Product, 2016 – 2026 (USD Billion)
      Table 4	Global Ammunition Market, by Application, 2016 – 2026 (USD Billion)
      Table 5	Global Ammunition Market, by Region, 2016 – 2026 (USD Billion)
      Table 6	North America Ammunition Market, by Country, 2016 – 2026 (USD Billion)
      Table 7	North America Ammunition Market, by Caliber, 2016 – 2026 (USD Billion)
      Table 8	North America Ammunition Market, by Product, 2016 – 2026 (USD Billion)
      Table 9 North America Ammunition Market, by Application, 2016 – 2026 (USD Billion)
      Table 10 Europe Ammunition Market, by Country, 2016 – 2026 (USD Billion)
      Table 11 Europe Ammunition Market, by Caliber, 2016 – 2026 (USD Billion)
      Table 12 Europe Ammunition Market, by Product, 2016 – 2026 (USD Billion)
      Table 13 Europe Ammunition Market, by Application, 2016 – 2026 (USD Billion)
      Table 14 Asia Pacific Ammunition Market, by Country, 2016 – 2026 (USD Billion)
      Table 15 Asia Pacific Ammunition Market, by Caliber, 2016 – 2026 (USD Billion)
      Table 16 Asia Pacific Ammunition Market, by Product, 2016 – 2026 (USD Billion)
      Table 17 Asia Pacific Ammunition Market, by Application, 2016 – 2026 (USD Billion)
      Table 18 Latin America Ammunition Market, by Country, 2016 – 2026 (USD Billion)
      Table 19 Latin America Ammunition Market, by Caliber, 2016 – 2026 (USD Billion)
      Table 20 Latin America Ammunition Market, by Product, 2016 – 2026 (USD Billion)
      Table 21 Latin America Ammunition Market, by Application, 2016 – 2026 (USD Billion)
      Table 22 The Middle-East and Africa Ammunition Market, by Country, 2016 – 2026 (USD Billion)
      Table 23 The Middle-East and Africa Ammunition Market, by Caliber, 2016 – 2026 (USD Billion)
      Table 24 The Middle-East and Africa Ammunition Market, by Product, 2016 – 2026 (USD Billion)
      Table 25 The Middle-East and Africa Ammunition Market, by Application, 2016 – 2026 (USD Billion)
      Table 26 Global Ammunition Market - Company Revenue Analysis, 2016 – 2019 (USD Billion)
      Table 27 Global Ammunition Market - Company Revenue Share Analysis, 2016 – 2019 (%)
      Table 28 Acquisitions and Mergers
      Table 29 Market Drivers – Impact Analysis
      Table 30 Market Restraints
      Table 31 Market Opportunities
      Table 32 Major Buyers of Ammunition
      Table 33 Distributors/Traders of Ammunition by Region
      

Industry Major Market Players

  • Northrop Grumman Corporation
  • General Dynamics
  • CBC Global Ammunition
  • Olin Corporation
  • Ruag Ammotec
  • BAE Systems
  • Thales Group
  • Rheinmetal AG
  • Nexter KNDS Group
  • Elbit Systems
  • Nammo AS
  • ST Engineering
  • Remington Arms Company
  • Sierra Bullters
  • Ruag Corporation