Search Market Research Report

Discover Our Latest Reports
Discover Our Featured Reports
Discover Top Selling Reports

AI in HIV/AIDS Market Size, Share Global Analysis Report, 2021 – 2026

report img

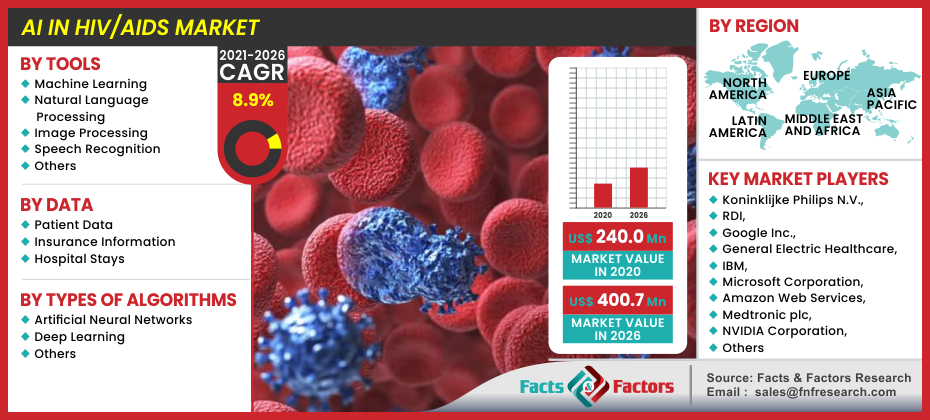
AI in HIV/AIDS Market By Tools (Machine Learning, Natural Language Processing, Image Processing, Speech Recognition, And Others), By Data (Patient Data, Insurance Information, And Hospital Stay), By Types Of Algorithms (Artificial Neural Networks, Deep Learning, And Others): Global and Regional Industry Perspective, Comprehensive Analysis, and Forecast 2021 – 2026

Industry Insights

[197+ Pages Report] According to a Facts and Factors report, global AI in HIV/AIDS market was valued at over USD 240.0 million in 2020 and is expected to generate revenue of over USD 400.7 million by the end of 2026, with a CAGR of around 8.9% during the projected period.

logoMarket Overview            

Artificial intelligence (AI) is a term referring to a scientific discipline that focuses on the development of robots that can partially or completely replicate human intelligence. These machines are made up of computers, sensors, robots, and hyper-smart gadgets.

In healthcare, artificial intelligence (AI) is the use of advanced algorithms to mimic human perception in the analysis, comprehension, and interpretation of complicated medical and healthcare data. AI is a type of intelligent system that connects diverse human intelligence-based capabilities including reasoning, learning, and problem-solving across fields such as engineering, biology, computer science, mathematics, psychology, and linguistics. Furthermore, the healthcare business benefits from the integration of artificial intelligence (AI) and machine learning technologies, which makes medication research and development more innovative, time-effective, and cost-effective.

To detect potential candidates for preexposure prophylaxis (PrEP), artificial intelligence and machine learning algorithms have been used in hospital settings in the Denmark and United States, as well as in a population-based research environment in Eastern Africa. The benefits of this technology are to encourage real-time HIV risk reduction and chatbots for HIV education.

AI in HIV/AIDS Market

To know more about this report | Request Free Sample Copy

logoIndustry Growth Factors

The healthcare industry is faced with a number of difficulties, including staff reductions, increasing service standards, and budgetary cuts. It's no surprise that many individuals are turning to artificial intelligence (AI) for better solutions, which is propelling AI's growth in the HIV/AIDS industry. In addition, increased AI capabilities and the use of AI for unique surgeries, are propelling the worldwide AI investments in the healthcare sector which is proliferating the market growth forward.

logoSegmentation Analysis

On the basis of tools used in Artificial Intelligence (AI) in HIV & AIDS Market, the market can be segmented into Machine Learning, Natural Language Processing, Image Processing, Speech Recognition, and others. Based on data used for AI, the Artificial Intelligence (AI) in HIV & AIDS market can be segmented into patient data, insurance information, and hospital stay. Based on the types of algorithms used for Artificial Intelligence (AI) in the HIV & AIDS Market, the market can be segmented into artificial neural networks, deep learning, and others.

logo Regional Analysis

Since it is home to some of the world's leading giant enterprises, such as Google, Intel, NVIDIA, IBM, GE Healthcare, Microsoft, and Johnson & Johnson, North America dominates the worldwide Artificial Intelligence in HIV & AIDS market. The United States held the largest market share in North America in 2019. Although the United States has the most registered hospitals in the region, a lack of healthcare workers is expected in the future years. AI can aid with patient data management, patient care, and hospital administration apps, all of which can help to alleviate such problems.

logoReport Scope

Report Attribute

Details

Market Size in 2020

USD 240.0 Million

Projected Market Size in 2026

USD 400.7 Million

CAGR Growth Rate

8.9% CAGR

Base Year

2020

Forecast Years

2020-2026

Key Market Players

Koninklijke Philips N.V., RDI, Google Inc., General Electric Healthcare, IBM, Microsoft Corporation, Amazon Web Services, Medtronic plc, Johnson & Johnson Services, Inc., NVIDIA Corporation, Intel Corporation, General Vision, Inc., and Siemens Healthineers AG among others.

Key Segment

By Tools, By Data, By Types of Algorithms, and By Regiona

Major Regions Covered

North America, Europe, Asia Pacific, Latin America, and the Middle East & Africa

Purchase Options

Request customized purchase options to meet your research needs. Explore purchase options

logo Competitive Players

Some main participants of the global AI in HIV/AIDS market are:

  • Koninklijke Philips N.V.
  • RDI
  • Google Inc.
  • General Electric Healthcare
  • IBM
  • Microsoft Corporation
  • Amazon Web Services
  • Medtronic plc
  • Johnson & Johnson Services Inc.
  • NVIDIA Corporation
  • Intel Corporation
  • General Vision Inc.
  • Siemens Healthineers AG

logoAI in HIV/AIDS Market: Segmentation Analysis

logoBy Tools:

  • Machine Learning
  • Natural Language Processing
  • Image Processing
  • Speech Recognition
  • Others

logoBy Data:

  • Patient Data
  • Insurance Information
  • Hospital Stays

logoBy Types of Algorithms:

  • Artificial Neural Networks
  • Deep Learning
  • Others

logoRegional Segment Analysis

  • North America
    • U.S.
    • Canada
  • Europe
    • UK
    • France
    • Germany
    • Italy
    • Spain
    • Rest of Europe
  • Asia Pacific
    • China
    • Japan
    • India
    • South Korea
    • Southeast Asia
    • Rest of Asia Pacific
  • Latin America
    • Brazil
    • Mexico
    • Rest of Latin America
  • Middle East and Africa
    • GCC Countries
    • South Africa
    • Rest of MEA

Table of Content

  1. Chapter 1 Executive Summary
    1. 1.1. Introduction of AI in HIV/AIDS
    2. 1.2. Global AI in HIV/AIDS Market, 2020 & 2026 (USD Million)
    3. 1.3. Global AI in HIV/AIDS Market, 2016 – 2026 (USD Million)
    4. 1.4. Global AI in HIV/AIDS Market Absolute Revenue Opportunity, 2016 – 2026 (USD Million)
    5. 1.5. Global AI in HIV/AIDS Market Incremental Revenue Opportunity, 2020 – 2026 (USD Million)
  2. Chapter 2 AI in HIV/AIDS Market – Tools Analysis
    1. 2.1. Global AI in HIV/AIDS Market – Tools Overview
    2. 2.2. Global AI in HIV/AIDS Market Share, by Tools, 2020 & 2026 (USD Million)
    3. 2.3. Machine Learning
      1. 2.3.1. Global Machine Learning AI in HIV/AIDS Market, 2016 – 2026 (USD Million)
    4. 2.4. Natural Language Processing
      1. 2.4.1. Global Natural Language Processing AI in HIV/AIDS Market, 2016 – 2026 (USD Million)
    5. 2.5. Image Processing
      1. 2.5.1. Global Image Processing AI in HIV/AIDS Market, 2016 – 2026 (USD Million)
    6. 2.6. Speech Recognition
      1. 2.6.1. Global Speech Recognition AI in HIV/AIDS Market, 2016 – 2026 (USD Million)
    7. 2.7. Others
      1. 2.7.1. Global Others AI in HIV/AIDS Market, 2016 – 2026 (USD Million)
  3. Chapter 3 AI in HIV/AIDS Market – Data Analysis
    1. 3.1. Global AI in HIV/AIDS Market – Data Overview
    2. 3.2. Global AI in HIV/AIDS Market Share, by Data, 2020 & 2026 (USD Million)
    3. 3.3. Patient Data
      1. 3.3.1. Global Patient Data AI in HIV/AIDS Market, 2016 – 2026 (USD Million)
    4. 3.4. Insurance Information
      1. 3.4.1. Global Insurance Information AI in HIV/AIDS Market, 2016 – 2026 (USD Million)
    5. 3.5. Hospital Stays
      1. 3.5.1. Global Hospital Stays AI in HIV/AIDS Market, 2016 – 2026 (USD Million)
  4. Chapter 4 AI in HIV/AIDS Market – Types of Algorithms Analysis
    1. 4.1. Global AI in HIV/AIDS Market – Types of Algorithms Overview
    2. 4.2. Global AI in HIV/AIDS Market Share, by Types of Algorithms, 2020 & 2026 (USD Million)
    3. 4.3. Artificial Neural Networks
      1. 4.3.1. Global Artificial Neural Networks AI in HIV/AIDS Market, 2016 – 2026 (USD Million)
    4. 4.4. Deep Learning
      1. 4.4.1. Global Deep Learning AI in HIV/AIDS Market, 2016 – 2026 (USD Million)
    5. 4.5. Others
      1. 4.5.1. Global Others AI in HIV/AIDS Market, 2016 – 2026 (USD Million)
  5. Chapter 5 AI in HIV/AIDS Market – Regional Analysis
    1. 5.1. Global AI in HIV/AIDS Market Regional Overview
    2. 5.2. Global AI in HIV/AIDS Market Share, by Region, 2020 & 2026 (USD Million)
    3. 5.3. North America
      1. 5.3.1. North America AI in HIV/AIDS Market, 2016 – 2026 (USD Million)
        1. 5.3.1.1. North America AI in HIV/AIDS Market, by Country, 2016 - 2026 (USD Million)
      2. 5.3.2. North America AI in HIV/AIDS Market, by Tools, 2016 – 2026
        1. 5.3.2.1. North America AI in HIV/AIDS Market, by Tools, 2016 – 2026 (USD Million)
      3. 5.3.3. North America AI in HIV/AIDS Market, by Data, 2016 – 2026
        1. 5.3.3.1. North America AI in HIV/AIDS Market, by Data, 2016 – 2026 (USD Million)
      4. 5.3.4. North America AI in HIV/AIDS Market, by Types of Algorithms, 2016 – 2026
        1. 5.3.4.1. North America AI in HIV/AIDS Market, by Types of Algorithms, 2016 – 2026 (USD Million)
      5. 5.3.5. U.S.
        1. 5.3.5.1. U.S. AI in HIV/AIDS Market, 2016 – 2026 (USD Million)
      6. 5.3.6. Canada
        1. 5.3.6.1. Canada AI in HIV/AIDS Market, 2016 – 2026 (USD Million)
    4. 5.4. Europe
      1. 5.4.1. Europe AI in HIV/AIDS Market, 2016 – 2026 (USD Million)
        1. 5.4.1.1. Europe AI in HIV/AIDS Market, by Country, 2016 - 2026 (USD Million)
      2. 5.4.2. Europe AI in HIV/AIDS Market, by Tools, 2016 – 2026
        1. 5.4.2.1. Europe AI in HIV/AIDS Market, by Tools, 2016 – 2026 (USD Million)
      3. 5.4.3. Europe AI in HIV/AIDS Market, by Data, 2016 – 2026
        1. 5.4.3.1. Europe AI in HIV/AIDS Market, by Data, 2016 – 2026 (USD Million)
      4. 5.4.4. Europe AI in HIV/AIDS Market, by Types of Algorithms, 2016 – 2026
        1. 5.4.4.1. Europe AI in HIV/AIDS Market, by Types of Algorithms, 2016 – 2026 (USD Million)
      5. 5.4.5. Germany
        1. 5.4.5.1. Germany AI in HIV/AIDS Market, 2016 – 2026 (USD Million)
      6. 5.4.6. France
        1. 5.4.6.1. France AI in HIV/AIDS Market, 2016 – 2026 (USD Million)
      7. 5.4.7. U.K.
        1. 5.4.7.1. U.K. AI in HIV/AIDS Market, 2016 – 2026 (USD Million)
      8. 5.4.8. Italy
        1. 5.4.8.1. Italy AI in HIV/AIDS Market, 2016 – 2026 (USD Million)
      9. 5.4.9. Spain
        1. 5.4.9.1. Spain AI in HIV/AIDS Market, 2016 – 2026 (USD Million)
      10. 5.4.10. Rest of Europe
        1. 5.4.10.1. Rest of Europe AI in HIV/AIDS Market, 2016 – 2026 (USD Million)
    5. 5.5. Asia Pacific
      1. 5.5.1. Asia Pacific AI in HIV/AIDS Market, 2016 – 2026 (USD Million)
        1. 5.5.1.1. Asia Pacific AI in HIV/AIDS Market, by Country, 2016 - 2026 (USD Million)
      2. 5.5.2. Asia Pacific AI in HIV/AIDS Market, by Tools, 2016 – 2026
        1. 5.5.2.1. Asia Pacific AI in HIV/AIDS Market, by Tools, 2016 – 2026 (USD Million)
      3. 5.5.3. Asia Pacific AI in HIV/AIDS Market, by Data, 2016 – 2026
        1. 5.5.3.1. Asia Pacific AI in HIV/AIDS Market, by Data, 2016 – 2026 (USD Million)
      4. 5.5.4. Asia Pacific AI in HIV/AIDS Market, by Types of Algorithms, 2016 – 2026
        1. 5.5.4.1. Asia Pacific AI in HIV/AIDS Market, by Types of Algorithms, 2016 – 2026 (USD Million)
      5. 5.5.5. China
        1. 5.5.5.1. China AI in HIV/AIDS Market, 2016 – 2026 (USD Million)
      6. 5.5.6. Japan
        1. 5.5.6.1. Japan AI in HIV/AIDS Market, 2016 – 2026 (USD Million)
      7. 5.5.7. India
        1. 5.5.7.1. India AI in HIV/AIDS Market, 2016 – 2026 (USD Million)
      8. 5.5.8. South Korea
        1. 5.5.8.1. South Korea AI in HIV/AIDS Market, 2016 – 2026 (USD Million)
      9. 5.5.9. South-East Asia
        1. 5.5.9.1. South-East Asia AI in HIV/AIDS Market, 2016 – 2026 (USD Million)
      10. 5.5.10. Rest of Asia Pacific
        1. 5.5.10.1. Rest of Asia Pacific AI in HIV/AIDS Market, 2016 – 2026 (USD Million)
    6. 5.6. Latin America
      1. 5.6.1. Latin America AI in HIV/AIDS Market, 2016 – 2026 (USD Million)
        1. 5.6.1.1. Latin America AI in HIV/AIDS Market, by Country, 2016 - 2026 (USD Million)
      2. 5.6.2. Latin America AI in HIV/AIDS Market, by Tools, 2016 – 2026
        1. 5.6.2.1. Latin America AI in HIV/AIDS Market, by Tools, 2016 – 2026 (USD Million)
      3. 5.6.3. Latin America AI in HIV/AIDS Market, by Data, 2016 – 2026
        1. 5.6.3.1. Latin America AI in HIV/AIDS Market, by Data, 2016 – 2026 (USD Million)
      4. 5.6.4. Latin America AI in HIV/AIDS Market, by Types of Algorithms, 2016 – 2026
        1. 5.6.4.1. Latin America AI in HIV/AIDS Market, by Types of Algorithms, 2016 – 2026 (USD Million)
      5. 5.6.5. Brazil
        1. 5.6.5.1. Brazil AI in HIV/AIDS Market, 2016 – 2026 (USD Million)
      6. 5.6.6. Mexico
        1. 5.6.6.1. Mexico AI in HIV/AIDS Market, 2016 – 2026 (USD Million)
      7. 5.6.7. Rest of Latin America
        1. 5.6.7.1. Rest of Latin America AI in HIV/AIDS Market, 2016 – 2026 (USD Million)
    7. 5.7. The Middle-East and Africa
      1. 5.7.1. The Middle-East and Africa AI in HIV/AIDS Market, 2016 – 2026 (USD Million)
        1. 5.7.1.1. The Middle-East and Africa AI in HIV/AIDS Market, by Country, 2016 - 2026 (USD Million)
      2. 5.7.2. The Middle-East and Africa AI in HIV/AIDS Market, by Tools, 2016 – 2026
        1. 5.7.2.1. The Middle-East and Africa AI in HIV/AIDS Market, by Tools, 2016 – 2026 (USD Million)
      3. 5.7.3. The Middle-East and Africa AI in HIV/AIDS Market, by Data, 2016 – 2026
        1. 5.7.3.1. The Middle-East and Africa AI in HIV/AIDS Market, by Data, 2016 – 2026 (USD Million)
      4. 5.7.4. The Middle-East and Africa AI in HIV/AIDS Market, by Types of Algorithms, 2016 – 2026
        1. 5.7.4.1. The Middle-East and Africa AI in HIV/AIDS Market, by Types of Algorithms, 2016 – 2026 (USD Million)
      5. 5.7.5. GCC Countries
        1. 5.7.5.1. GCC Countries AI in HIV/AIDS Market, 2016 – 2026 (USD Million)
      6. 5.7.6. South Africa
        1. 5.7.6.1. South Africa AI in HIV/AIDS Market, 2016 – 2026 (USD Million)
      7. 5.7.7. Rest of Middle-East Africa
        1. 5.7.7.1. Rest of Middle-East Africa AI in HIV/AIDS Market, 2016 – 2026 (USD Million)
  6. Chapter 6 AI in HIV/AIDS Market – Competitive Landscape
    1. 6.1. Competitor Market Share – Revenue
    2. 6.2. Market Concentration Rate Analysis, Top 3 and Top 5 Players
    3. 6.3. Strategic Developments
      1. 6.3.1. Acquisitions and Mergers
      2. 6.3.2. New Products
      3. 6.3.3. Research & Development Activities
  7. Chapter 7 Company Profiles
    1. 7.1. Koninklijke Philips N.V.
      1. 7.1.1. Company Overview
      2. 7.1.2. Product/Service Portfolio
      3. 7.1.3. Koninklijke Philips N.V. Sales, Revenue, and Gross Margin
      4. 7.1.4. Koninklijke Philips N.V. Revenue and Growth Rate
      5. 7.1.5. Koninklijke Philips N.V. Market Share
      6. 7.1.6. Recent Initiatives, Funding/VC Activities, and Technological Innovations
    2. 7.2. RDI
      1. 7.2.1. Company Overview
      2. 7.2.2. Product/Service Portfolio
      3. 7.2.3. RDI Sales, Revenue, and Gross Margin
      4. 7.2.4. RDI Revenue and Growth Rate
      5. 7.2.5. RDI Market Share
      6. 7.2.6. Recent Initiatives, Funding/VC Activities, and Technological Innovations
    3. 7.3. Google Inc.
      1. 7.3.1. Company Overview
      2. 7.3.2. Product/Service Portfolio
      3. 7.3.3. Google Inc. Sales, Revenue, and Gross Margin
      4. 7.3.4. Google Inc. Revenue and Growth Rate
      5. 7.3.5. Google Inc. Market Share
      6. 7.3.6. Recent Initiatives, Funding/VC Activities, and Technological Innovations
    4. 7.4. General Electric Healthcare
      1. 7.4.1. Company Overview
      2. 7.4.2. Product/Service Portfolio
      3. 7.4.3. General Electric Healthcare Sales, Revenue, and Gross Margin
      4. 7.4.4. General Electric Healthcare Revenue and Growth Rate
      5. 7.4.5. General Electric Healthcare Market Share
      6. 7.4.6. Recent Initiatives, Funding/VC Activities, and Technological Innovations
    5. 7.5. IBM
      1. 7.5.1. Company Overview
      2. 7.5.2. Product/Service Portfolio
      3. 7.5.3. IBM Sales, Revenue, and Gross Margin
      4. 7.5.4. IBM Revenue and Growth Rate
      5. 7.5.5. IBM Market Share
      6. 7.5.6. Recent Initiatives, Funding/VC Activities, and Technological Innovations
    6. 7.6. Microsoft Corporation
      1. 7.6.1. Company Overview
      2. 7.6.2. Product/Service Portfolio
      3. 7.6.3. Microsoft Corporation Sales, Revenue, and Gross Margin
      4. 7.6.4. Microsoft Corporation Revenue and Growth Rate
      5. 7.6.5. Microsoft Corporation Market Share
      6. 7.6.6. Recent Initiatives, Funding/VC Activities, and Technological Innovations
    7. 7.7. Amazon Web Services
      1. 7.7.1. Company Overview
      2. 7.7.2. Product/Service Portfolio
      3. 7.7.3. Amazon Web Services Sales, Revenue, and Gross Margin
      4. 7.7.4. Amazon Web Services Revenue and Growth Rate
      5. 7.7.5. Amazon Web Services Market Share
      6. 7.7.6. Recent Initiatives, Funding/VC Activities, and Technological Innovations
    8. 7.8. Medtronic plc
      1. 7.8.1. Company Overview
      2. 7.8.2. Product/Service Portfolio
      3. 7.8.3. Medtronic plc Sales, Revenue, and Gross Margin
      4. 7.8.4. Medtronic plc Revenue and Growth Rate
      5. 7.8.5. Medtronic plc Market Share
      6. 7.8.6. Recent Initiatives, Funding/VC Activities, and Technological Innovations
    9. 7.9. Johnson & Johnson Services, Inc.
      1. 7.9.1. Company Overview
      2. 7.9.2. Product/Service Portfolio
      3. 7.9.3. Johnson & Johnson Services, Inc. Sales, Revenue, and Gross Margin
      4. 7.9.4. Johnson & Johnson Services, Inc. Revenue and Growth Rate
      5. 7.9.5. Johnson & Johnson Services, Inc. Market Share
      6. 7.9.6. Recent Initiatives, Funding/VC Activities, and Technological Innovations
    10. 7.10. NVIDIA Corporation
      1. 7.10.1. Company Overview
      2. 7.10.2. Product/Service Portfolio
      3. 7.10.3. NVIDIA Corporation Sales, Revenue, and Gross Margin
      4. 7.10.4. NVIDIA Corporation Revenue and Growth Rate
      5. 7.10.5. NVIDIA Corporation Market Share
      6. 7.10.6. Recent Initiatives, Funding/VC Activities, and Technological Innovations
    11. 7.11. Intel Corporation
      1. 7.11.1. Company Overview
      2. 7.11.2. Product/Service Portfolio
      3. 7.11.3. Intel Corporation Sales, Revenue, and Gross Margin
      4. 7.11.4. Intel Corporation Revenue and Growth Rate
      5. 7.11.5. Intel Corporation Market Share
      6. 7.11.6. Recent Initiatives, Funding/VC Activities, and Technological Innovations
    12. 7.12. General Vision, Inc.
      1. 7.12.1. Company Overview
      2. 7.12.2. Product/Service Portfolio
      3. 7.12.3. General Vision, Inc. Sales, Revenue, and Gross Margin
      4. 7.12.4. General Vision, Inc. Revenue and Growth Rate
      5. 7.12.5. General Vision, Inc. Market Share
      6. 7.12.6. Recent Initiatives, Funding/VC Activities, and Technological Innovations
    13. 7.13. Siemens Healthineers AG
      1. 7.13.1. Company Overview
      2. 7.13.2. Product/Service Portfolio
      3. 7.13.3. Siemens Healthineers AG Sales, Revenue, and Gross Margin
      4. 7.13.4. Siemens Healthineers AG Revenue and Growth Rate
      5. 7.13.5. Siemens Healthineers AG Market Share
      6. 7.13.6. Recent Initiatives, Funding/VC Activities, and Technological Innovations
  8. Chapter 8 AI in HIV/AIDS — Industry Analysis
    1. 8.1. Introduction and Taxonomy
    2. 8.2. AI in HIV/AIDS Market – Key Trends
      1. 8.2.1. Market Drivers
      2. 8.2.2. Market Restraints
      3. 8.2.3. Market Opportunities
    3. 8.3. Value Chain Analysis
    4. 8.4. Key Mandates and Regulations
    5. 8.5. Technology Roadmap and Timeline
    6. 8.6. AI in HIV/AIDS Market – Attractiveness Analysis
      1. 8.6.1. By Tools
      2. 8.6.2. By Data
      3. 8.6.3. By Types of Algorithms
      4. 8.6.4. By Region
  9. Chapter 9 Industrial Chain, Sourcing Strategy, and Downstream Buyers
    1. 9.1. AI in HIV/AIDS Industrial Chain Analysis
    2. 9.2. Downstream Buyers
    3. 9.3. Distributors/Traders List
  10. Chapter 10 Marketing Strategy Analysis
    1. 10.1. Marketing Channel
    2. 10.2. Direct Marketing
    3. 10.3. Indirect Marketing
    4. 10.4. Marketing Channel Development Trends
    5. 10.5. Economic/Political Environmental Change
  11. Chapter 11 Report Conclusion & Key Insights
    1. 11.1. Key Insights from Primary Interviews & Surveys Respondents
    2. 11.2. Key Takeaways from Analysts, Consultants, and Industry Leaders
  12. Chapter 12 Research Approach & Methodology
    1. 12.1. Report Description
    2. 12.2. Research Scope
    3. 12.3. Research Methodology
      1. 12.3.1. Secondary Research
      2. 12.3.2. Primary Research
      3. 12.3.3. Statistical Models
        1. 12.3.3.1. Company Share Analysis Model
        2. 12.3.3.2. Revenue Based Modeling
      4. 12.3.4. Research Limitations

      List of Figures

      Fig.1	Product Picture of AI in HIV/AIDS
      Fig.2	Global AI in HIV/AIDS Market, 2016 – 2026 (USD Million)
      Fig.3	Global AI in HIV/AIDS Market Absolute Revenue Opportunity, 2016 – 2026 (USD Million)
      Fig.4	Global AI in HIV/AIDS Market Incremental Revenue Opportunity, 2020 – 2026 (USD Million)
      Fig.5	Global AI in HIV/AIDS Market Share, by Tools, 2020 & 2026 (USD Million)
      Fig.6	Global Machine Learning AI in HIV/AIDS Market, 2016 – 2026 (USD Million)
      Fig.7	Global Natural Language Processing AI in HIV/AIDS Market, 2016 – 2026 (USD Million)
      Fig.8	Global Image Processing AI in HIV/AIDS Market, 2016 – 2026 (USD Million)
      Fig.9	Global Speech Recognition AI in HIV/AIDS Market, 2016 – 2026 (USD Million)
      Fig.10	Global Others AI in HIV/AIDS Market, 2016 – 2026 (USD Million)
      Fig.11	Global AI in HIV/AIDS Market Share, by Data, 2020 & 2026 (USD Million)
      Fig.12	Global Patient Data AI in HIV/AIDS Market, 2016 – 2026 (USD Million)
      Fig.13	Global Insurance Information AI in HIV/AIDS Market, 2016 – 2026 (USD Million)
      Fig.14	Global Hospital Stays AI in HIV/AIDS Market, 2016 – 2026 (USD Million)
      Fig.15	Global AI in HIV/AIDS Market Share, by Types of Algorithms, 2020 & 2026 (USD Million)
      Fig.16	Global Artificial Neural Networks AI in HIV/AIDS Market, 2016 – 2026 (USD Million)
      Fig.17	Global Deep Learning AI in HIV/AIDS Market, 2016 – 2026 (USD Million)
      Fig.18	Global Others AI in HIV/AIDS Market, 2016 – 2026 (USD Million)
      Fig.19	Global AI in HIV/AIDS Market Share, by Region, 2020 & 2026 (USD Million)
      Fig.20	North America AI in HIV/AIDS Market, 2016 – 2026 (USD Million)
      Fig.21	U.S. AI in HIV/AIDS Market, 2016 – 2026 (USD Million)
      Fig.22	Canada AI in HIV/AIDS Market, 2016 – 2026 (USD Million)
      Fig.23	Europe AI in HIV/AIDS Market, 2016 – 2026 (USD Million)
      Fig.24	Germany AI in HIV/AIDS Market, 2016 – 2026 (USD Million)
      Fig.25	France AI in HIV/AIDS Market, 2016 – 2026 (USD Million)
      Fig.26	U.K. AI in HIV/AIDS Market, 2016 – 2026 (USD Million)
      Fig.27	Italy AI in HIV/AIDS Market, 2016 – 2026 (USD Million)
      Fig.28	Spain AI in HIV/AIDS Market, 2016 – 2026 (USD Million)
      Fig.29	Rest of Europe AI in HIV/AIDS Market, 2016 – 2026 (USD Million)
      Fig.30	Asia Pacific AI in HIV/AIDS Market, 2016 – 2026 (USD Million)
      Fig.31	China AI in HIV/AIDS Market, 2016 – 2026 (USD Million)
      Fig.32	Japan AI in HIV/AIDS Market, 2016 – 2026 (USD Million)
      Fig.33	India AI in HIV/AIDS Market, 2016 – 2026 (USD Million)
      Fig.34	South  Korea AI in HIV/AIDS Market, 2016 – 2026 (USD Million)
      Fig.35	South-East Asia AI in HIV/AIDS Market, 2016 – 2026 (USD Million)
      Fig.36	Rest of Asia Pacific AI in HIV/AIDS Market, 2016 – 2026 (USD Million)
      Fig.37	Latin America AI in HIV/AIDS Market, 2016 – 2026 (USD Million)
      Fig.38	Brazil AI in HIV/AIDS Market, 2016 – 2026 (USD Million)
      Fig.39	Mexico AI in HIV/AIDS Market, 2016 – 2026 (USD Million)
      Fig.40	Rest of Latin America AI in HIV/AIDS Market, 2016 – 2026 (USD Million)
      Fig.41	The Middle-East and Africa AI in HIV/AIDS Market, 2016 – 2026 (USD Million)
      Fig.42	GCC Countries AI in HIV/AIDS Market, 2016 – 2026 (USD Million)
      Fig.43	South Africa AI in HIV/AIDS Market, 2016 – 2026 (USD Million)
      Fig.44	Rest of Middle-East Africa AI in HIV/AIDS Market, 2016 – 2026 (USD Million)
      Fig.45	Competitor Market Share – Revenue
      Fig.46	Koninklijke Philips N.V. Revenue and Growth Rate
      Fig.47	Koninklijke Philips N.V. Market Share
      Fig.48	RDI Revenue and Growth Rate
      Fig.49	RDI Market Share
      Fig.50	Google Inc. Revenue and Growth Rate
      Fig.51	Google Inc. Market Share
      Fig.52	General Electric Healthcare Revenue and Growth Rate
      Fig.53	General Electric Healthcare Market Share
      Fig.54	IBM Revenue and Growth Rate
      Fig.55	IBM Market Share
      Fig.56	Microsoft Corporation Revenue and Growth Rate
      Fig.57	Microsoft Corporation Market Share
      Fig.58	Amazon Web Services Revenue and Growth Rate
      Fig.59	Amazon Web Services Market Share
      Fig.60	Medtronic plc Revenue and Growth Rate
      Fig.61	Medtronic plc Market Share
      Fig.62	Johnson & Johnson Services, Inc. Revenue and Growth Rate
      Fig.63	Johnson & Johnson Services, Inc. Market Share
      Fig.64	NVIDIA Corporation Revenue and Growth Rate
      Fig.65	NVIDIA Corporation Market Share
      Fig.66	Intel Corporation Revenue and Growth Rate
      Fig.67	Intel Corporation Market Share
      Fig.68	General Vision, Inc. Revenue and Growth Rate
      Fig.69	General Vision, Inc. Market Share
      Fig.70	Siemens Healthineers AG Revenue and Growth Rate
      Fig.71	Siemens Healthineers AG Market Share
      Fig.72	Market Dynamics
      Fig.73	Global AI in HIV/AIDS – Value Chain Analysis
      Fig.74	Key Mandates and Regulations
      Fig.75	Technology Roadmap and Timeline
      Fig.76	Market Attractiveness Analysis – By Tools
      Fig.77	Market Attractiveness Analysis – By Data
      Fig.78	Market Attractiveness Analysis – By Types of Algorithms
      Fig.79	Market Attractiveness Analysis – By Region
      Fig.80	AI in HIV/AIDS Industrial Chain Analysis
      Fig.81	Market Channels
      Fig.82	Marketing Channel Development Trend
      Fig.83	Growth in World Gross Product, 2008-2018
      

      List of Tables

      Table 1	Global AI in HIV/AIDS Market, 2020 & 2026 (USD Million)
      Table 2	Global AI in HIV/AIDS Market, by Tools, 2016 – 2026 (USD Million)
      Table 3	Global AI in HIV/AIDS Market, by Data, 2016 – 2026 (USD Million)
      Table 4	Global AI in HIV/AIDS Market, by Types of Algorithms, 2016 – 2026 (USD Million)
      Table 5	Global AI in HIV/AIDS Market, by Region, 2016 – 2026 (USD Million)
      Table 6	North America AI in HIV/AIDS Market, by Country, 2016 – 2026 (USD Million)
      Table 7	North America AI in HIV/AIDS Market, by Tools, 2016 – 2026 (USD Million)
      Table 8	North America AI in HIV/AIDS Market, by Data, 2016 – 2026 (USD Million)
      Table 9	North America AI in HIV/AIDS Market, by Types of Algorithms, 2016 – 2026 (USD Million)
      Table 10 Europe AI in HIV/AIDS Market, by Country, 2016 – 2026 (USD Million)
      Table 11 Europe AI in HIV/AIDS Market, by Tools, 2016 – 2026 (USD Million)
      Table 12 Europe AI in HIV/AIDS Market, by Data, 2016 – 2026 (USD Million)
      Table 13 Europe AI in HIV/AIDS Market, by Types of Algorithms, 2016 – 2026 (USD Million)
      Table 14 Asia Pacific AI in HIV/AIDS Market, by Country, 2016 – 2026 (USD Million)
      Table 15 Asia Pacific AI in HIV/AIDS Market, by Tools, 2016 – 2026 (USD Million)
      Table 16 Asia Pacific AI in HIV/AIDS Market, by Data, 2016 – 2026 (USD Million)
      Table 17 Asia Pacific AI in HIV/AIDS Market, by Types of Algorithms, 2016 – 2026 (USD Million)
      Table 18 Latin America AI in HIV/AIDS Market, by Country, 2016 – 2026 (USD Million)
      Table 19 Latin America AI in HIV/AIDS Market, by Tools, 2016 – 2026 (USD Million)
      Table 20 Latin America AI in HIV/AIDS Market, by Data, 2016 – 2026 (USD Million)
      Table 21 Latin America AI in HIV/AIDS Market, by Types of Algorithms, 2016 – 2026 (USD Million)
      Table 22 The Middle-East and Africa AI in HIV/AIDS Market, by Country, 2016 – 2026 (USD Million)
      Table 23 The Middle-East and Africa AI in HIV/AIDS Market, by Tools, 2016 – 2026 (USD Million)
      Table 24 The Middle-East and Africa AI in HIV/AIDS Market, by Data, 2016 – 2026 (USD Million)
      Table 25 The Middle-East and Africa AI in HIV/AIDS Market, by Types of Algorithms, 2016 – 2026 (USD Million)
      Table 26 Global AI in HIV/AIDS Market - Company Revenue Analysis, 2016 – 2019 (USD Million)
      Table 27 Global AI in HIV/AIDS Market - Company Revenue Share Analysis, 2016 – 2019 (%)
      Table 28 Acquisitions and Mergers
      Table 29 Market Drivers – Impact Analysis
      Table 30 Market Restraints
      Table 31 Market Opportunities
      Table 32 Major Buyers of AI in HIV/AIDS
      Table 33 Distributors/Traders of AI in HIV/AIDS by Region
      

Industry Major Market Players

  • Koninklijke Philips N.V.
  • RDI
  • Google Inc.
  • General Electric Healthcare
  • IBM
  • Microsoft Corporation
  • Amazon Web Services
  • Medtronic plc
  • Johnson & Johnson Services Inc.
  • NVIDIA Corporation
  • Intel Corporation
  • General Vision Inc.
  • Siemens Healthineers AG