Search Market Research Report

Discover Our Latest Reports
Discover Our Featured Reports
Discover Top Selling Reports

Agriculture Testing Service Providers Market Size, Share Global Analysis Report, , 2021 – 2026

report img

Agriculture Testing Service Providers Market By Service Type, (Soil Testing Service, Seed Testing Service, Water Testing Service, Fertilizer Testing Service, Others), By Analysis (Physical Analysis, Chemical Analysis), By Application (Safety testing, Quality assurance), By Technology (Conventional, Rapid), By End User (Farmers, Agriculture Consultant, Fertilizers Manufacturers, Research Bodies, Others): Global Industry Perspective, Comprehensive Analysis, and Forecast, 2021 – 2026

Industry Insights

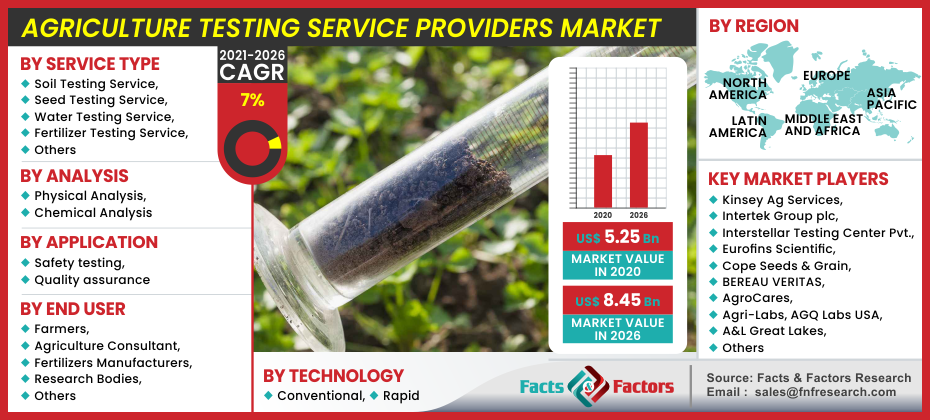
[187+ Pages Report] As per the Facts and Factors report, the global agriculture testing service providers market is expected to be around USD 5.25 Billion in 2020, with revenues expected to reach around USD 8.45 Billion by the end of 2026, increasing at a CAGR of around 7% from 2021 to 2026.

logoMarket Overview

Agricultural testing services are specified to measure the content and consistency of the contaminant by testing various samples including soil, water, crop, etc. Agricultural test services help to examine the appropriate input and tools for optimal plant development. Measurement of the impurity level also allows measuring, for example, the pH or acidity level of the given sample, configuration, and other features. The soil test helps decide the degree of fertility and the trace components of a given type of soil. Agricultural research can be a benefit for the commercialized farming and agriculture community.

logoIndustry Growth Factor

In developing and marketing regions the demand for agriculture testing services is a highly growing industry. It is becoming famous. In commercialized agriculture countries, agricultural testing services have been popular to continue the export expansion of agricultural goods. However, growing demand for agricultural testing services is expected to boost growth prospects on the market for agricultural testing services in developing countries like China, India, and Brazil. One of the prominent drivers for development on the market of agricultural testing services has been stringent agricultural production and environmental protection regulations.

Agriculture Testing Service Providers Market

To know more about this report | Request Free Sample Copy

To ensure that crops produced for commercial use by genetic modification are carefully investigated and reviewed to make sure that no substantial harm does exist for the atmosphere or consumers, the US Department of Agriculture (USDA), the Food and drug management (FDA), and the Environmental Protection Agency (EPA).

In developing and commercialized areas, the agricultural testing industry is a highly growing field. It is very common. Environmental protection and agricultural productivity regulations and legalization have been the main drivers of demand development in this sophisticated segment. The export development of agricultural commodities is being maintained by sample testing in commercialized agricultural countries. The growing uncertainties in the supply chain as well as the absence of good agricultural practices in the supply chain, and the absence of proper hygienic and sanitary procedures, have led to the instances of pollution of both humans and livestock at the outset of the supply chain. This has led to serious problems for farmers, farmers, end-users, regulators, and the other players of the sector.

logoGlobal Agriculture Testing Service Providers Market: Segmentation

Based on service type the market is segmented into water testing service, soil testing service, seed testing service, fertilizer testing service, and others. Based on the analysis the market is further segmented into physical analysis and chemical analysis. Additionally, based on application market is further segmented into safety testing and quality assurance. Based on technology market is sub-segmented into conventional, and rapid. Moreover, based on the end-user market is sub-segmented into research bodies, fertilizers manufacturers, farmers, agriculture consultants, others.

logoGlobal Agriculture Testing Service Providers Market: Regional Analysis

Based on regions, the global agriculture testing service providers market can be divided into five main regions.

On the basis of geography, Europe is expected to have a large market share. Countries like France, Germany, and Italy in European countries have a vast number of agricultural areas and greenhouses that are driving the development of the demand for agricultural testing. In addition, except for the Asia Pacific in Japan, the agricultural testing facilities are expected to be growing as healthier and nutritious foods are consumed increasingly, requiring crop testing at the proper level. The growth rate in agricultural testing services in the Middle East and Africa is modest due to increased spending in agriculture by the Government.

The rise of agricultural automation and testing facilities has been seen by countries in North America, such as the US and Canada. Agricultural testing facilities are massively adopted in these regions to improve nutritious food output and boost the development of agricultural goods. Therefore, the demand for agricultural testing services is expected to be experiencing sustained growth in North America over the projected period.

logoReport Scope

Report Attribute

Details

Market Size in 2020

5.25 Billion

Projected Market Size in 2026

USD 8.45 Billion

CAGR Growth Rate

7% CAGR

Base Year

2019

Forecast Years

2020-2026

Key Market Players

Kinsey Ag Services, Intertek Group plc, Interstellar Testing Center Pvt., Eurofins Scientific, Cope Seeds & Grain, BEREAU VERITAS, AgroCares, Agri-Labs, AGQ Labs USA, A&L Great Lakes, SGS SA, Pramukh Laboratory, Polytest Laboratories, OMIC USA Inc., NRM Laboratories, National Agro Foundation, Logan Labs, Lilaba Analytical Laboratories, and Waters Agricultural Laboratories.

Key Segment

By Service Type, By Analysis, By Application, By Technology, By End User, By Region

Major Regions Covered

North America, Europe, Asia Pacific, Latin America, and the Middle East & Africa

Purchase Options

Request customized purchase options to meet your research needs. Explore purchase options

logoGlobal Agriculture Testing Service Providers Market: Competitive Players

Some of the key players in the agriculture testing service providers market are:

  • Kinsey Ag Services
  • Intertek Group plc
  • Interstellar Testing Center Pvt.
  • Eurofins Scientific
  • Cope Seeds & Grain
  • BEREAU VERITAS
  • AgroCares
  • Agri-Labs
  • AGQ Labs USA
  • A&L Great Lakes
  • SGS SA
  • Pramukh Laboratory
  • Polytest Laboratories
  • OMIC USA Inc.
  • NRM Laboratories
  • National Agro Foundation
  • Logan Labs
  • Lilaba Analytical Laboratories
  • Waters Agricultural Laboratories

logoGlobal Agriculture Testing Service Providers Market: Regional Segment Analysis

  • North America
    • U.S.
    • Canada
  • Europe
    • U.K.
    • France
    • Germany
  • The Asia Pacific
    • China
    • Japan
    • India
  • Latin America
    • Brazil
    • Mexico
  • The Middle East and Africa

Table of Content

  1. Chapter 1 Executive Summary
    1. 1.1. Introduction of Agriculture Testing Service Providers
    2. 1.2. Global Agriculture Testing Service Providers Market, 2020 & 2026 (USD Billion)
    3. 1.3. COVID-19 Impacts on Agriculture Testing Service Providers Market
      1. 1.3.1. Short Term COVID-19 Impact on the Market
      2. 1.3.2. Mid-Term COVID-19 Impact on the Market
      3. 1.3.3. Long-Term COVID-19 Impact on the Market
    4. 1.4. Business Strategies and Recommendations
    5. 1.3. Global Agriculture Testing Service Providers Market, 2016 – 2026 (USD Billion)
    6. 1.4. Global Agriculture Testing Service Providers Market Absolute Revenue Opportunity, 2016 – 2026 (USD Billion)
    7. 1.5. Global Agriculture Testing Service Providers Market Incremental Revenue Opportunity, 2020 – 2026 (USD Billion)
  2. Chapter 2 Agriculture Testing Service Providers Market – Service Type Analysis
    1. 2.1. Global Agriculture Testing Service Providers Market – Service Type Overview
    2. 2.2. Global Agriculture Testing Service Providers Market Share, by Service Type, 2020 & 2026 (USD Billion)
    3. 2.3. Soil Testing Service
      1. 2.3.1. Global Soil Testing Service Agriculture Testing Service Providers Market, 2016 – 2026 (USD Billion)
    4. 2.4. Seed Testing Service
      1. 2.4.1. Global Seed Testing Service Agriculture Testing Service Providers Market, 2016 – 2026 (USD Billion)
    5. 2.5. Water Testing Service
      1. 2.5.1. Global Water Testing Service Agriculture Testing Service Providers Market, 2016 – 2026 (USD Billion)
    6. 2.6. Fertilizer Testing Service
      1. 2.6.1. Global Fertilizer Testing Service Agriculture Testing Service Providers Market, 2016 – 2026 (USD Billion)
    7. 2.7. Others
      1. 2.7.1. Global Others Agriculture Testing Service Providers Market, 2016 – 2026 (USD Billion)
  3. Chapter 3 Agriculture Testing Service Providers Market – Analysis
    1. 3.1. Global Agriculture Testing Service Providers Market – Analysis Overview
    2. 3.2. Global Agriculture Testing Service Providers Market Share, by Analysis, 2020 & 2026 (USD Billion)
    3. 3.3. Physical Analysis
      1. 3.3.1. Global Physical Analysis Agriculture Testing Service Providers Market, 2016 – 2026 (USD Billion)
    4. 3.4. Chemical Analysis
      1. 3.4.1. Global Chemical Analysis Agriculture Testing Service Providers Market, 2016 – 2026 (USD Billion)
  4. Chapter 4 Agriculture Testing Service Providers Market – Application Analysis
    1. 4.1. Global Agriculture Testing Service Providers Market – Application Overview
    2. 4.2. Global Agriculture Testing Service Providers Market Share, by Application, 2020 & 2026 (USD Billion)
    3. 4.3. Safety testing
      1. 4.3.1. Global Safety testing Agriculture Testing Service Providers Market, 2016 – 2026 (USD Billion)
    4. 4.4. Quality assurance
      1. 4.4.1. Global Quality assurance Agriculture Testing Service Providers Market, 2016 – 2026 (USD Billion)
  5. Chapter 5 Agriculture Testing Service Providers Market – Technology Analysis
    1. 5.1. Global Agriculture Testing Service Providers Market – Technology Overview
    2. 5.2. Global Agriculture Testing Service Providers Market Share, by Technology, 2020 & 2026 (USD Billion)
    3. 5.3. Conventional
      1. 5.3.1. Global Conventional Agriculture Testing Service Providers Market, 2016 – 2026 (USD Billion)
    4. 5.4. Rapid
      1. 5.4.1. Global Rapid Agriculture Testing Service Providers Market, 2016 – 2026 (USD Billion)
  6. Chapter 6 Agriculture Testing Service Providers Market – End User Analysis
    1. 6.1. Global Agriculture Testing Service Providers Market – End User Overview
    2. 6.2. Global Agriculture Testing Service Providers Market Share, by End User, 2020 & 2026 (USD Billion)
    3. 6.3. Farmers
      1. 6.3.1. Global Farmers Agriculture Testing Service Providers Market, 2016 – 2026 (USD Billion)
    4. 6.4. Agriculture Consultant
      1. 6.4.1. Global Agriculture Consultant Agriculture Testing Service Providers Market, 2016 – 2026 (USD Billion)
    5. 6.5. Fertilizers Manufacturers
      1. 6.5.1. Global Fertilizers Manufacturers Agriculture Testing Service Providers Market, 2016 – 2026 (USD Billion)
    6. 6.6. Research Bodies
      1. 6.6.1. Global Research Bodies Agriculture Testing Service Providers Market, 2016 – 2026 (USD Billion)
    7. 6.7. Others
      1. 6.7.1. Global Others Agriculture Testing Service Providers Market, 2016 – 2026 (USD Billion)
  7. Chapter 7 Agriculture Testing Service Providers Market – Regional Analysis
    1. 7.1. Global Agriculture Testing Service Providers Market Regional Overview
    2. 7.2. Global Agriculture Testing Service Providers Market Share, by Region, 2020 & 2026 (USD Billion)
    3. 7.3. North America
      1. 7.3.1. North America Agriculture Testing Service Providers Market, 2016 – 2026 (USD Billion)
        1. 7.3.1.1. North America Agriculture Testing Service Providers Market, by Country, 2016 - 2026 (USD Billion)
      2. 7.3.2. North America Agriculture Testing Service Providers Market, by Service Type, 2016 – 2026
        1. 7.3.2.1. North America Agriculture Testing Service Providers Market, by Service Type, 2016 – 2026 (USD Billion)
      3. 7.3.3. North America Agriculture Testing Service Providers Market, by Analysis, 2016 – 2026
        1. 7.3.3.1. North America Agriculture Testing Service Providers Market, by Analysis, 2016 – 2026 (USD Billion)
      4. 7.3.4. North America Agriculture Testing Service Providers Market, by Application, 2016 – 2026
        1. 7.3.4.1. North America Agriculture Testing Service Providers Market, by Application, 2016 – 2026 (USD Billion)
      5. 7.3.5. North America Agriculture Testing Service Providers Market, by Technology, 2016 – 2026
        1. 7.3.5.1. North America Agriculture Testing Service Providers Market, by Technology, 2016 – 2026 (USD Billion)
      6. 7.3.6. North America Agriculture Testing Service Providers Market, by End User, 2016 – 2026
        1. 7.3.6.1. North America Agriculture Testing Service Providers Market, by End User, 2016 – 2026 (USD Billion)
      7. 7.3.7. U.S.
        1. 7.3.7.1. U.S. Agriculture Testing Service Providers Market, 2016 – 2026 (USD Billion)
      8. 7.3.8. Canada
        1. 7.3.8.1. Canada Agriculture Testing Service Providers Market, 2016 – 2026 (USD Billion)
    4. 7.4. Europe
      1. 7.4.1. Europe Agriculture Testing Service Providers Market, 2016 – 2026 (USD Billion)
        1. 7.4.1.1. Europe Agriculture Testing Service Providers Market, by Country, 2016 - 2026 (USD Billion)
      2. 7.4.2. Europe Agriculture Testing Service Providers Market, by Service Type, 2016 – 2026
        1. 7.4.2.1. Europe Agriculture Testing Service Providers Market, by Service Type, 2016 – 2026 (USD Billion)
      3. 7.4.3. Europe Agriculture Testing Service Providers Market, by Analysis, 2016 – 2026
        1. 7.4.3.1. Europe Agriculture Testing Service Providers Market, by Analysis, 2016 – 2026 (USD Billion)
      4. 7.4.4. Europe Agriculture Testing Service Providers Market, by Application, 2016 – 2026
        1. 7.4.4.1. Europe Agriculture Testing Service Providers Market, by Application, 2016 – 2026 (USD Billion)
      5. 7.4.5. Europe Agriculture Testing Service Providers Market, by Technology, 2016 – 2026
        1. 7.4.5.1. Europe Agriculture Testing Service Providers Market, by Technology, 2016 – 2026 (USD Billion)
      6. 7.4.6. Europe Agriculture Testing Service Providers Market, by End User, 2016 – 2026
        1. 7.4.6.1. Europe Agriculture Testing Service Providers Market, by End User, 2016 – 2026 (USD Billion)
      7. 7.4.7. Germany
        1. 7.4.7.1. Germany Agriculture Testing Service Providers Market, 2016 – 2026 (USD Billion)
      8. 7.4.8. France
        1. 7.4.8.1. France Agriculture Testing Service Providers Market, 2016 – 2026 (USD Billion)
      9. 7.4.9. U.K.
        1. 7.4.9.1. U.K. Agriculture Testing Service Providers Market, 2016 – 2026 (USD Billion)
      10. 7.4.10. Italy
        1. 7.4.10.1. Italy Agriculture Testing Service Providers Market, 2016 – 2026 (USD Billion)
      11. 7.4.11. Spain
        1. 7.4.11.1. Spain Agriculture Testing Service Providers Market, 2016 – 2026 (USD Billion)
      12. 7.4.12. Rest of Europe
        1. 7.4.12.1. Rest of Europe Agriculture Testing Service Providers Market, 2016 – 2026 (USD Billion)
    5. 7.5. Asia Pacific
      1. 7.5.1. Asia Pacific Agriculture Testing Service Providers Market, 2016 – 2026 (USD Billion)
        1. 7.5.1.1. Asia Pacific Agriculture Testing Service Providers Market, by Country, 2016 - 2026 (USD Billion)
      2. 7.5.2. Asia Pacific Agriculture Testing Service Providers Market, by Service Type, 2016 – 2026
        1. 7.5.2.1. Asia Pacific Agriculture Testing Service Providers Market, by Service Type, 2016 – 2026 (USD Billion)
      3. 7.5.3. Asia Pacific Agriculture Testing Service Providers Market, by Analysis, 2016 – 2026
        1. 7.5.3.1. Asia Pacific Agriculture Testing Service Providers Market, by Analysis, 2016 – 2026 (USD Billion)
      4. 7.5.4. Asia Pacific Agriculture Testing Service Providers Market, by Application, 2016 – 2026
        1. 7.5.4.1. Asia Pacific Agriculture Testing Service Providers Market, by Application, 2016 – 2026 (USD Billion)
      5. 7.5.5. Asia Pacific Agriculture Testing Service Providers Market, by Technology, 2016 – 2026
        1. 7.5.5.1. Asia Pacific Agriculture Testing Service Providers Market, by Technology, 2016 – 2026 (USD Billion)
      6. 7.5.6. Asia Pacific Agriculture Testing Service Providers Market, by End User, 2016 – 2026
        1. 7.5.6.1. Asia Pacific Agriculture Testing Service Providers Market, by End User, 2016 – 2026 (USD Billion)
      7. 7.5.7. China
        1. 7.5.7.1. China Agriculture Testing Service Providers Market, 2016 – 2026 (USD Billion)
      8. 7.5.8. Japan
        1. 7.5.8.1. Japan Agriculture Testing Service Providers Market, 2016 – 2026 (USD Billion)
      9. 7.5.9. India
        1. 7.5.9.1. India Agriculture Testing Service Providers Market, 2016 – 2026 (USD Billion)
      10. 7.5.10. South Korea
        1. 7.5.10.1. South Korea Agriculture Testing Service Providers Market, 2016 – 2026 (USD Billion)
      11. 7.5.11. South-East Asia
        1. 7.5.11.1. South-East Asia Agriculture Testing Service Providers Market, 2016 – 2026 (USD Billion)
      12. 7.5.12. Rest of Asia Pacific
        1. 7.5.12.1. Rest of Asia Pacific Agriculture Testing Service Providers Market, 2016 – 2026 (USD Billion)
    6. 7.6. Latin America
      1. 7.6.1. Latin America Agriculture Testing Service Providers Market, 2016 – 2026 (USD Billion)
        1. 7.6.1.1. Latin America Agriculture Testing Service Providers Market, by Country, 2016 - 2026 (USD Billion)
      2. 7.6.2. Latin America Agriculture Testing Service Providers Market, by Service Type, 2016 – 2026
        1. 7.6.2.1. Latin America Agriculture Testing Service Providers Market, by Service Type, 2016 – 2026 (USD Billion)
      3. 7.6.3. Latin America Agriculture Testing Service Providers Market, by Analysis, 2016 – 2026
        1. 7.6.3.1. Latin America Agriculture Testing Service Providers Market, by Analysis, 2016 – 2026 (USD Billion)
      4. 7.6.4. Latin America Agriculture Testing Service Providers Market, by Application, 2016 – 2026
        1. 7.6.4.1. Latin America Agriculture Testing Service Providers Market, by Application, 2016 – 2026 (USD Billion)
      5. 7.6.5. Latin America Agriculture Testing Service Providers Market, by Technology, 2016 – 2026
        1. 7.6.5.1. Latin America Agriculture Testing Service Providers Market, by Technology, 2016 – 2026 (USD Billion)
      6. 7.6.6. Latin America Agriculture Testing Service Providers Market, by End User, 2016 – 2026
        1. 7.6.6.1. Latin America Agriculture Testing Service Providers Market, by End User, 2016 – 2026 (USD Billion)
      7. 7.6.7. Brazil
        1. 7.6.7.1. Brazil Agriculture Testing Service Providers Market, 2016 – 2026 (USD Billion)
      8. 7.6.8. Mexico
        1. 7.6.8.1. Mexico Agriculture Testing Service Providers Market, 2016 – 2026 (USD Billion)
      9. 7.6.9. Rest of Latin America
        1. 7.6.9.1. Rest of Latin America Agriculture Testing Service Providers Market, 2016 – 2026 (USD Billion)
    7. 7.7. The Middle-East and Africa
      1. 7.7.1. The Middle-East and Africa Agriculture Testing Service Providers Market, 2016 – 2026 (USD Billion)
        1. 7.7.1.1. The Middle-East and Africa Agriculture Testing Service Providers Market, by Country, 2016 - 2026 (USD Billion)
      2. 7.7.2. The Middle-East and Africa Agriculture Testing Service Providers Market, by Service Type, 2016 – 2026
        1. 7.7.2.1. The Middle-East and Africa Agriculture Testing Service Providers Market, by Service Type, 2016 – 2026 (USD Billion)
      3. 7.7.3. The Middle-East and Africa Agriculture Testing Service Providers Market, by Analysis, 2016 – 2026
        1. 7.7.3.1. The Middle-East and Africa Agriculture Testing Service Providers Market, by Analysis, 2016 – 2026 (USD Billion)
      4. 7.7.4. The Middle-East and Africa Agriculture Testing Service Providers Market, by Application, 2016 – 2026
        1. 7.7.4.1. The Middle-East and Africa Agriculture Testing Service Providers Market, by Application, 2016 – 2026 (USD Billion)
      5. 7.7.5. The Middle-East and Africa Agriculture Testing Service Providers Market, by Technology, 2016 – 2026
        1. 7.7.5.1. The Middle-East and Africa Agriculture Testing Service Providers Market, by Technology, 2016 – 2026 (USD Billion)
      6. 7.7.6. The Middle-East and Africa Agriculture Testing Service Providers Market, by End User, 2016 – 2026
        1. 7.7.6.1. The Middle-East and Africa Agriculture Testing Service Providers Market, by End User, 2016 – 2026 (USD Billion)
      7. 7.7.7. GCC Countries
        1. 7.7.7.1. GCC Countries Agriculture Testing Service Providers Market, 2016 – 2026 (USD Billion)
      8. 7.7.8. South Africa
        1. 7.7.8.1. South Africa Agriculture Testing Service Providers Market, 2016 – 2026 (USD Billion)
      9. 7.7.9. Rest of Middle-East Africa
        1. 7.7.9.1. Rest of Middle-East Africa Agriculture Testing Service Providers Market, 2016 – 2026 (USD Billion)
  8. Chapter 8 Agriculture Testing Service Providers Market – Competitive Landscape
    1. 8.1. Competitor Market Share – Revenue
    2. 8.2. Market Concentration Rate Analysis, Top 3 and Top 5 Players
    3. 8.3. Strategic Developments
      1. 8.3.1. Acquisitions and Mergers
      2. 8.3.2. New Products
      3. 8.3.3. Research & Development Activities
  9. Chapter 9 Company Profiles
    1. 9.1. Kinsey Ag Services
      1. 9.1.1. Company Overview
      2. 9.1.2. Product/Service Portfolio
      3. 9.1.3. Kinsey Ag Services Sales, Revenue, and Gross Margin
      4. 9.1.4. Kinsey Ag Services Revenue and Growth Rate
      5. 9.1.5. Kinsey Ag Services Market Share
      6. 9.1.6. Recent Initiatives, Funding/VC Activities, and Technological Innovations
    2. 9.2. Intertek Group plc
      1. 9.2.1. Company Overview
      2. 9.2.2. Product/Service Portfolio
      3. 9.2.3. Intertek Group plc Sales, Revenue, and Gross Margin
      4. 9.2.4. Intertek Group plc Revenue and Growth Rate
      5. 9.2.5. Intertek Group plc Market Share
      6. 9.2.6. Recent Initiatives, Funding/VC Activities, and Technological Innovations
    3. 9.3. Interstellar Testing Center Pvt.
      1. 9.3.1. Company Overview
      2. 9.3.2. Product/Service Portfolio
      3. 9.3.3. Interstellar Testing Center Pvt. Sales, Revenue, and Gross Margin
      4. 9.3.4. Interstellar Testing Center Pvt. Revenue and Growth Rate
      5. 9.3.5. Interstellar Testing Center Pvt. Market Share
      6. 9.3.6. Recent Initiatives, Funding/VC Activities, and Technological Innovations
    4. 9.4. Eurofins Scientific
      1. 9.4.1. Company Overview
      2. 9.4.2. Product/Service Portfolio
      3. 9.4.3. Eurofins Scientific Sales, Revenue, and Gross Margin
      4. 9.4.4. Eurofins Scientific Revenue and Growth Rate
      5. 9.4.5. Eurofins Scientific Market Share
      6. 9.4.6. Recent Initiatives, Funding/VC Activities, and Technological Innovations
    5. 9.5. Cope Seeds & Grain
      1. 9.5.1. Company Overview
      2. 9.5.2. Product/Service Portfolio
      3. 9.5.3. Cope Seeds & Grain Sales, Revenue, and Gross Margin
      4. 9.5.4. Cope Seeds & Grain Revenue and Growth Rate
      5. 9.5.5. Cope Seeds & Grain Market Share
      6. 9.5.6. Recent Initiatives, Funding/VC Activities, and Technological Innovations
    6. 9.6. BEREAU VERITAS
      1. 9.6.1. Company Overview
      2. 9.6.2. Product/Service Portfolio
      3. 9.6.3. BEREAU VERITAS Sales, Revenue, and Gross Margin
      4. 9.6.4. BEREAU VERITAS Revenue and Growth Rate
      5. 9.6.5. BEREAU VERITAS Market Share
      6. 9.6.6. Recent Initiatives, Funding/VC Activities, and Technological Innovations
    7. 9.7. AgroCares
      1. 9.7.1. Company Overview
      2. 9.7.2. Product/Service Portfolio
      3. 9.7.3. AgroCares Sales, Revenue, and Gross Margin
      4. 9.7.4. AgroCares Revenue and Growth Rate
      5. 9.7.5. AgroCares Market Share
      6. 9.7.6. Recent Initiatives, Funding/VC Activities, and Technological Innovations
    8. 9.8. Agri-Labs
      1. 9.8.1. Company Overview
      2. 9.8.2. Product/Service Portfolio
      3. 9.8.3. Agri-Labs Sales, Revenue, and Gross Margin
      4. 9.8.4. Agri-Labs Revenue and Growth Rate
      5. 9.8.5. Agri-Labs Market Share
      6. 9.8.6. Recent Initiatives, Funding/VC Activities, and Technological Innovations
    9. 9.9. AGQ Labs USA
      1. 9.9.1. Company Overview
      2. 9.9.2. Product/Service Portfolio
      3. 9.9.3. AGQ Labs USA Sales, Revenue, and Gross Margin
      4. 9.9.4. AGQ Labs USA Revenue and Growth Rate
      5. 9.9.5. AGQ Labs USA Market Share
      6. 9.9.6. Recent Initiatives, Funding/VC Activities, and Technological Innovations
    10. 9.10. A&L Great Lakes
      1. 9.10.1. Company Overview
      2. 9.10.2. Product/Service Portfolio
      3. 9.10.3. A&L Great Lakes Sales, Revenue, and Gross Margin
      4. 9.10.4. A&L Great Lakes Revenue and Growth Rate
      5. 9.10.5. A&L Great Lakes Market Share
      6. 9.10.6. Recent Initiatives, Funding/VC Activities, and Technological Innovations
    11. 9.11. SGS SA
      1. 9.11.1. Company Overview
      2. 9.11.2. Product/Service Portfolio
      3. 9.11.3. SGS SA Sales, Revenue, and Gross Margin
      4. 9.11.4. SGS SA Revenue and Growth Rate
      5. 9.11.5. SGS SA Market Share
      6. 9.11.6. Recent Initiatives, Funding/VC Activities, and Technological Innovations
    12. 9.12. Pramukh Laboratory
      1. 9.12.1. Company Overview
      2. 9.12.2. Product/Service Portfolio
      3. 9.12.3. Pramukh Laboratory Sales, Revenue, and Gross Margin
      4. 9.12.4. Pramukh Laboratory Revenue and Growth Rate
      5. 9.12.5. Pramukh Laboratory Market Share
      6. 9.12.6. Recent Initiatives, Funding/VC Activities, and Technological Innovations
    13. 9.13. Polytest Laboratories
      1. 9.13.1. Company Overview
      2. 9.13.2. Product/Service Portfolio
      3. 9.13.3. Polytest Laboratories Sales, Revenue, and Gross Margin
      4. 9.13.4. Polytest Laboratories Revenue and Growth Rate
      5. 9.13.5. Polytest Laboratories Market Share
      6. 9.13.6. Recent Initiatives, Funding/VC Activities, and Technological Innovations
    14. 9.14. OMIC USA Inc.
      1. 9.14.1. Company Overview
      2. 9.14.2. Product/Service Portfolio
      3. 9.14.3. OMIC USA Inc. Sales, Revenue, and Gross Margin
      4. 9.14.4. OMIC USA Inc. Revenue and Growth Rate
      5. 9.14.5. OMIC USA Inc. Market Share
      6. 9.14.6. Recent Initiatives, Funding/VC Activities, and Technological Innovations
    15. 9.15. NRM Laboratories
      1. 9.15.1. Company Overview
      2. 9.15.2. Product/Service Portfolio
      3. 9.15.3. NRM Laboratories Sales, Revenue, and Gross Margin
      4. 9.15.4. NRM Laboratories Revenue and Growth Rate
      5. 9.15.5. NRM Laboratories Market Share
      6. 9.15.6. Recent Initiatives, Funding/VC Activities, and Technological Innovations
    16. 9.16. National Agro Foundation
      1. 9.16.1. Company Overview
      2. 9.16.2. Product/Service Portfolio
      3. 9.16.3. National Agro Foundation Sales, Revenue, and Gross Margin
      4. 9.16.4. National Agro Foundation Revenue and Growth Rate
      5. 9.16.5. National Agro Foundation Market Share
      6. 9.16.6. Recent Initiatives, Funding/VC Activities, and Technological Innovations
    17. 9.17. Logan Labs
      1. 9.17.1. Company Overview
      2. 9.17.2. Product/Service Portfolio
      3. 9.17.3. Logan Labs Sales, Revenue, and Gross Margin
      4. 9.17.4. Logan Labs Revenue and Growth Rate
      5. 9.17.5. Logan Labs Market Share
      6. 9.17.6. Recent Initiatives, Funding/VC Activities, and Technological Innovations
    18. 9.18. Lilaba Analytical Laboratories
      1. 9.18.1. Company Overview
      2. 9.18.2. Product/Service Portfolio
      3. 9.18.3. Lilaba Analytical Laboratories Sales, Revenue, and Gross Margin
      4. 9.18.4. Lilaba Analytical Laboratories Revenue and Growth Rate
      5. 9.18.5. Lilaba Analytical Laboratories Market Share
      6. 9.18.6. Recent Initiatives, Funding/VC Activities, and Technological Innovations
    19. 9.19. Waters Agricultural Laboratories
      1. 9.19.1. Company Overview
      2. 9.19.2. Product/Service Portfolio
      3. 9.19.3. Waters Agricultural Laboratories Sales, Revenue, and Gross Margin
      4. 9.19.4. Waters Agricultural Laboratories Revenue and Growth Rate
      5. 9.19.5. Waters Agricultural Laboratories Market Share
      6. 9.19.6. Recent Initiatives, Funding/VC Activities, and Technological Innovations
  10. Chapter 10 Agriculture Testing Service Providers — Industry Analysis
    1. 10.1. Introduction and Taxonomy
    2. 10.2. Agriculture Testing Service Providers Market – Key Trends
      1. 10.2.1. Market Drivers
      2. 10.2.2. Market Restraints
      3. 10.2.3. Market Opportunities
    3. 10.3. Value Chain Analysis
    4. 10.4. Key Mandates and Regulations
    5. 10.5. Technology Roadmap and Timeline
    6. 10.6. Agriculture Testing Service Providers Market – Attractiveness Analysis
      1. 10.6.1. By Service Type
      2. 10.6.2. By Analysis
      3. 10.6.3. By Application
      4. 10.6.4. By Technology
      5. 10.6.5. By End User
      6. 10.6.6. By Region
  11. Chapter 11 Industrial Chain, Sourcing Strategy, and Downstream Buyers
    1. 11.1. Agriculture Testing Service Providers Industrial Chain Analysis
    2. 11.2. Downstream Buyers
    3. 11.3. Distributors/Traders List
  12. Chapter 12 Marketing Strategy Analysis
    1. 12.1. Marketing Channel
    2. 12.2. Direct Marketing
    3. 12.3. Indirect Marketing
    4. 12.4. Marketing Channel Development Trends
    5. 12.5. Economic/Political Environmental Change
  13. Chapter 13 Report Conclusion & Key Insights
    1. 13.1. Key Insights from Primary Interviews & Surveys Respondents
    2. 13.2. Key Takeaways from Analysts, Consultants, and Industry Leaders
  14. Chapter 14 Research Approach & Methodology
    1. 14.1. Report Description
    2. 14.2. Research Scope
    3. 14.3. Research Methodology
      1. 14.3.1. Secondary Research
      2. 14.3.2. Primary Research
      3. 14.3.3. Statistical Models
        1. 14.3.3.1. Company Share Analysis Model
        2. 14.3.3.2. Revenue Based Modeling
      4. 14.3.4. Research Limitations

      List of Figures

      Fig.1	Product Picture of Agriculture Testing Service Providers
      Fig.2	Global Agriculture Testing Service Providers Market, 2016 – 2026 (USD Billion)
      Fig.3	Global Agriculture Testing Service Providers Market Absolute Revenue Opportunity, 2016 – 2026 (USD Billion)
      Fig.4	Global Agriculture Testing Service Providers Market Incremental Revenue Opportunity, 2020 – 2026 (USD Billion)
      Fig.5	Global Agriculture Testing Service Providers Market Share, by Service Type, 2020 & 2026 (USD Billion)
      Fig.6	Global Soil Testing Service Agriculture Testing Service Providers Market, 2016 – 2026 (USD Billion)
      Fig.7	Global Seed Testing Service Agriculture Testing Service Providers Market, 2016 – 2026 (USD Billion)
      Fig.8	Global Water Testing Service Agriculture Testing Service Providers Market, 2016 – 2026 (USD Billion)
      Fig.9	Global Fertilizer Testing Service Agriculture Testing Service Providers Market, 2016 – 2026 (USD Billion)
      Fig.10	Global Others Agriculture Testing Service Providers Market, 2016 – 2026 (USD Billion)
      Fig.11	Global Agriculture Testing Service Providers Market Share, by Analysis, 2020 & 2026 (USD Billion)
      Fig.12	Global Physical Analysis Agriculture Testing Service Providers Market, 2016 – 2026 (USD Billion)
      Fig.13	Global Chemical Analysis Agriculture Testing Service Providers Market, 2016 – 2026 (USD Billion)
      Fig.14	Global Agriculture Testing Service Providers Market Share, by Application, 2020 & 2026 (USD Billion)
      Fig.15	Global Safety testing Agriculture Testing Service Providers Market, 2016 – 2026 (USD Billion)
      Fig.16	Global Quality assurance Agriculture Testing Service Providers Market, 2016 – 2026 (USD Billion)
      Fig.17	Global Agriculture Testing Service Providers Market Share, by Technology, 2020 & 2026 (USD Billion)
      Fig.18	Global Conventional Agriculture Testing Service Providers Market, 2016 – 2026 (USD Billion)
      Fig.19	Global Rapid Agriculture Testing Service Providers Market, 2016 – 2026 (USD Billion)
      Fig.20	Global Agriculture Testing Service Providers Market Share, by End User, 2020 & 2026 (USD Billion)
      Fig.21	Global Farmers Agriculture Testing Service Providers Market, 2016 – 2026 (USD Billion)
      Fig.22	Global Agriculture Consultant Agriculture Testing Service Providers Market, 2016 – 2026 (USD Billion)
      Fig.23	Global Fertilizers Manufacturers Agriculture Testing Service Providers Market, 2016 – 2026 (USD Billion)
      Fig.24	Global Research Bodies Agriculture Testing Service Providers Market, 2016 – 2026 (USD Billion)
      Fig.25	Global Others Agriculture Testing Service Providers Market, 2016 – 2026 (USD Billion)
      Fig.26	Global Agriculture Testing Service Providers Market Share, by Region, 2020 & 2026 (USD Billion)
      Fig.27	North America Agriculture Testing Service Providers Market, 2016 – 2026 (USD Billion)
      Fig.28	U.S. Agriculture Testing Service Providers Market, 2016 – 2026 (USD Billion)
      Fig.29	Canada Agriculture Testing Service Providers Market, 2016 – 2026 (USD Billion)
      Fig.30	Europe Agriculture Testing Service Providers Market, 2016 – 2026 (USD Billion)
      Fig.31	Germany Agriculture Testing Service Providers Market, 2016 – 2026 (USD Billion)
      Fig.32	France Agriculture Testing Service Providers Market, 2016 – 2026 (USD Billion)
      Fig.33	U.K. Agriculture Testing Service Providers Market, 2016 – 2026 (USD Billion)
      Fig.34	Italy Agriculture Testing Service Providers Market, 2016 – 2026 (USD Billion)
      Fig.35	Spain Agriculture Testing Service Providers Market, 2016 – 2026 (USD Billion)
      Fig.36	Rest of Europe Agriculture Testing Service Providers Market, 2016 – 2026 (USD Billion)
      Fig.37	Asia Pacific Agriculture Testing Service Providers Market, 2016 – 2026 (USD Billion)
      Fig.38	China Agriculture Testing Service Providers Market, 2016 – 2026 (USD Billion)
      Fig.39	Japan Agriculture Testing Service Providers Market, 2016 – 2026 (USD Billion)
      Fig.40	India Agriculture Testing Service Providers Market, 2016 – 2026 (USD Billion)
      Fig.41	South Korea Agriculture Testing Service Providers Market, 2016 – 2026 (USD Billion)
      Fig.42	South-East Asia Agriculture Testing Service Providers Market, 2016 – 2026 (USD Billion)
      Fig.43	Rest of Asia Pacific Agriculture Testing Service Providers Market, 2016 – 2026 (USD Billion)
      Fig.44	Latin America Agriculture Testing Service Providers Market, 2016 – 2026 (USD Billion)
      Fig.45	Brazil Agriculture Testing Service Providers Market, 2016 – 2026 (USD Billion)
      Fig.46	Mexico Agriculture Testing Service Providers Market, 2016 – 2026 (USD Billion)
      Fig.47	Rest of Latin America Agriculture Testing Service Providers Market, 2016 – 2026 (USD Billion)
      Fig.48	The Middle-East and Africa Agriculture Testing Service Providers Market, 2016 – 2026 (USD Billion)
      Fig.49	GCC Countries Agriculture Testing Service Providers Market, 2016 – 2026 (USD Billion)
      Fig.50	South Africa Agriculture Testing Service Providers Market, 2016 – 2026 (USD Billion)
      Fig.51	Rest of Middle-East Africa Agriculture Testing Service Providers Market, 2016 – 2026 (USD Billion)
      Fig.52	Competitor Market Share – Revenue
      Fig.53	Kinsey Ag Services Revenue and Growth Rate
      Fig.54	Kinsey Ag Services Market Share
      Fig.55	Intertek Group plc Revenue and Growth Rate
      Fig.56	Intertek Group plc Market Share
      Fig.57	Interstellar Testing Center Pvt. Revenue and Growth Rate
      Fig.58	Interstellar Testing Center Pvt. Market Share
      Fig.59	Eurofins Scientific Revenue and Growth Rate
      Fig.60	Eurofins Scientific Market Share
      Fig.61	Cope Seeds & Grain Revenue and Growth Rate
      Fig.62	Cope Seeds & Grain Market Share
      Fig.63	BEREAU VERITAS Revenue and Growth Rate
      Fig.64	BEREAU VERITAS Market Share
      Fig.65	AgroCares Revenue and Growth Rate
      Fig.66	AgroCares Market Share
      Fig.67	Agri-Labs Revenue and Growth Rate
      Fig.68	Agri-Labs Market Share
      Fig.69	AGQ Labs USA Revenue and Growth Rate
      Fig.70	AGQ Labs USA Market Share
      Fig.71	A&L Great Lakes Revenue and Growth Rate
      Fig.72	A&L Great Lakes Market Share
      Fig.73	SGS SA Revenue and Growth Rate
      Fig.74	SGS SA Market Share
      Fig.75	Pramukh Laboratory Revenue and Growth Rate
      Fig.76	Pramukh Laboratory Market Share
      Fig.77	Polytest Laboratories Revenue and Growth Rate
      Fig.78	Polytest Laboratories Market Share
      Fig.79	OMIC USA Inc. Revenue and Growth Rate
      Fig.80	OMIC USA Inc. Market Share
      Fig.81	NRM Laboratories Revenue and Growth Rate
      Fig.82	NRM Laboratories Market Share
      Fig.83	National Agro Foundation Revenue and Growth Rate
      Fig.84	National Agro Foundation Market Share
      Fig.85	Logan Labs Revenue and Growth Rate
      Fig.86	Logan Labs Market Share
      Fig.87	Lilaba Analytical Laboratories Revenue and Growth Rate
      Fig.88	Lilaba Analytical Laboratories Market Share
      Fig.89	Waters Agricultural Laboratories Revenue and Growth Rate
      Fig.90	Waters Agricultural Laboratories Market Share
      Fig.91	Market Dynamics
      Fig.92	Global Agriculture Testing Service Providers – Value Chain Analysis
      Fig.93	Key Mandates and Regulations
      Fig.94	Technology Roadmap and Timeline
      Fig.95	Market Attractiveness Analysis – By Service Type
      Fig.96	Market Attractiveness Analysis – By Analysis
      Fig.97	Market Attractiveness Analysis – By Application
      Fig.98	Market Attractiveness Analysis – By Technology
      Fig.99	Market Attractiveness Analysis – By End User
      Fig.100	Market Attractiveness Analysis – By Region
      Fig.101	Agriculture Testing Service Providers Industrial Chain Analysis
      Fig.102	Market Channels
      Fig.103	Marketing Channel Development Trend
      Fig.104	Growth in World Gross Product, 2008-2018
      

      List of Tables

      Table 1	Global Agriculture Testing Service Providers Market, 2020 & 2026 (USD Billion)
      Table 2	Global Agriculture Testing Service Providers Market, by Sales Channel, 2016 – 2026 (USD Billion)
      Table 3	Global Agriculture Testing Service Providers Market, by Application, 2016 – 2026 (USD Billion)
      Table 4	Global Agriculture Testing Service Providers Market, by Application, 2016 – 2026 (Kilo Tons)
      Table 5	Global Agriculture Testing Service Providers Market, by Region, 2016 – 2026 (USD Billion)
      Table 6	Global Agriculture Testing Service Providers Market, by Region, 2016 – 2026 (Kilo Tons)
      Table 7	North America Agriculture Testing Service Providers Market, by Country, 2016 – 2026 (USD Billion)
      Table 8	North America Agriculture Testing Service Providers Market, by Country, 2016 – 2026 (Kilo Tons)
      Table 9 North America Agriculture Testing Service Providers Market, by Sales Channel, 2016 – 2026 (USD Billion)
      Table 10 North America Agriculture Testing Service Providers Market, by Sales Channel, 2016 – 2026 (Kilo Tons)
      Table 11 North America Agriculture Testing Service Providers Market, by Application, 2016 – 2026 (USD Billion)
      Table 12 North America Agriculture Testing Service Providers Market, by Application, 2016 – 2026 (Kilo Tons)
      Table 13 Europe Agriculture Testing Service Providers Market, by Country, 2016 – 2026 (USD Billion)
      Table 14 Europe Agriculture Testing Service Providers Market, by Country, 2016 – 2026 (Kilo Tons)
      Table 15 Europe Agriculture Testing Service Providers Market, by Sales Channel, 2016 – 2026 (USD Billion)
      Table 16 Europe Agriculture Testing Service Providers Market, by Sales Channel, 2016 – 2026 (Kilo Tons)
      Table 17 Europe Agriculture Testing Service Providers Market, by Application, 2016 – 2026 (USD Billion)
      Table 18 Europe Agriculture Testing Service Providers Market, by Application, 2016 – 2026 (Kilo Tons)
      Table 19 Asia Pacific Agriculture Testing Service Providers Market, by Country, 2016 – 2026 (USD Billion)
      Table 20 Europe Agriculture Testing Service Providers Market, by Country, 2016 – 2026 (Kilo Tons)
      Table 21 Asia Pacific Agriculture Testing Service Providers Market, by Sales Channel, 2016 – 2026 (USD Billion)
      Table 22 Asia Pacific Agriculture Testing Service Providers Market, by Sales Channel, 2016 – 2026 (Kilo Tons)
      Table 23 Asia Pacific Agriculture Testing Service Providers Market, by Application (Recipes), 2016 – 2026 (USD Billion)
      Table 24 Asia Pacific Agriculture Testing Service Providers Market, by Application, 2016 – 2026 (Kilo Tons)
      Table 25 Latin America Agriculture Testing Service Providers Market, by Country, 2016 – 2026 (USD Billion)
      Table 26 Latin America Agriculture Testing Service Providers Market, by Country, 2016 – 2026 (Kilo Tons)
      Table 27 Latin America Agriculture Testing Service Providers Market, by Sales Channel, 2016 – 2026 (USD Billion)
      Table 28 Latin America Agriculture Testing Service Providers Market, by Sales Channel, 2016 – 2026 (Kilo Tons)
      Table 29 Latin America Agriculture Testing Service Providers Market, by Application, 2016 – 2026 (USD Billion)
      Table 30 Latin America Agriculture Testing Service Providers Market, by Application, 2016 – 2026 (Kilo Tons)
      Table 31 Middle East & Africa Agriculture Testing Service Providers Market, by Country, 2016 – 2026 (USD Billion)
      Table 32 Middle East & Africa Agriculture Testing Service Providers Market, by Country, 2016 – 2026 (Kilo Tons)
      Table 33 Middle East & Africa Agriculture Testing Service Providers Market, by Sales Channel, 2016 – 2026 (USD Billion)
      Table 34 Middle East & Africa Agriculture Testing Service Providers Market, by Sales Channel, 2016 – 2026 (Kilo Tons)
      Table 35 Middle East & Africa Agriculture Testing Service Providers Market, by Application, 2016 – 2026 (USD Billion)
      Table 36 Middle East & Africa Agriculture Testing Service Providers Market, by Application, 2016 – 2026 (Kilo Tons)
      Table 37 Global Agriculture Testing Service Providers Market - Company Revenue Analysis, 2016 – 2020 (USD Billion)
      Table 38 Global Agriculture Testing Service Providers Market - Company Revenue Share Analysis, 2016 – 2020 (%)
      Table 39 Acquisitions and Mergers
      Table 40 Market Drivers – Impact Analysis
      Table 41 Market Restraints
      Table 42 Market Opportunities
      Table 43 Major Buyers of Agriculture Testing Service Providers
      Table 44 Distributors/Traders of Agriculture Testing Service Providers by Region
      

Industry Major Market Players

  • Kinsey Ag Services
  • Intertek Group plc
  • Interstellar Testing Center Pvt.
  • Eurofins Scientific
  • Cope Seeds & Grain
  • BEREAU VERITAS
  • AgroCares
  • Agri-Labs
  • AGQ Labs USA
  • A&L Great Lakes
  • SGS SA
  • Pramukh Laboratory
  • Polytest Laboratories
  • OMIC USA Inc.
  • NRM Laboratories
  • National Agro Foundation
  • Logan Labs
  • Lilaba Analytical Laboratories
  • Waters Agricultural Laboratories