Search Market Research Report

Discover Our Latest Reports
Discover Our Featured Reports
Discover Top Selling Reports

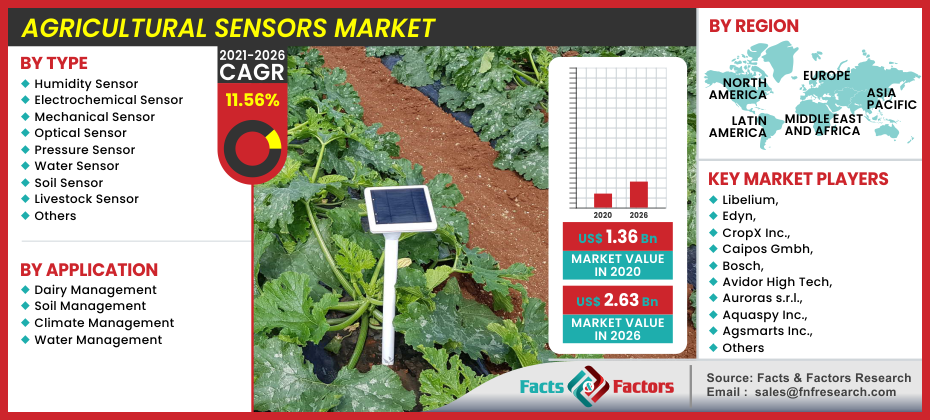
Agricultural Sensors Market Size, Share Global Analysis Report, , 2020 – 2026

report img

Agricultural Sensors Market By Type (Humidity Sensor, Electrochemical Sensor, Mechanical Sensor, Optical Sensor, Pressure Sensor, Water Sensor, Soil Sensor, Livestock Sensor, and Others), and By Application (Dairy Management, Soil Management, Climate Management, and Water Management): Global Industry Perspective, Comprehensive Analysis, and Forecast, 2020 – 2026

Industry Insights

[198+ Pages Report] As per the Facts and Factors market research report, the global Agricultural Sensors market generated sales revenue of USD 1.36 Billion in 2020. Further, the agriculture sensors sales are expected to generate revenue of USD 2.63 Billion by the end of 2026, increasing at a CAGR of around 11.56% from 2021 to 2026.

logoMarket Overview

Agricultural sensor is a group of sensing devices used in today’s agriculture, like precision farming, to provide data that helps farmers track and optimize crops, as well as respond to evolving environmental conditions. Agricultural sensors are rapidly gaining prominence among farmers as a result of the growing need for optimal productivity with limited resources. Furthermore, evolving weather conditions caused by rising global temperatures have necessitated the use of sophisticated sensors to boost production and crop yield. Through providing sophisticated sensors, farmers will benefit from real-time farm tracking, weather forecasts, optimum field requirements, and other related services. Agricultural sensors allow farmers to maximize yield while reducing human effort and waste.

logoIndustry Growth Factor

The growing acceptance of precision farming technology is projected to drive the global agriculture sensors market over the forecast period. Furthermore, the significant adoption of modern agricultural procedures in North America is driving demand growth during the projected era. Agriculture sensor farming is rapidly gaining commercialization and farmer adoption in developing regions as a result of good research. The growing public and private sector funding for the implementation of precision agriculture approaches is expected to drive up demand for agriculture sensors in the developing world. Precision farming technologies have poor penetration in emerging regions due to a lack of understanding about the advantages of these technologies and their high initial cost.

Agricultural Sensors Market

To know more about this report | Request Free Sample Copy

To meet the challenges of a shrinking professional labour force and fluctuating climatic conditions, new techniques for indoor farming are needed. When growing crops solely indoors, the farmer has control over moisture levels, light levels, and nutrient levels. Agriculture sensors with small-scale controller systems with high flexibility allow businesses to increase device automation and yields. This will, in essence, generate prospects throughout the forecast era. The combination of agricultural sensors with the trend in indoor agriculture is expected to increase crop production sizes which in turn will drive the global demand for sensors during the forecast era.

logoGlobal Agricultural Sensors Market: Segmentation

Based on Type, the market is bifurcated into optical sensors, livestock sensors, humidity sensors, mechanical sensors, electrochemical sensors, pressure sensors, soil sensors, water sensors, and others. Based on application, the market is bifurcated into dairy management, climate management, soil management, and water management.

logoGlobal Agricultural Sensors Market: Regional Analysis

Based on regions, the global Agricultural Sensors market can be divided into five main regions.

North America holds the largest market share. The increased use of advanced agriculture technologies in the US would improve the demand in this area by strong government support to increase agriculture productivity and availability of support infrastructure and acceptability of smart and precession farm methodologies. The enhanced implementation of advanced agricultural technologies in the U.S. and Canada has been strengthened with strong government funding for enhancing agricultural production, access to support facilities, and the adoption of smart and precession methodologies. The use of precise farming methods by large farmers in North America and Europe has greatly gained, and now medium and small farms are also slowly increasing their investment in precious and intelligent farming methods to maximize productivity. In the entire forecast timeframe, Asia Pacific is projected to be experiencing tremendous growth as important countries concentrate on raising awareness of the benefits of precision farming. The vast agricultural areas and the increasing use of precision and smart farming methodologies to meet the demand for agricultural production are expected to be India and China's key market for agriculture sensors.

logoReport Scope

Report Attribute

Details

Market Size in 2020

USD 1.36 Billion

Projected Market Size in 2026

USD 2.63 Billion

CAGR Growth Rate

11.56% CAGR

Base Year

2020

Forecast Years

2021-2026

Key Market Players

Libelium, Edyn, CropX Inc., Caipos Gmbh, Bosch, Avidor High Tech, Auroras s.r.l., Aquaspy Inc., Agsmarts Inc., Acquity Agriculture, Acclima Inc., Pycno Agriculture, Sentek Ltd, Sentera, LLC., Sol Chip Ltd, Texas Instruments, The Yield Pty Ltd, Trimble Inc, and Vegetronix Inc.

Key Segment

By Type, By Application, By Region

Major Regions Covered

North America, Europe, Asia Pacific, Latin America, and the Middle East & Africa

Purchase Options

Request customized purchase options to meet your research needs. Explore purchase options

logoGlobal Agricultural Sensors Market: Competitive Players

Some of the key players in the Agricultural Sensors market are :

  • Libelium
  • Edyn
  • CropX Inc.
  • Caipos Gmbh
  • Bosch
  • Avidor High Tech
  • Auroras s.r.l.
  • Aquaspy Inc.
  • Agsmarts Inc.
  • Acquity Agriculture
  • Acclima Inc.
  • Pycno Agriculture
  • Sentek Ltd
  • Sentera LLC.
  • Sol Chip Ltd
  • Texas Instruments
  • The Yield Pty Ltd
  • Trimble Inc
  • Vegetronix Inc.

logoGlobal Agricultural Sensors Market: Type Segment Analysis

  • Humidity Sensor
  • Electrochemical Sensor
  • Mechanical Sensor
  • Optical Sensor
  • Pressure Sensor
  • Water Sensor
  • Soil Sensor
  • Livestock Sensor
  • Others

logoGlobal Agricultural Sensors Market: Application Segment Analysis

  • Dairy Management
  • Soil Management
  • Climate Management
  • Water Management

logoGlobal Agricultural Sensors Market: Regional Segment Analysis

  • North America
    • U.S.
    • Canada
  • Europe
    • U.K.
    • France
    • Germany
  • The Asia Pacific
    • China
    • Japan
    • India
  • Latin America
    • Brazil
    • Mexico
  • The Middle East and Africa

Table of Content

  1. Chapter 1 Executive Summary
    1. 1.1. Introduction of Agriculture Sensors
    2. 1.2. Global Agriculture Sensors Market, 2020 & 2026 (USD Billion)
    3. 1.3. COVID-19 Impacts on Agricultural Sensors Market
      1. 1.3.1. Short Term COVID-19 Impact on the Market
      2. 1.3.2. Mid-Term COVID-19 Impact on the Market
      3. 1.3.3. Long-Term COVID-19 Impact on the Market
    4. 1.4. Business Strategies and Recommendations
    5. 1.5. Global Agriculture Sensors Market, 2016 – 2026 (USD Billion)
    6. 1.6. Global Agriculture Sensors Market Absolute Revenue Opportunity, 2016 – 2026 (USD Billion)
    7. 1.7. Global Agriculture Sensors Market Incremental Revenue Opportunity, 2020 – 2026 (USD Billion)
  2. Chapter 2 Agriculture Sensors Market – Type Analysis
    1. 2.1. Global Agriculture Sensors Market – Type Overview
    2. 2.2. Global Agriculture Sensors Market Share, by Type, 2020 & 2026 (USD Billion)
    3. 2.3. Humidity Sensor
      1. 2.3.1. Global Humidity Sensor Agriculture Sensors Market, 2016 – 2026 (USD Billion)
    4. 2.4. Electrochemical Sensor
      1. 2.4.1. Global Electrochemical Sensor Agriculture Sensors Market, 2016 – 2026 (USD Billion)
    5. 2.5. Mechanical Sensor
      1. 2.5.1. Global Mechanical Sensor Agriculture Sensors Market, 2016 – 2026 (USD Billion)
    6. 2.6. Optical Sensor
      1. 2.6.1. Global Optical Sensor Agriculture Sensors Market, 2016 – 2026 (USD Billion)
    7. 2.7. Pressure Sensor
      1. 2.7.1. Global Pressure Sensor Agriculture Sensors Market, 2016 – 2026 (USD Billion)
    8. 2.8. Water Sensor
      1. 2.8.1. Global Water Sensor Agriculture Sensors Market, 2016 – 2026 (USD Billion)
    9. 2.9. Soil Sensor
      1. 2.9.1. Global Soil Sensor Agriculture Sensors Market, 2016 – 2026 (USD Billion)
    10. 2.10. Livestock Sensor
      1. 2.10.1. Global Livestock Sensor Agriculture Sensors Market, 2016 – 2026 (USD Billion)
    11. 2.11. Others
      1. 2.11.1. Global Others Agriculture Sensors Market, 2016 – 2026 (USD Billion)
  3. Chapter 3 Agriculture Sensors Market – Application Analysis
    1. 3.1. Global Agriculture Sensors Market – Application Overview
    2. 3.2. Global Agriculture Sensors Market Share, by Application, 2020 & 2026 (USD Billion)
    3. 3.3. Dairy Management
      1. 3.3.1. Global Dairy Management Agriculture Sensors Market, 2016 – 2026 (USD Billion)
    4. 3.4. Soil Management
      1. 3.4.1. Global Soil Management Agriculture Sensors Market, 2016 – 2026 (USD Billion)
    5. 3.5. Climate Management
      1. 3.5.1. Global Climate Management Agriculture Sensors Market, 2016 – 2026 (USD Billion)
    6. 3.6. Water Management
      1. 3.6.1. Global Water Management Agriculture Sensors Market, 2016 – 2026 (USD Billion)
  4. Chapter 4 Agriculture Sensors Market – Regional Analysis
    1. 4.1. Global Agriculture Sensors Market Regional Overview
    2. 4.2. Global Agriculture Sensors Market Share, by Region, 2020 & 2026 (USD Billion)
    3. 4.3. North America
      1. 4.3.1. North America Agriculture Sensors Market, 2016 – 2026 (USD Billion)
        1. 4.3.1.1. North America Agriculture Sensors Market, by Country, 2016 - 2026 (USD Billion)
      2. 4.3.2. North America Agriculture Sensors Market, by Type, 2016 – 2026
        1. 4.3.2.1. North America Agriculture Sensors Market, by Type, 2016 – 2026 (USD Billion)
      3. 4.3.3. North America Agriculture Sensors Market, by Application, 2016 – 2026
        1. 4.3.3.1. North America Agriculture Sensors Market, by Application, 2016 – 2026 (USD Billion)
      4. 4.3.4. U.S.
        1. 4.3.4.1. U.S. Agriculture Sensors Market, 2016 – 2026 (USD Billion)
      5. 4.3.5. Canada
        1. 4.3.5.1. Canada Agriculture Sensors Market, 2016 – 2026 (USD Billion)
    4. 4.4. Europe
      1. 4.4.1. Europe Agriculture Sensors Market, 2016 – 2026 (USD Billion)
        1. 4.4.1.1. Europe Agriculture Sensors Market, by Country, 2016 - 2026 (USD Billion)
      2. 4.4.2. Europe Agriculture Sensors Market, by Type, 2016 – 2026
        1. 4.4.2.1. Europe Agriculture Sensors Market, by Type, 2016 – 2026 (USD Billion)
      3. 4.4.3. Europe Agriculture Sensors Market, by Application, 2016 – 2026
        1. 4.4.3.1. Europe Agriculture Sensors Market, by Application, 2016 – 2026 (USD Billion)
      4. 4.4.4. Germany
        1. 4.4.4.1. Germany Agriculture Sensors Market, 2016 – 2026 (USD Billion)
      5. 4.4.5. France
        1. 4.4.5.1. France Agriculture Sensors Market, 2016 – 2026 (USD Billion)
      6. 4.4.6. U.K.
        1. 4.4.6.1. U.K. Agriculture Sensors Market, 2016 – 2026 (USD Billion)
      7. 4.4.7. Italy
        1. 4.4.7.1. Italy Agriculture Sensors Market, 2016 – 2026 (USD Billion)
      8. 4.4.8. Spain
        1. 4.4.8.1. Spain Agriculture Sensors Market, 2016 – 2026 (USD Billion)
      9. 4.4.9. Rest of Europe
        1. 4.4.9.1. Rest of Europe Agriculture Sensors Market, 2016 – 2026 (USD Billion)
    5. 4.5. Asia Pacific
      1. 4.5.1. Asia Pacific Agriculture Sensors Market, 2016 – 2026 (USD Billion)
        1. 4.5.1.1. Asia Pacific Agriculture Sensors Market, by Country, 2016 - 2026 (USD Billion)
      2. 4.5.2. Asia Pacific Agriculture Sensors Market, by Type, 2016 – 2026
        1. 4.5.2.1. Asia Pacific Agriculture Sensors Market, by Type, 2016 – 2026 (USD Billion)
      3. 4.5.3. Asia Pacific Agriculture Sensors Market, by Application, 2016 – 2026
        1. 4.5.3.1. Asia Pacific Agriculture Sensors Market, by Application, 2016 – 2026 (USD Billion)
      4. 4.5.4. China
        1. 4.5.4.1. China Agriculture Sensors Market, 2016 – 2026 (USD Billion)
      5. 4.5.5. Japan
        1. 4.5.5.1. Japan Agriculture Sensors Market, 2016 – 2026 (USD Billion)
      6. 4.5.6. India
        1. 4.5.6.1. India Agriculture Sensors Market, 2016 – 2026 (USD Billion)
      7. 4.5.7. South Korea
        1. 4.5.7.1. South Korea Agriculture Sensors Market, 2016 – 2026 (USD Billion)
      8. 4.5.8. South-East Asia
        1. 4.5.8.1. South-East Asia Agriculture Sensors Market, 2016 – 2026 (USD Billion)
      9. 4.5.9. Rest of Asia Pacific
        1. 4.5.9.1. Rest of Asia Pacific Agriculture Sensors Market, 2016 – 2026 (USD Billion)
    6. 4.6. Latin America
      1. 4.6.1. Latin America Agriculture Sensors Market, 2016 – 2026 (USD Billion)
        1. 4.6.1.1. Latin America Agriculture Sensors Market, by Country, 2016 - 2026 (USD Billion)
      2. 4.6.2. Latin America Agriculture Sensors Market, by Type, 2016 – 2026
        1. 4.6.2.1. Latin America Agriculture Sensors Market, by Type, 2016 – 2026 (USD Billion)
      3. 4.6.3. Latin America Agriculture Sensors Market, by Application, 2016 – 2026
        1. 4.6.3.1. Latin America Agriculture Sensors Market, by Application, 2016 – 2026 (USD Billion)
      4. 4.6.4. Brazil
        1. 4.6.4.1. Brazil Agriculture Sensors Market, 2016 – 2026 (USD Billion)
      5. 4.6.5. Mexico
        1. 4.6.5.1. Mexico Agriculture Sensors Market, 2016 – 2026 (USD Billion)
      6. 4.6.6. Rest of Latin America
        1. 4.6.6.1. Rest of Latin America Agriculture Sensors Market, 2016 – 2026 (USD Billion)
    7. 4.7. The Middle-East and Africa
      1. 4.7.1. The Middle-East and Africa Agriculture Sensors Market, 2016 – 2026 (USD Billion)
        1. 4.7.1.1. The Middle-East and Africa Agriculture Sensors Market, by Country, 2016 - 2026 (USD Billion)
      2. 4.7.2. The Middle-East and Africa Agriculture Sensors Market, by Type, 2016 – 2026
        1. 4.7.2.1. The Middle-East and Africa Agriculture Sensors Market, by Type, 2016 – 2026 (USD Billion)
      3. 4.7.3. The Middle-East and Africa Agriculture Sensors Market, by Application, 2016 – 2026
        1. 4.7.3.1. The Middle-East and Africa Agriculture Sensors Market, by Application, 2016 – 2026 (USD Billion)
      4. 4.7.4. GCC Countries
        1. 4.7.4.1. GCC Countries Agriculture Sensors Market, 2016 – 2026 (USD Billion)
      5. 4.7.5. South Africa
        1. 4.7.5.1. South Africa Agriculture Sensors Market, 2016 – 2026 (USD Billion)
      6. 4.7.6. Rest of Middle-East Africa
        1. 4.7.6.1. Rest of Middle-East Africa Agriculture Sensors Market, 2016 – 2026 (USD Billion)
  5. Chapter 5 Agriculture Sensors Market – Competitive Landscape
    1. 5.1. Competitor Market Share – Revenue
    2. 5.2. Market Concentration Rate Analysis, Top 3 and Top 5 Players
    3. 5.3. Strategic Developments
      1. 5.3.1. Acquisitions and Mergers
      2. 5.3.2. New Products
      3. 5.3.3. Research & Development Activities
  6. Chapter 6 Company Profiles
    1. 6.1. Libelium
      1. 6.1.1. Company Overview
      2. 6.1.2. Product/Service Portfolio
      3. 6.1.3. Libelium Sales, Revenue, and Gross Margin
      4. 6.1.4. Libelium Revenue and Growth Rate
      5. 6.1.5. Libelium Market Share
      6. 6.1.6. Recent Initiatives, Funding/VC Activities, and Technological Innovations
    2. 6.2. Edyn
      1. 6.2.1. Company Overview
      2. 6.2.2. Product/Service Portfolio
      3. 6.2.3. Edyn Sales, Revenue, and Gross Margin
      4. 6.2.4. Edyn Revenue and Growth Rate
      5. 6.2.5. Edyn Market Share
      6. 6.2.6. Recent Initiatives, Funding/VC Activities, and Technological Innovations
    3. 6.3. CropX Inc.
      1. 6.3.1. Company Overview
      2. 6.3.2. Product/Service Portfolio
      3. 6.3.3. CropX Inc. Sales, Revenue, and Gross Margin
      4. 6.3.4. CropX Inc. Revenue and Growth Rate
      5. 6.3.5. CropX Inc. Market Share
      6. 6.3.6. Recent Initiatives, Funding/VC Activities, and Technological Innovations
    4. 6.4. Caipos Gmbh
      1. 6.4.1. Company Overview
      2. 6.4.2. Product/Service Portfolio
      3. 6.4.3. Caipos Gmbh Sales, Revenue, and Gross Margin
      4. 6.4.4. Caipos Gmbh Revenue and Growth Rate
      5. 6.4.5. Caipos Gmbh Market Share
      6. 6.4.6. Recent Initiatives, Funding/VC Activities, and Technological Innovations
    5. 6.5. Bosch
      1. 6.5.1. Company Overview
      2. 6.5.2. Product/Service Portfolio
      3. 6.5.3. Bosch Sales, Revenue, and Gross Margin
      4. 6.5.4. Bosch Revenue and Growth Rate
      5. 6.5.5. Bosch Market Share
      6. 6.5.6. Recent Initiatives, Funding/VC Activities, and Technological Innovations
    6. 6.6. Avidor High Tech
      1. 6.6.1. Company Overview
      2. 6.6.2. Product/Service Portfolio
      3. 6.6.3. Avidor High Tech Sales, Revenue, and Gross Margin
      4. 6.6.4. Avidor High Tech Revenue and Growth Rate
      5. 6.6.5. Avidor High Tech Market Share
      6. 6.6.6. Recent Initiatives, Funding/VC Activities, and Technological Innovations
    7. 6.7. Auroras s.r.l.
      1. 6.7.1. Company Overview
      2. 6.7.2. Product/Service Portfolio
      3. 6.7.3. Auroras s.r.l. Sales, Revenue, and Gross Margin
      4. 6.7.4. Auroras s.r.l. Revenue and Growth Rate
      5. 6.7.5. Auroras s.r.l. Market Share
      6. 6.7.6. Recent Initiatives, Funding/VC Activities, and Technological Innovations
    8. 6.8. Aquaspy Inc.
      1. 6.8.1. Company Overview
      2. 6.8.2. Product/Service Portfolio
      3. 6.8.3. Aquaspy Inc. Sales, Revenue, and Gross Margin
      4. 6.8.4. Aquaspy Inc. Revenue and Growth Rate
      5. 6.8.5. Aquaspy Inc. Market Share
      6. 6.8.6. Recent Initiatives, Funding/VC Activities, and Technological Innovations
    9. 6.9. Agsmarts Inc.
      1. 6.9.1. Company Overview
      2. 6.9.2. Product/Service Portfolio
      3. 6.9.3. Agsmarts Inc. Sales, Revenue, and Gross Margin
      4. 6.9.4. Agsmarts Inc. Revenue and Growth Rate
      5. 6.9.5. Agsmarts Inc. Market Share
      6. 6.9.6. Recent Initiatives, Funding/VC Activities, and Technological Innovations
    10. 6.10. Acquity Agriculture
      1. 6.10.1. Company Overview
      2. 6.10.2. Product/Service Portfolio
      3. 6.10.3. Acquity Agriculture Sales, Revenue, and Gross Margin
      4. 6.10.4. Acquity Agriculture Revenue and Growth Rate
      5. 6.10.5. Acquity Agriculture Market Share
      6. 6.10.6. Recent Initiatives, Funding/VC Activities, and Technological Innovations
    11. 6.11. Acclima Inc.
      1. 6.11.1. Company Overview
      2. 6.11.2. Product/Service Portfolio
      3. 6.11.3. Acclima Inc. Sales, Revenue, and Gross Margin
      4. 6.11.4. Acclima Inc. Revenue and Growth Rate
      5. 6.11.5. Acclima Inc. Market Share
      6. 6.11.6. Recent Initiatives, Funding/VC Activities, and Technological Innovations
    12. 6.12. Pycno Agriculture
      1. 6.12.1. Company Overview
      2. 6.12.2. Product/Service Portfolio
      3. 6.12.3. Pycno Agriculture Sales, Revenue, and Gross Margin
      4. 6.12.4. Pycno Agriculture Revenue and Growth Rate
      5. 6.12.5. Pycno Agriculture Market Share
      6. 6.12.6. Recent Initiatives, Funding/VC Activities, and Technological Innovations
    13. 6.13. Sentek Ltd
      1. 6.13.1. Company Overview
      2. 6.13.2. Product/Service Portfolio
      3. 6.13.3. Sentek Ltd Sales, Revenue, and Gross Margin
      4. 6.13.4. Sentek Ltd Revenue and Growth Rate
      5. 6.13.5. Sentek Ltd Market Share
      6. 6.13.6. Recent Initiatives, Funding/VC Activities, and Technological Innovations
    14. 6.14. Sentera, LLC.
      1. 6.14.1. Company Overview
      2. 6.14.2. Product/Service Portfolio
      3. 6.14.3. Sentera, LLC. Sales, Revenue, and Gross Margin
      4. 6.14.4. Sentera, LLC. Revenue and Growth Rate
      5. 6.14.5. Sentera, LLC. Market Share
      6. 6.14.6. Recent Initiatives, Funding/VC Activities, and Technological Innovations
    15. 6.15. Sol Chip Ltd
      1. 6.15.1. Company Overview
      2. 6.15.2. Product/Service Portfolio
      3. 6.15.3. Sol Chip Ltd Sales, Revenue, and Gross Margin
      4. 6.15.4. Sol Chip Ltd Revenue and Growth Rate
      5. 6.15.5. Sol Chip Ltd Market Share
      6. 6.15.6. Recent Initiatives, Funding/VC Activities, and Technological Innovations
    16. 6.16. Texas Instruments
      1. 6.16.1. Company Overview
      2. 6.16.2. Product/Service Portfolio
      3. 6.16.3. Texas Instruments Sales, Revenue, and Gross Margin
      4. 6.16.4. Texas Instruments Revenue and Growth Rate
      5. 6.16.5. Texas Instruments Market Share
      6. 6.16.6. Recent Initiatives, Funding/VC Activities, and Technological Innovations
    17. 6.17. The Yield Pty Ltd
      1. 6.17.1. Company Overview
      2. 6.17.2. Product/Service Portfolio
      3. 6.17.3. The Yield Pty Ltd Sales, Revenue, and Gross Margin
      4. 6.17.4. The Yield Pty Ltd Revenue and Growth Rate
      5. 6.17.5. The Yield Pty Ltd Market Share
      6. 6.17.6. Recent Initiatives, Funding/VC Activities, and Technological Innovations
    18. 6.18. Trimble Inc
      1. 6.18.1. Company Overview
      2. 6.18.2. Product/Service Portfolio
      3. 6.18.3. Trimble Inc Sales, Revenue, and Gross Margin
      4. 6.18.4. Trimble Inc Revenue and Growth Rate
      5. 6.18.5. Trimble Inc Market Share
      6. 6.18.6. Recent Initiatives, Funding/VC Activities, and Technological Innovations
    19. 6.19. Vegetronix Inc.
      1. 6.19.1. Company Overview
      2. 6.19.2. Product/Service Portfolio
      3. 6.19.3. Vegetronix Inc. Sales, Revenue, and Gross Margin
      4. 6.19.4. Vegetronix Inc. Revenue and Growth Rate
      5. 6.19.5. Vegetronix Inc. Market Share
      6. 6.19.6. Recent Initiatives, Funding/VC Activities, and Technological Innovations
  7. Chapter 7 Agriculture Sensors — Industry Analysis
    1. 7.1. Introduction and Taxonomy
    2. 7.2. Agriculture Sensors Market – Key Trends
      1. 7.2.1. Market Drivers
      2. 7.2.2. Market Restraints
      3. 7.2.3. Market Opportunities
    3. 7.3. Value Chain Analysis
    4. 7.4. Key Mandates and Regulations
    5. 7.5. Technology Roadmap and Timeline
    6. 7.6. Agriculture Sensors Market – Attractiveness Analysis
      1. 7.6.1. By Type
      2. 7.6.2. By Application
      3. 7.6.3. By Region
  8. Chapter 8 Industrial Chain, Sourcing Strategy, and Downstream Buyers
    1. 8.1. Agriculture Sensors Industrial Chain Analysis
    2. 8.2. Downstream Buyers
    3. 8.3. Distributors/Traders List
  9. Chapter 9 Marketing Strategy Analysis
    1. 9.1. Marketing Channel
    2. 9.2. Direct Marketing
    3. 9.3. Indirect Marketing
    4. 9.4. Marketing Channel Development Trends
    5. 9.5. Economic/Political Environmental Change
  10. Chapter 10 Report Conclusion & Key Insights
    1. 10.1. Key Insights from Primary Interviews & Surveys Respondents
    2. 10.2. Key Takeaways from Analysts, Consultants, and Industry Leaders
  11. Chapter 11 Research Approach & Methodology
    1. 11.1. Report Description
    2. 11.2. Research Scope
    3. 11.3. Research Methodology
      1. 11.3.1. Secondary Research
      2. 11.3.2. Primary Research
      3. 11.3.3. Statistical Models
        1. 11.3.3.1. Company Share Analysis Model
        2. 11.3.3.2. Revenue Based Modeling
      4. 11.3.4. Research Limitations

      List of Figures

      Fig.1	Product Picture of Agriculture Sensors
      Fig.2	COVID-19 Impacts on Agricultural Sensors Market
      Fig.3	Business Strategies and Recommendations
      Fig.4	Global Agriculture Sensors Market, 2016 – 2026 (USD Billion)
      Fig.5	Global Agriculture Sensors Market Absolute Revenue Opportunity, 2016 – 2026 (USD Billion)
      Fig.6	Global Agriculture Sensors Market Incremental Revenue Opportunity, 2020 – 2026 (USD Billion)
      Fig.7	Global Agriculture Sensors Market Share, by Type, 2020 & 2026 (USD Billion)
      Fig.8	Global Humidity Sensor Agriculture Sensors Market, 2016 – 2026 (USD Billion)
      Fig.9	Global Electrochemical Sensor Agriculture Sensors Market, 2016 – 2026 (USD Billion)
      Fig.10	Global Mechanical Sensor Agriculture Sensors Market, 2016 – 2026 (USD Billion)
      Fig.11	Global Optical Sensor Agriculture Sensors Market, 2016 – 2026 (USD Billion)
      Fig.12	Global Pressure Sensor Agriculture Sensors Market, 2016 – 2026 (USD Billion)
      Fig.13	Global Water Sensor Agriculture Sensors Market, 2016 – 2026 (USD Billion)
      Fig.14	Global Soil Sensor Agriculture Sensors Market, 2016 – 2026 (USD Billion)
      Fig.15	Global Livestock Sensor Agriculture Sensors Market, 2016 – 2026 (USD Billion)
      Fig.16	Global Others Agriculture Sensors Market, 2016 – 2026 (USD Billion)
      Fig.17	Global Agriculture Sensors Market Share, by Application, 2020 & 2026 (USD Billion)
      Fig.18	Global Dairy Management Agriculture Sensors Market, 2016 – 2026 (USD Billion)
      Fig.19	Global Soil Management Agriculture Sensors Market, 2016 – 2026 (USD Billion)
      Fig.20	Global Climate Management Agriculture Sensors Market, 2016 – 2026 (USD Billion)
      Fig.21	Global Water Management Agriculture Sensors Market, 2016 – 2026 (USD Billion)
      Fig.22	Global Agriculture Sensors Market Share, by Region, 2020 & 2026 (USD Billion)
      Fig.23	North America Agriculture Sensors Market, 2016 – 2026 (USD Billion)
      Fig.24	U.S. Agriculture Sensors Market, 2016 – 2026 (USD Billion)
      Fig.25	Canada Agriculture Sensors Market, 2016 – 2026 (USD Billion)
      Fig.26	Europe Agriculture Sensors Market, 2016 – 2026 (USD Billion)
      Fig.27	Germany Agriculture Sensors Market, 2016 – 2026 (USD Billion)
      Fig.28	France Agriculture Sensors Market, 2016 – 2026 (USD Billion)
      Fig.29	U.K. Agriculture Sensors Market, 2016 – 2026 (USD Billion)
      Fig.30	Italy Agriculture Sensors Market, 2016 – 2026 (USD Billion)
      Fig.31	Spain Agriculture Sensors Market, 2016 – 2026 (USD Billion)
      Fig.32	Rest of Europe Agriculture Sensors Market, 2016 – 2026 (USD Billion)
      Fig.33	Asia Pacific Agriculture Sensors Market, 2016 – 2026 (USD Billion)
      Fig.34	China Agriculture Sensors Market, 2016 – 2026 (USD Billion)
      Fig.35	Japan Agriculture Sensors Market, 2016 – 2026 (USD Billion)
      Fig.36	India Agriculture Sensors Market, 2016 – 2026 (USD Billion)
      Fig.37	South Korea Agriculture Sensors Market, 2016 – 2026 (USD Billion)
      Fig.38	South-East Asia Agriculture Sensors Market, 2016 – 2026 (USD Billion)
      Fig.39	Rest of Asia Pacific Agriculture Sensors Market, 2016 – 2026 (USD Billion)
      Fig.40	Latin America Agriculture Sensors Market, 2016 – 2026 (USD Billion)
      Fig.41	Brazil Agriculture Sensors Market, 2016 – 2026 (USD Billion)
      Fig.42	Mexico Agriculture Sensors Market, 2016 – 2026 (USD Billion)
      Fig.43	Rest of Latin America Agriculture Sensors Market, 2016 – 2026 (USD Billion)
      Fig.44	The Middle-East and Africa Agriculture Sensors Market, 2016 – 2026 (USD Billion)
      Fig.45	GCC Countries Agriculture Sensors Market, 2016 – 2026 (USD Billion)
      Fig.46	South Africa Agriculture Sensors Market, 2016 – 2026 (USD Billion)
      Fig.47	Rest of Middle-East Africa Agriculture Sensors Market, 2016 – 2026 (USD Billion)
      Fig.48	Competitor Market Share – Revenue
      Fig.49	Libelium Revenue and Growth Rate
      Fig.50	Libelium Market Share
      Fig.51	Edyn Revenue and Growth Rate
      Fig.52	Edyn Market Share
      Fig.53	CropX Inc. Revenue and Growth Rate
      Fig.54	CropX Inc. Market Share
      Fig.55	Caipos Gmbh Revenue and Growth Rate
      Fig.56	Caipos Gmbh Market Share
      Fig.57	Bosch Revenue and Growth Rate
      Fig.58	Bosch Market Share
      Fig.59	Avidor High Tech Revenue and Growth Rate
      Fig.60	Avidor High Tech Market Share
      Fig.61	Auroras s.r.l. Revenue and Growth Rate
      Fig.62	Auroras s.r.l. Market Share
      Fig.63	Aquaspy Inc. Revenue and Growth Rate
      Fig.64	Aquaspy Inc. Market Share
      Fig.65	Agsmarts Inc. Revenue and Growth Rate
      Fig.66	Agsmarts Inc. Market Share
      Fig.67	Acquity Agriculture Revenue and Growth Rate
      Fig.68	Acquity Agriculture Market Share
      Fig.69	Acclima Inc. Revenue and Growth Rate
      Fig.70	Acclima Inc. Market Share
      Fig.71	Pycno Agriculture Revenue and Growth Rate
      Fig.72	Pycno Agriculture Market Share
      Fig.73	Sentek Ltd Revenue and Growth Rate
      Fig.74	Sentek Ltd Market Share
      Fig.75	Sentera, LLC. Revenue and Growth Rate
      Fig.76	Sentera, LLC. Market Share
      Fig.77	Sol Chip Ltd Revenue and Growth Rate
      Fig.78	Sol Chip Ltd Market Share
      Fig.79	Texas Instruments Revenue and Growth Rate
      Fig.80	Texas Instruments Market Share
      Fig.81	The Yield Pty Ltd Revenue and Growth Rate
      Fig.82	The Yield Pty Ltd Market Share
      Fig.83	Trimble Inc Revenue and Growth Rate
      Fig.84	Trimble Inc Market Share
      Fig.85	Vegetronix Inc. Revenue and Growth Rate
      Fig.86	Vegetronix Inc. Market Share
      Fig.87	Market Dynamics
      Fig.88	Global Agriculture Sensors – Value Chain Analysis
      Fig.89	Key Mandates and Regulations
      Fig.90	Technology Roadmap and Timeline
      Fig.91	Market Attractiveness Analysis – By Type
      Fig.92	Market Attractiveness Analysis – By Application
      Fig.93	Market Attractiveness Analysis – By Region
      Fig.94	Agriculture Sensors Industrial Chain Analysis
      Fig.95	Market Channels
      Fig.96	Marketing Channel Development Trend
      Fig.97	Growth in World Gross Product, 2008-2018
      

      List of Tables

      Table 1	Global Agriculture Sensors Market, 2020 & 2026 (USD Billion)
      Table 2	Global Agriculture Sensors Market, by Type, 2016 – 2026 (USD Billion)
      Table 3	Global Agriculture Sensors Market, by Application, 2016 – 2026 (USD Billion)
      Table 4	Global Agriculture Sensors Market, by Region, 2016 – 2026 (USD Billion)
      Table 5	North America Agriculture Sensors Market, by Country, 2016 – 2026 (USD Billion)
      Table 6	North America Agriculture Sensors Market, by Type, 2016 – 2026 (USD Billion)
      Table 7	North America Agriculture Sensors Market, by Application, 2016 – 2026 (USD Billion)
      Table 8	Europe Agriculture Sensors Market, by Country, 2016 – 2026 (USD Billion)
      Table 9 Europe Agriculture Sensors Market, by Type, 2016 – 2026 (USD Billion)
      Table 10 Europe Agriculture Sensors Market, by Application, 2016 – 2026 (USD Billion)
      Table 11 Asia Pacific Agriculture Sensors Market, by Country, 2016 – 2026 (USD Billion)
      Table 12 Asia Pacific Agriculture Sensors Market, by Type, 2016 – 2026 (USD Billion)
      Table 13 Asia Pacific Agriculture Sensors Market, by Application, 2016 – 2026 (USD Billion)
      Table 14 Latin America Agriculture Sensors Market, by Country, 2016 – 2026 (USD Billion)
      Table 15 Latin America Agriculture Sensors Market, by Type, 2016 – 2026 (USD Billion)
      Table 16 Latin America Agriculture Sensors Market, by Application, 2016 – 2026 (USD Billion)
      Table 17 The Middle-East and Africa Agriculture Sensors Market, by Country, 2016 – 2026 (USD Billion)
      Table 18 The Middle-East and Africa Agriculture Sensors Market, by Type, 2016 – 2026 (USD Billion)
      Table 19 The Middle-East and Africa Agriculture Sensors Market, by Application, 2016 – 2026 (USD Billion)
      Table 20 Global Agriculture Sensors Market - Company Revenue Analysis, 2016 – 2020 (USD Billion)
      Table 21 Global Agriculture Sensors Market - Company Revenue Share Analysis, 2016 – 2020 (%)
      Table 22 Acquisitions and Mergers
      Table 23 Market Drivers – Impact Analysis
      Table 24 Market Restraints
      Table 25 Market Opportunities
      Table 26 Major Buyers of Agriculture Sensors
      Table 27 Distributors/Traders of Agriculture Sensors by Region
      

Industry Major Market Players

  • Libelium
  • Edyn
  • CropX Inc.
  • Caipos Gmbh
  • Bosch
  • Avidor High Tech
  • Auroras s.r.l.
  • Aquaspy Inc.
  • Agsmarts Inc.
  • Acquity Agriculture
  • Acclima Inc.
  • Pycno Agriculture
  • Sentek Ltd
  • Sentera
  • LLC.
  • Sol Chip Ltd
  • Texas Instruments
  • The Yield Pty Ltd
  • Trimble Inc
  • Vegetronix Inc.