Search Market Research Report

Discover Our Latest Reports
Discover Our Featured Reports
Discover Top Selling Reports

5G Devices Market Size, Share Global Analysis Report, 2020–2026

report img

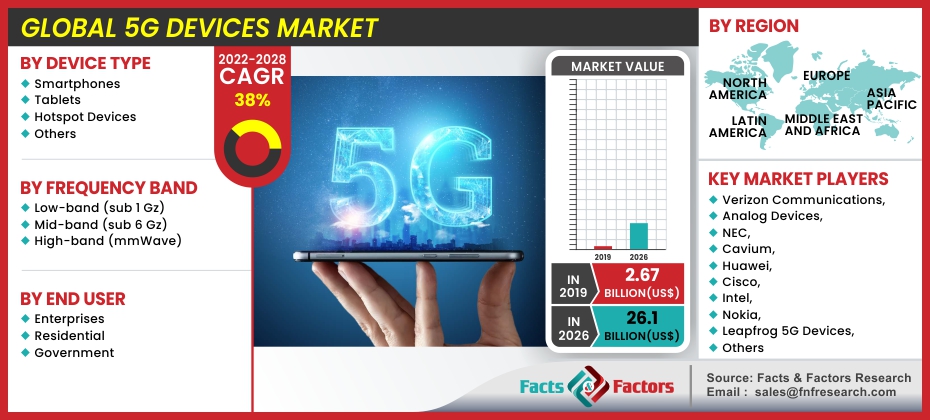
5G Devices Market By Device Type (Smartphones, Tablets, Hotspot Devices, and Others), By Frequency Band (Low-band (sub 1 Gz), Mid-band (sub 6 Gz), and High-band (mmWave)), By End User (Enterprises, Residential, and Government): Global Industry Outlook, Market Size, Business Intelligence, Consumer Preferences, Statistical Surveys, Comprehensive Analysis, Historical Developments, Current Trends, and Forecast 2020–2026

Industry Insights

logo
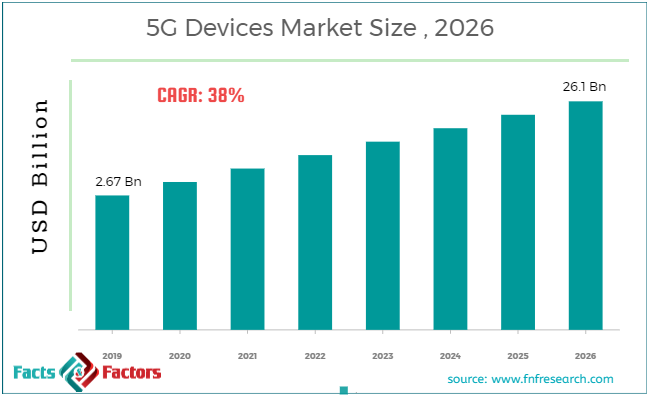
[180+ Pages Report] Global 5G devices market was projected at approximately USD 2.67 billion in 2019 and is expected to reach USD 26.1 billion by 2026, growing at a CAGR of around 38% during the forecast years.

This specialized and expertise-oriented industry research report scrutinizes the technical and commercial business outlook of the 5G devices industry. The report analyzes and declares the historical and current trends analysis of the 5G devices industry and subsequently recommends the projected trends anticipated to be observed in the 5G devices market during the upcoming years.

5G Devices Market Size

To know more about this report | Request Free Sample Copy

The 5G devices market report analyzes and notifies the industry statistics at the global as well as regional and country levels in order to acquire a thorough perspective of the entire 5G devices market. The historical and past insights are provided for FY 2016 to FY 2019 whereas projected trends are delivered for FY 2020 to FY 2026. The quantitative and numerical data is represented in terms of value (USD Million) from FY 2016 – 2026.

logoKey Insights from Primary Research

  • With the rise of 5G technology, there has been an increase in the interest shown by consumers in new smartphones and other 5G devices and this has created new opportunities for smartphone and telecom companies in the global market.
  • One of the primary growth driving factors for the global 5G devices market is the rapid integration of 5G technology into smartphones, tablets, and different communication devices.
  • Based on device types, the smartphone segment is expected to grow at the highest pace in the global 5G devices market over the forecasted period 2020-2026.
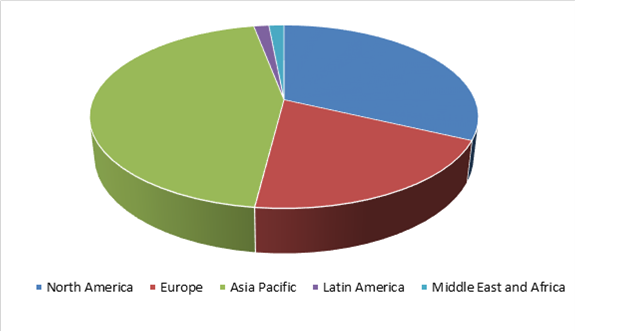
  • In terms of region, the Asia Pacific region held the majority of the share in the global 5G devices market in 2019, mainly due to the presence of key vendors operating in the region.

logoKey Recommendations from Analysts

  • As per our analysts, the 5G devices market was worth around USD 2.67 billion in 2019 and is expected to reach to a market value of USD 26.1 billion by the end of 2026.
  • Depending upon geography, the Asia Pacific region is anticipated to record the highest CAGR over the projected period 2020-2026, as it is home to some of the fastest-growing smartphone and wireless communication devices markets such as India and China.
  • Based on application, the resident segment is expected to account for the majority of the market share in 2019 and is expected to record high CAGR during the period 2020-2026.
  • Our analysts estimate that the global 5G devices market, owing to rapid developments in the 5G technology, is expected to record a CAGR of nearly 38% during the period 2020-2026.

logoGlobal 5G Devices Market Revenue Share – By Region

Global 5G Devices Market

To know more about this report | Request Free Sample Copy

The quantitative data is further underlined and reinforced by comprehensive qualitative data which comprises various across-the-board market dynamics. The rationales which directly or indirectly impact the 5G devices industry are exemplified through parameters such as growth drivers, restraints, challenges, and opportunities among other impacting factors.

Global 5G Devices Market

To know more about this report | Request Free Sample Copy

Throughout our research report, we have encompassed all the proven models and tools of industry analysis and extensively illustrated all the key business strategies and business models adopted in the 5G devices industry. The report provides an all-inclusive and detailed competitive landscape prevalent in the 5G devices market.

The report utilizes established industry analysis tools and models such as Porter’s Five Forces framework to analyze and recognize critical business strategies adopted by various stakeholders involved in the entire value chain of the 5G devices industry. The 5G devices market report additionally employs SWOT analysis and PESTLE analysis models for further in-depth analysis.

The report study further includes an in-depth analysis of industry players' market shares and provides an overview of leading players' market position in the 5G devices sector. Key strategic developments in the 5G devices market competitive landscape such as acquisitions & mergers, inaugurations of different products and services, partnerships & joint ventures, MoU agreements, VC & funding activities, R&D activities, and geographic expansion among other noteworthy activities by key players of the 5G devices market are appropriately highlighted in the report.

The global 5G devices market is expected to foresee significant growth in the future owing to rapid development and deployment of 5G technology by major telecom operators around the world. Deployment of 5G technology is the primary growth driving factor for the 5G devices market.

The 5G devices market research report delivers an acute valuation and taxonomy of the 5G devices industry by practically splitting the market on the basis of different device types, frequency bands, end-users, and regions. Through the analysis of the historical and projected trends, all the segments and sub-segments were evaluated through the bottom-up approach, and different market sizes have been projected for FY 2020 to FY 2026. The regional segmentation of the 5G devices industry includes the complete classification of all the major continents including North America, Latin America, Europe, Asia Pacific, and the Middle East & Africa. Further, country-wise data for the 5G devices industry is provided for the leading economies of the world.

logoReport Scope

Report Attribute

Details

Market Size in 2019

USD 2.67 Billion

Projected Market Size in 2026

USD 26.1 Billion

CAGR Growth Rate

38% CAGR

Base Year

2019

Forecast Years

2020-2026

Key Market Players

Verizon Communications, Analog Devices, NEC, Cavium, Huawei, Cisco, Intel, Nokia, Leapfrog 5G Devices, Qorvo, Ericsson, Samsung, SK Telecom, ZTE, Korea Telecom, Mediatek, MACOM, and T-Mobile, among others.

Key Segment

By Drive Type, Band, User, and Region

Major Regions Covered

North America, Europe, Asia Pacific, Latin America, and the Middle East &, Africa

Purchase Options

Request customized purchase options to meet your research needs. Explore purchase options

The 5G devices market is segmented based on type, frequency band, end-users, and region. On the basis of type segmentation, the market is classified into smartphones, tablets, hotspot devices, and others. In terms of frequency band segmentation, the market is bifurcated into low-band (sub 1 Gz), mid-band (sub 6 Gz), and high-band (mmWave). Based on end-users, the 5G devices market is bifurcated into enterprises, residential, and government.

logoTop Market Players

Some of the essential players operating in the 5G devices market, but not restricted to include:

  • Verizon Communications
  • Analog Devices
  • NEC
  • Cavium
  • Huawei
  • Cisco
  • Intel
  • Nokia
  • Leapfrog 5G Devices
  • Qorvo
  • Ericsson
  • Samsung
  • SK Telecom
  • ZTE
  • Korea Telecom
  • Mediatek
  • MACOM
  • T-Mobile
  • among others.

logoThe taxonomy of the 5G devices market by its scope and segmentation is as follows:

logo Device Type Analysis

  • Smartphones 
  • Tablets 
  • Hotspot Devices 
  • Others 

logo Frequency Band Analysis

  • Low-band (sub 1 Gz) 
  • Mid-band (sub 6 Gz) 
  • High-band (mmWave)

logo End User Analysis

  • Enterprises 
  • Residential 
  • Government

logo Regional Segmentation Analysis

  • North America
    • The U.S.
    • Canada
  • Europe
    • Germany
    • The UK
    • France
    • Spain
    • Italy
    • Rest of Europe
  • Asia Pacific
    • China
    • Japan
    • India
    • South Korea
    • Southeast Asia
    • Rest of Asia Pacific
  • Latin America
    • Brazil
    • Mexico
    • Rest of Latin America
  • Middle East & Africa
    • GCC
    • South Africa
    • Rest of the Middle East & Africa

Table of Content

  1. Chapter 1 Executive Summary
    1. 1.1. Introduction of 5G Devices
    2. 1.2. Global 5G Devices Market, 2019 & 2026 (USD Million)
    3. 1.3. Global 5G Devices Market, 2016 – 2026 (USD Million)
    4. 1.4. Global 5G Devices Market Absolute Revenue Opportunity, 2016 – 2026 (USD Million)
    5. 1.5. Global 5G Devices Market Incremental Revenue Opportunity, 2020 – 2026 (USD Million)
  2. Chapter 2 5G Devices Market – Device Type Analysis
    1. 2.1. Global 5G Devices Market – Device Type Overview
    2. 2.2. Global 5G Devices Market Share, by Device Type, 2019 & 2026 (USD Million)
    3. 2.3. Smartphones
      1. 2.3.1. Global Smartphones 5G Devices Market, 2016 – 2026 (USD Million)
    4. 2.4. Tablets
      1. 2.4.1. Global Tablets 5G Devices Market, 2016 – 2026 (USD Million)
    5. 2.5. Hotspot Devices
      1. 2.5.1. Global Hotspot Devices 5G Devices Market, 2016 – 2026 (USD Million)
    6. 2.6. Others
      1. 2.6.1. Global Others 5G Devices Market, 2016 – 2026 (USD Million)
  3. Chapter 3 5G Devices Market – Frequency Band Analysis
    1. 3.1. Global 5G Devices Market – Frequency Band Overview
    2. 3.2. Global 5G Devices Market Share, by Frequency Band, 2019 & 2026 (USD Million)
    3. 3.3. Low-band (sub 1 Gz)
      1. 3.3.1. Global Low-band (sub 1 Gz) 5G Devices Market, 2016 – 2026 (USD Million)
    4. 3.4. Mid-band (sub 6 Gz)
      1. 3.4.1. Global Mid-band (sub 6 Gz) 5G Devices Market, 2016 – 2026 (USD Million)
    5. 3.5. High-band (mmWave)
      1. 3.5.1. Global High-band (mmWave) 5G Devices Market, 2016 – 2026 (USD Million)
  4. Chapter 4 5G Devices Market – End User Analysis
    1. 4.1. Global 5G Devices Market – End User Overview
    2. 4.2. Global 5G Devices Market Share, by End User, 2019 & 2026 (USD Million)
    3. 4.3. Enterprises
      1. 4.3.1. Global Enterprises 5G Devices Market, 2016 – 2026 (USD Million)
    4. 4.4. Residential
      1. 4.4.1. Global Residential 5G Devices Market, 2016 – 2026 (USD Million)
    5. 4.5. Government
      1. 4.5.1. Global Government 5G Devices Market, 2016 – 2026 (USD Million)
  5. Chapter 5 5G Devices Market – Regional Analysis
    1. 5.1. Global 5G Devices Market Regional Overview
    2. 5.2. Global 5G Devices Market Share, by Region, 2019 & 2026 (USD Million)
    3. 5.3. North America
      1. 5.3.1. North America 5G Devices Market, 2016 – 2026 (USD Million)
        1. 5.3.1.1. North America 5G Devices Market, by Country, 2016 - 2026 (USD Million)
      2. 5.3.2. North America 5G Devices Market, by Device Type, 2016 – 2026
        1. 5.3.2.1. North America 5G Devices Market, by Device Type, 2016 – 2026 (USD Million)
      3. 5.3.3. North America 5G Devices Market, by Frequency Band, 2016 – 2026
        1. 5.3.3.1. North America 5G Devices Market, by Frequency Band, 2016 – 2026 (USD Million)
      4. 5.3.4. North America 5G Devices Market, by End User, 2016 – 2026
        1. 5.3.4.1. North America 5G Devices Market, by End User, 2016 – 2026 (USD Million)
      5. 5.3.5. U.S.
        1. 5.3.5.1. U.S. 5G Devices Market, 2016 – 2026 (USD Million)
      6. 5.3.6. Canada
        1. 5.3.6.1. Canada 5G Devices Market, 2016 – 2026 (USD Million)
    4. 5.4. Europe
      1. 5.4.1. Europe 5G Devices Market, 2016 – 2026 (USD Million)
        1. 5.4.1.1. Europe 5G Devices Market, by Country, 2016 - 2026 (USD Million)
      2. 5.4.2. Europe 5G Devices Market, by Device Type, 2016 – 2026
        1. 5.4.2.1. Europe 5G Devices Market, by Device Type, 2016 – 2026 (USD Million)
      3. 5.4.3. Europe 5G Devices Market, by Frequency Band, 2016 – 2026
        1. 5.4.3.1. Europe 5G Devices Market, by Frequency Band, 2016 – 2026 (USD Million)
      4. 5.4.4. Europe 5G Devices Market, by End User, 2016 – 2026
        1. 5.4.4.1. Europe 5G Devices Market, by End User, 2016 – 2026 (USD Million)
      5. 5.4.5. Germany
        1. 5.4.5.1. Germany 5G Devices Market, 2016 – 2026 (USD Million)
      6. 5.4.6. France
        1. 5.4.6.1. France 5G Devices Market, 2016 – 2026 (USD Million)
      7. 5.4.7. U.K.
        1. 5.4.7.1. U.K. 5G Devices Market, 2016 – 2026 (USD Million)
      8. 5.4.8. Italy
        1. 5.4.8.1. Italy 5G Devices Market, 2016 – 2026 (USD Million)
      9. 5.4.9. Spain
        1. 5.4.9.1. Spain 5G Devices Market, 2016 – 2026 (USD Million)
      10. 5.4.10. Rest of Europe
        1. 5.4.10.1. Rest of Europe 5G Devices Market, 2016 – 2026 (USD Million)
    5. 5.5. Asia Pacific
      1. 5.5.1. Asia Pacific 5G Devices Market, 2016 – 2026 (USD Million)
        1. 5.5.1.1. Asia Pacific 5G Devices Market, by Country, 2016 - 2026 (USD Million)
      2. 5.5.2. Asia Pacific 5G Devices Market, by Device Type, 2016 – 2026
        1. 5.5.2.1. Asia Pacific 5G Devices Market, by Device Type, 2016 – 2026 (USD Million)
      3. 5.5.3. Asia Pacific 5G Devices Market, by Frequency Band, 2016 – 2026
        1. 5.5.3.1. Asia Pacific 5G Devices Market, by Frequency Band, 2016 – 2026 (USD Million)
      4. 5.5.4. Asia Pacific 5G Devices Market, by End User, 2016 – 2026
        1. 5.5.4.1. Asia Pacific 5G Devices Market, by End User, 2016 – 2026 (USD Million)
      5. 5.5.5. China
        1. 5.5.5.1. China 5G Devices Market, 2016 – 2026 (USD Million)
      6. 5.5.6. Japan
        1. 5.5.6.1. Japan 5G Devices Market, 2016 – 2026 (USD Million)
      7. 5.5.7. India
        1. 5.5.7.1. India 5G Devices Market, 2016 – 2026 (USD Million)
      8. 5.5.8. South Korea
        1. 5.5.8.1. South Korea 5G Devices Market, 2016 – 2026 (USD Million)
      9. 5.5.9. South-East Asia
        1. 5.5.9.1. South-East Asia 5G Devices Market, 2016 – 2026 (USD Million)
      10. 5.5.10. Rest of Asia Pacific
        1. 5.5.10.1. Rest of Asia Pacific 5G Devices Market, 2016 – 2026 (USD Million)
    6. 5.6. Latin America
      1. 5.6.1. Latin America 5G Devices Market, 2016 – 2026 (USD Million)
        1. 5.6.1.1. Latin America 5G Devices Market, by Country, 2016 - 2026 (USD Million)
      2. 5.6.2. Latin America 5G Devices Market, by Device Type, 2016 – 2026
        1. 5.6.2.1. Latin America 5G Devices Market, by Device Type, 2016 – 2026 (USD Million)
      3. 5.6.3. Latin America 5G Devices Market, by Frequency Band, 2016 – 2026
        1. 5.6.3.1. Latin America 5G Devices Market, by Frequency Band, 2016 – 2026 (USD Million)
      4. 5.6.4. Latin America 5G Devices Market, by End User, 2016 – 2026
        1. 5.6.4.1. Latin America 5G Devices Market, by End User, 2016 – 2026 (USD Million)
      5. 5.6.5. Brazil
        1. 5.6.5.1. Brazil 5G Devices Market, 2016 – 2026 (USD Million)
      6. 5.6.6. Mexico
        1. 5.6.6.1. Mexico 5G Devices Market, 2016 – 2026 (USD Million)
      7. 5.6.7. Rest of Latin America
        1. 5.6.7.1. Rest of Latin America 5G Devices Market, 2016 – 2026 (USD Million)
    7. 5.7. The Middle-East and Africa
      1. 5.7.1. The Middle-East and Africa 5G Devices Market, 2016 – 2026 (USD Million)
        1. 5.7.1.1. The Middle-East and Africa 5G Devices Market, by Country, 2016 - 2026 (USD Million)
      2. 5.7.2. The Middle-East and Africa 5G Devices Market, by Device Type, 2016 – 2026
        1. 5.7.2.1. The Middle-East and Africa 5G Devices Market, by Device Type, 2016 – 2026 (USD Million)
      3. 5.7.3. The Middle-East and Africa 5G Devices Market, by Frequency Band, 2016 – 2026
        1. 5.7.3.1. The Middle-East and Africa 5G Devices Market, by Frequency Band, 2016 – 2026 (USD Million)
      4. 5.7.4. The Middle-East and Africa 5G Devices Market, by End User, 2016 – 2026
        1. 5.7.4.1. The Middle-East and Africa 5G Devices Market, by End User, 2016 – 2026 (USD Million)
      5. 5.7.5. GCC Countries
        1. 5.7.5.1. GCC Countries 5G Devices Market, 2016 – 2026 (USD Million)
      6. 5.7.6. South Africa
        1. 5.7.6.1. South Africa 5G Devices Market, 2016 – 2026 (USD Million)
      7. 5.7.7. Rest of Middle-East Africa
        1. 5.7.7.1. Rest of Middle-East Africa 5G Devices Market, 2016 – 2026 (USD Million)
  6. Chapter 6 5G Devices Market – Competitive Landscape
    1. 6.1. Competitor Market Share – Revenue
    2. 6.2. Market Concentration Rate Analysis, Top 3 and Top 5 Players
    3. 6.3. Strategic Developments
      1. 6.3.1. Acquisitions and Mergers
      2. 6.3.2. New Products
      3. 6.3.3. Research & Development Activities
  7. Chapter 7 Company Profiles
    1. 7.1. Verizon Communications
      1. 7.1.1. Company Overview
      2. 7.1.2. Product/Service Portfolio
      3. 7.1.3. Verizon Communications Sales, Revenue, and Gross Margin
      4. 7.1.4. Verizon Communications Revenue and Growth Rate
      5. 7.1.5. Verizon Communications Market Share
      6. 7.1.6. Recent Initiatives, Funding/VC Activities, and Technological Innovations
    2. 7.2. Analog Devices
      1. 7.2.1. Company Overview
      2. 7.2.2. Product/Service Portfolio
      3. 7.2.3. Analog Devices Sales, Revenue, and Gross Margin
      4. 7.2.4. Analog Devices Revenue and Growth Rate
      5. 7.2.5. Analog Devices Market Share
      6. 7.2.6. Recent Initiatives, Funding/VC Activities, and Technological Innovations
    3. 7.3. NEC
      1. 7.3.1. Company Overview
      2. 7.3.2. Product/Service Portfolio
      3. 7.3.3. NEC Sales, Revenue, and Gross Margin
      4. 7.3.4. NEC Revenue and Growth Rate
      5. 7.3.5. NEC Market Share
      6. 7.3.6. Recent Initiatives, Funding/VC Activities, and Technological Innovations
    4. 7.4. Cavium
      1. 7.4.1. Company Overview
      2. 7.4.2. Product/Service Portfolio
      3. 7.4.3. Cavium Sales, Revenue, and Gross Margin
      4. 7.4.4. Cavium Revenue and Growth Rate
      5. 7.4.5. Cavium Market Share
      6. 7.4.6. Recent Initiatives, Funding/VC Activities, and Technological Innovations
    5. 7.5. Huawei
      1. 7.5.1. Company Overview
      2. 7.5.2. Product/Service Portfolio
      3. 7.5.3. Huawei Sales, Revenue, and Gross Margin
      4. 7.5.4. Huawei Revenue and Growth Rate
      5. 7.5.5. Huawei Market Share
      6. 7.5.6. Recent Initiatives, Funding/VC Activities, and Technological Innovations
    6. 7.6. Cisco
      1. 7.6.1. Company Overview
      2. 7.6.2. Product/Service Portfolio
      3. 7.6.3. Cisco Sales, Revenue, and Gross Margin
      4. 7.6.4. Cisco Revenue and Growth Rate
      5. 7.6.5. Cisco Market Share
      6. 7.6.6. Recent Initiatives, Funding/VC Activities, and Technological Innovations
    7. 7.7. Intel
      1. 7.7.1. Company Overview
      2. 7.7.2. Product/Service Portfolio
      3. 7.7.3. Intel Sales, Revenue, and Gross Margin
      4. 7.7.4. Intel Revenue and Growth Rate
      5. 7.7.5. Intel Market Share
      6. 7.7.6. Recent Initiatives, Funding/VC Activities, and Technological Innovations
    8. 7.8. Nokia
      1. 7.8.1. Company Overview
      2. 7.8.2. Product/Service Portfolio
      3. 7.8.3. Nokia Sales, Revenue, and Gross Margin
      4. 7.8.4. Nokia Revenue and Growth Rate
      5. 7.8.5. Nokia Market Share
      6. 7.8.6. Recent Initiatives, Funding/VC Activities, and Technological Innovations
    9. 7.9. Leapfrog 5G Devices
      1. 7.9.1. Company Overview
      2. 7.9.2. Product/Service Portfolio
      3. 7.9.3. Leapfrog 5G Devices Sales, Revenue, and Gross Margin
      4. 7.9.4. Leapfrog 5G Devices Revenue and Growth Rate
      5. 7.9.5. Leapfrog 5G Devices Market Share
      6. 7.9.6. Recent Initiatives, Funding/VC Activities, and Technological Innovations
    10. 7.10. Qorvo
      1. 7.10.1. Company Overview
      2. 7.10.2. Product/Service Portfolio
      3. 7.10.3. Qorvo Sales, Revenue, and Gross Margin
      4. 7.10.4. Qorvo Revenue and Growth Rate
      5. 7.10.5. Qorvo Market Share
      6. 7.10.6. Recent Initiatives, Funding/VC Activities, and Technological Innovations
    11. 7.11. Ericsson
      1. 7.11.1. Company Overview
      2. 7.11.2. Product/Service Portfolio
      3. 7.11.3. Ericsson Sales, Revenue, and Gross Margin
      4. 7.11.4. Ericsson Revenue and Growth Rate
      5. 7.11.5. Ericsson Market Share
      6. 7.11.6. Recent Initiatives, Funding/VC Activities, and Technological Innovations
    12. 7.12. Samsung
      1. 7.12.1. Company Overview
      2. 7.12.2. Product/Service Portfolio
      3. 7.12.3. Samsung Sales, Revenue, and Gross Margin
      4. 7.12.4. Samsung Revenue and Growth Rate
      5. 7.12.5. Samsung Market Share
      6. 7.12.6. Recent Initiatives, Funding/VC Activities, and Technological Innovations
    13. 7.13. SK Telecom
      1. 7.13.1. Company Overview
      2. 7.13.2. Product/Service Portfolio
      3. 7.13.3. SK Telecom Sales, Revenue, and Gross Margin
      4. 7.13.4. SK Telecom Revenue and Growth Rate
      5. 7.13.5. SK Telecom Market Share
      6. 7.13.6. Recent Initiatives, Funding/VC Activities, and Technological Innovations
    14. 7.14. ZTE
      1. 7.14.1. Company Overview
      2. 7.14.2. Product/Service Portfolio
      3. 7.14.3. ZTE Sales, Revenue, and Gross Margin
      4. 7.14.4. ZTE Revenue and Growth Rate
      5. 7.14.5. ZTE Market Share
      6. 7.14.6. Recent Initiatives, Funding/VC Activities, and Technological Innovations
    15. 7.15. Korea Telecom
      1. 7.15.1. Company Overview
      2. 7.15.2. Product/Service Portfolio
      3. 7.15.3. Korea Telecom Sales, Revenue, and Gross Margin
      4. 7.15.4. Korea Telecom Revenue and Growth Rate
      5. 7.15.5. Korea Telecom Market Share
      6. 7.15.6. Recent Initiatives, Funding/VC Activities, and Technological Innovations
    16. 7.16. Mediatek
      1. 7.16.1. Company Overview
      2. 7.16.2. Product/Service Portfolio
      3. 7.16.3. Mediatek Sales, Revenue, and Gross Margin
      4. 7.16.4. Mediatek Revenue and Growth Rate
      5. 7.16.5. Mediatek Market Share
      6. 7.16.6. Recent Initiatives, Funding/VC Activities, and Technological Innovations
    17. 7.17. MACOM
      1. 7.17.1. Company Overview
      2. 7.17.2. Product/Service Portfolio
      3. 7.17.3. MACOM Sales, Revenue, and Gross Margin
      4. 7.17.4. MACOM Revenue and Growth Rate
      5. 7.17.5. MACOM Market Share
      6. 7.17.6. Recent Initiatives, Funding/VC Activities, and Technological Innovations
    18. 7.18. T-Mobile
      1. 7.18.1. Company Overview
      2. 7.18.2. Product/Service Portfolio
      3. 7.18.3. T-Mobile Sales, Revenue, and Gross Margin
      4. 7.18.4. T-Mobile Revenue and Growth Rate
      5. 7.18.5. T-Mobile Market Share
      6. 7.18.6. Recent Initiatives, Funding/VC Activities, and Technological Innovations
  8. Chapter 8 5G Devices — Industry Analysis
    1. 8.1. Introduction and Taxonomy
    2. 8.2. 5G Devices Market – Key Trends
      1. 8.2.1. Market Drivers
      2. 8.2.2. Market Restraints
      3. 8.2.3. Market Opportunities
    3. 8.3. Value Chain Analysis
    4. 8.4. Key Mandates and Regulations
    5. 8.5. Technology Roadmap and Timeline
    6. 8.6. 5G Devices Market – Attractiveness Analysis
      1. 8.6.1. By Device Type
      2. 8.6.2. By Frequency Band
      3. 8.6.3. By End User
      4. 8.6.4. By Region
  9. Chapter 9 Industrial Chain, Sourcing Strategy, and Downstream Buyers
    1. 9.1. 5G Devices Industrial Chain Analysis
    2. 9.2. Downstream Buyers
    3. 9.3. Distributors/Traders List
  10. Chapter 10 Marketing Strategy Analysis
    1. 10.1. Marketing Channel
    2. 10.2. Direct Marketing
    3. 10.3. Indirect Marketing
    4. 10.4. Marketing Channel Development Trends
    5. 10.5. Economic/Political Environmental Change
  11. Chapter 11 Report Conclusion & Key Insights
    1. 11.1. Key Insights from Primary Interviews & Surveys Respondents
    2. 11.2. Key Takeaways from Analysts, Consultants, and Industry Leaders
  12. Chapter 12 Research Approach & Methodology
    1. 12.1. Report Description
    2. 12.2. Research Scope
    3. 12.3. Research Methodology
      1. 12.3.1. Secondary Research
      2. 12.3.2. Primary Research
      3. 12.3.3. Statistical Models
        1. 12.3.3.1. Company Share Analysis Model
        2. 12.3.3.2. Revenue Based Modeling
      4. 12.3.4. Research Limitations

      List of Figures

      Fig.1 Product Picture of 5G Devices
      Fig.2 Global 5G Devices Market, 2016 – 2026 (USD Million)
      Fig.3 Global 5G Devices Market Absolute Revenue Opportunity, 2016 – 2026 (USD Million)
      Fig.4 Global 5G Devices Market Incremental Revenue Opportunity, 2020 – 2026 (USD Million)
      Fig.5 Global 5G Devices Market Share, by Device Type, 2019 & 2026 (USD Million)
      Fig.6 Global Smartphones 5G Devices Market, 2016 – 2026 (USD Million)
      Fig.7 Global Tablets 5G Devices Market, 2016 – 2026 (USD Million)
      Fig.8 Global Hotspot Devices 5G Devices Market, 2016 – 2026 (USD Million)
      Fig.9 Global Others 5G Devices Market, 2016 – 2026 (USD Million)
      Fig.10 Global 5G Devices Market Share, by Frequency Band, 2019 & 2026 (USD Million)
      Fig.11 Global Low-band (sub 1 Gz) 5G Devices Market, 2016 – 2026 (USD Million)
      Fig.12 Global Mid-band (sub 6 Gz) 5G Devices Market, 2016 – 2026 (USD Million)
      Fig.13 Global High-band (mmWave) 5G Devices Market, 2016 – 2026 (USD Million)
      Fig.14 Global 5G Devices Market Share, by End User, 2019 & 2026 (USD Million)
      Fig.15 Global Enterprises 5G Devices Market, 2016 – 2026 (USD Million)
      Fig.16 Global Residential 5G Devices Market, 2016 – 2026 (USD Million)
      Fig.17 Global Government 5G Devices Market, 2016 – 2026 (USD Million)
      Fig.18 Global 5G Devices Market Share, by Region, 2019 & 2026 (USD Million)
      Fig.19 North America 5G Devices Market, 2016 – 2026 (USD Million)
      Fig.20 U.S. 5G Devices Market, 2016 – 2026 (USD Million)
      Fig.21 Canada 5G Devices Market, 2016 – 2026 (USD Million)
      Fig.22 Europe 5G Devices Market, 2016 – 2026 (USD Million)
      Fig.23 Germany 5G Devices Market, 2016 – 2026 (USD Million)
      Fig.24 France 5G Devices Market, 2016 – 2026 (USD Million)
      Fig.25 U.K. 5G Devices Market, 2016 – 2026 (USD Million)
      Fig.26 Italy 5G Devices Market, 2016 – 2026 (USD Million)
      Fig.27 Spain 5G Devices Market, 2016 – 2026 (USD Million)
      Fig.28 Rest of Europe 5G Devices Market, 2016 – 2026 (USD Million)
      Fig.29 Asia Pacific 5G Devices Market, 2016 – 2026 (USD Million)
      Fig.30 China 5G Devices Market, 2016 – 2026 (USD Million)
      Fig.31 Japan 5G Devices Market, 2016 – 2026 (USD Million)
      Fig.32 India 5G Devices Market, 2016 – 2026 (USD Million)
      Fig.33 South  Korea 5G Devices Market, 2016 – 2026 (USD Million)
      Fig.34 South-East Asia 5G Devices Market, 2016 – 2026 (USD Million)
      Fig.35 Rest of Asia Pacific 5G Devices Market, 2016 – 2026 (USD Million)
      Fig.36 Latin America 5G Devices Market, 2016 – 2026 (USD Million)
      Fig.37 Brazil 5G Devices Market, 2016 – 2026 (USD Million)
      Fig.38 Mexico 5G Devices Market, 2016 – 2026 (USD Million)
      Fig.39 Rest of Latin America 5G Devices Market, 2016 – 2026 (USD Million)
      Fig.40 The Middle-East and Africa 5G Devices Market, 2016 – 2026 (USD Million)
      Fig.41 GCC Countries 5G Devices Market, 2016 – 2026 (USD Million)
      Fig.42 South Africa 5G Devices Market, 2016 – 2026 (USD Million)
      Fig.43 Rest of Middle-East Africa 5G Devices Market, 2016 – 2026 (USD Million)
      Fig.44 Competitor Market Share – Revenue
      Fig.45 Verizon Communications Revenue and Growth Rate
      Fig.46 Verizon Communications Market Share
      Fig.47 Analog Devices Revenue and Growth Rate
      Fig.48 Analog Devices Market Share
      Fig.49 NEC Revenue and Growth Rate
      Fig.50 NEC Market Share
      Fig.51 Cavium Revenue and Growth Rate
      Fig.52 Cavium Market Share
      Fig.53 Huawei Revenue and Growth Rate
      Fig.54 Huawei Market Share
      Fig.55 Cisco Revenue and Growth Rate
      Fig.56 Cisco Market Share
      Fig.57 Intel Revenue and Growth Rate
      Fig.58 Intel Market Share
      Fig.59 Nokia Revenue and Growth Rate
      Fig.60 Nokia Market Share
      Fig.61 Leapfrog 5G Devices Revenue and Growth Rate
      Fig.62 Leapfrog 5G Devices Market Share
      Fig.63 Qorvo Revenue and Growth Rate
      Fig.64 Qorvo Market Share
      Fig.65 Ericsson Revenue and Growth Rate
      Fig.66 Ericsson Market Share
      Fig.67 Samsung Revenue and Growth Rate
      Fig.68 Samsung Market Share
      Fig.69 SK Telecom Revenue and Growth Rate
      Fig.70 SK Telecom Market Share
      Fig.71 ZTE Revenue and Growth Rate
      Fig.72 ZTE Market Share
      Fig.73 Korea Telecom Revenue and Growth Rate
      Fig.74 Korea Telecom Market Share
      Fig.75 Mediatek Revenue and Growth Rate
      Fig.76 Mediatek Market Share
      Fig.77 MACOM Revenue and Growth Rate
      Fig.78 MACOM Market Share
      Fig.79 T-Mobile Revenue and Growth Rate
      Fig.80 T-Mobile Market Share
      Fig.81 Market Dynamics
      Fig.82 Global 5G Devices – Value Chain Analysis
      Fig.83 Key Mandates and Regulations
      Fig.84 Technology Roadmap and Timeline
      Fig.85 Market Attractiveness Analysis – By Device Type
      Fig.86 Market Attractiveness Analysis – By Frequency Band
      Fig.87 Market Attractiveness Analysis – By End User
      Fig.88 Market Attractiveness Analysis – By Region
      Fig.89 5G Devices Industrial Chain Analysis
      Fig.90 Market Channels
      Fig.91 Marketing Channel Development Trend
      Fig.92 Growth in World Gross Product, 2008-2018
      

      List of Tables

      Table 1 Global 5G Devices Market, 2019 & 2026 (USD Million)
      Table 2 Global 5G Devices Market, by Device Type, 2016 – 2026 (USD Million)
      Table 3 Global 5G Devices Market, by Frequency Band, 2016 – 2026 (USD Million)
      Table 4 Global 5G Devices Market, by End User, 2016 – 2026 (USD Million)
      Table 5 Global 5G Devices Market, by Region, 2016 – 2026 (USD Million)
      Table 6 North America 5G Devices Market, by Country, 2016 – 2026 (USD Million)
      Table 7 North America 5G Devices Market, by Device Type, 2016 – 2026 (USD Million)
      Table 8 North America 5G Devices Market, by Frequency Band, 2016 – 2026 (USD Million)
      Table 9 North America 5G Devices Market, by End User, 2016 – 2026 (USD Million)
      Table 10 Europe 5G Devices Market, by Country, 2016 – 2026 (USD Million)
      Table 11 Europe 5G Devices Market, by Device Type, 2016 – 2026 (USD Million)
      Table 12 Europe 5G Devices Market, by Frequency Band, 2016 – 2026 (USD Million)
      Table 13 Europe 5G Devices Market, by End User, 2016 – 2026 (USD Million)
      Table 14 Asia Pacific 5G Devices Market, by Country, 2016 – 2026 (USD Million)
      Table 15 Asia Pacific 5G Devices Market, by Device Type, 2016 – 2026 (USD Million)
      Table 16 Asia Pacific 5G Devices Market, by Frequency Band, 2016 – 2026 (USD Million)
      Table 17 Asia Pacific 5G Devices Market, by End User, 2016 – 2026 (USD Million)
      Table 18 Latin America 5G Devices Market, by Country, 2016 – 2026 (USD Million)
      Table 19 Latin America 5G Devices Market, by Device Type, 2016 – 2026 (USD Million)
      Table 20 Latin America 5G Devices Market, by Frequency Band, 2016 – 2026 (USD Million)
      Table 21 Latin America 5G Devices Market, by End User, 2016 – 2026 (USD Million)
      Table 22 The Middle-East and Africa 5G Devices Market, by Country, 2016 – 2026 (USD Million)
      Table 23 The Middle-East and Africa 5G Devices Market, by Device Type, 2016 – 2026 (USD Million)
      Table 24 The Middle-East and Africa 5G Devices Market, by Frequency Band, 2016 – 2026 (USD Million)
      Table 25 The Middle-East and Africa 5G Devices Market, by End User, 2016 – 2026 (USD Million)
      Table 26 Global 5G Devices Market - Company Revenue Analysis, 2016 – 2019 (USD Million)
      Table 27 Global 5G Devices Market - Company Revenue Share Analysis, 2016 – 2019 (%)
      Table 28 Acquisitions and Mergers
      Table 29 Market Drivers – Impact Analysis
      Table 30 Market Restraints
      Table 31 Market Opportunities
      Table 32 Major Buyers of 5G Devices
      Table 33 Distributors/Traders of 5G Devices by Region
      

Industry Major Market Players

  • Verizon Communications
  • Analog Devices
  • NEC
  • Cavium
  • Huawei
  • Cisco
  • Intel
  • Nokia
  • Leapfrog 5G Devices
  • Qorvo
  • Ericsson
  • Samsung
  • SK Telecom
  • ZTE
  • Korea Telecom
  • Mediatek
  • MACOM
  • T-Mobile