![]()
Search Market Research Report
Plant-based Meat Market Size, Share Global Analysis Report, 2024 – 2032

Plant-based Meat Market Size, Share, Growth Analysis Report By Product (Burgers, Patties, Grounds, Nuggets, Sausages, and Others), By Sources (Soy, Pea, Wheat, and Others), By Storage (Frozen Plant-Based Meat, Refrigerated Plant-Based Meat, and Shelf-Stable Plant-Based Meat), By End-User (Retail and HORECA), By Distribution Channel (Supermarkets/Hypermarkets, Convenience Stores, Online Retail, and Foodservice Channels), and By Region - Global and Regional Industry Insights, Overview, Comprehensive Analysis, Trends, Statistical Research, Market Intelligence, Historical Data and Forecast 2024 – 2032
Industry Insights
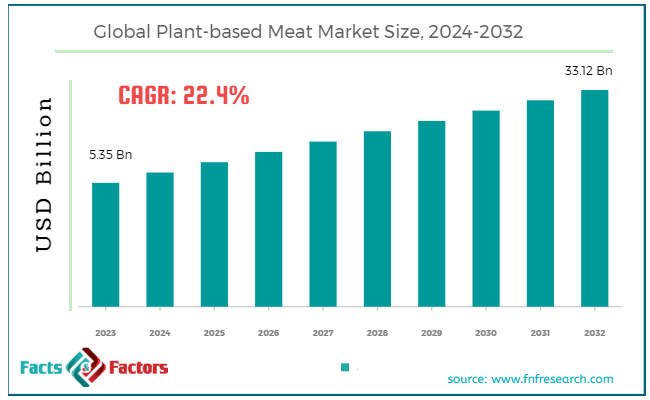
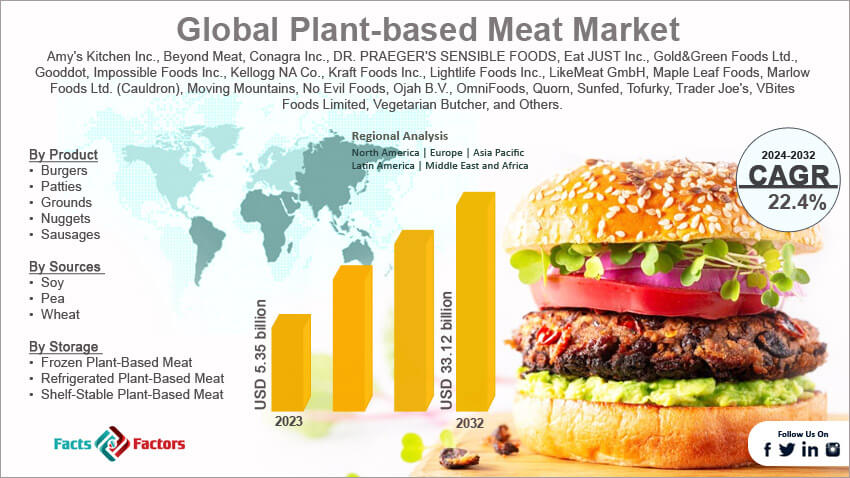
[219+ Pages Report] According to Facts & Factors, the global plant-based meat market size in terms of revenue was valued at around USD 5.35 billion in 2023 and is expected to reach a value of USD 33.12 billion by 2032, growing at a CAGR of roughly 22.4% from 2024 to 2032. The global plant-based meat market is projected to grow at a significant growth rate due to several driving factors.
 Global Plant Based Meat Market: Overview
Plant-based meat refers to food products designed to replicate the taste, texture, and nutritional value of animal meat but made entirely from plant ingredients. These products are typically made using a combination of plant proteins (such as soy, pea, and wheat), fats, vitamins, minerals, and natural flavors to mimic the sensory experience of eating traditional meat. The goal of plant-based meat is to provide an alternative for people looking to reduce their meat consumption for health, environmental, or ethical reasons.
The plant-based meat market has experienced rapid growth in recent years, driven by increasing consumer interest in sustainable and healthy food options, technological advancements in food production, and a rising number of individuals adopting vegetarian, vegan, or flexitarian diets. The market includes a variety of products such as plant-based burgers, sausages, nuggets, and mince, which are widely available in supermarkets, restaurants, and fast-food chains.
Key Highlights
- The plant-based meat market has registered a CAGR of 22.4% during the forecast period.
- In terms of revenue, the global plant-based meat market was estimated at roughly USD 5.35 billion in 2023 and is predicted to attain a value of USD 33.12 billion by 2032.
- The plant-based meat market is poised for substantial growth, driven by rising health and environmental consciousness, technological advancements, and increasing consumer demand for sustainable and healthier food options.
- On the basis of Product, the burgers segment is growing at a high rate and is projected to dominate the global market.
- In terms of sources, the soy segment is expected to dominate the global market during the forecast period.
- Based on the End-User, the HORECA segment is projected to swipe the largest market share.
- By region, North America dominates the market due to high consumer awareness, strong presence of major market players, and widespread availability of plant-based meat products in retail and foodservice sectors.
Growth Drivers:
- Rising Health Consciousness: Increasing awareness of the health benefits associated with reducing meat consumption, such as lower risks of heart disease, obesity, and certain cancers, is driving consumers towards plant-based meat products. These products are often perceived as healthier alternatives due to their lower levels of saturated fats and cholesterol. This shift in consumer preference towards healthier dietary options significantly boosts the demand for plant-based meat products
- Environmental Concerns: The environmental impact of traditional meat production, including high greenhouse gas emissions, deforestation, and extensive water usage, has led to a growing interest in sustainable food alternatives. Plant-based meats generally require fewer resources to produce and have a smaller environmental footprint.
- Changing Consumer Preferences: There's a growing trend towards flexitarianism and vegetarianism, leading to increased demand for plant-based alternatives.
- Technological Advancements: Significant advancements in food technology have improved the taste, texture, and nutritional profile of plant-based meat products. Techniques such as extrusion and fermentation are used to create products that closely mimic the characteristics of traditional meat. These technological innovations enhance consumer satisfaction and acceptance, further propelling the adoption of plant-based meat products.
- Celebrity Endorsements and Increased Accessibility: With growing celebrity support and wider availability in supermarkets and restaurants, plant-based meat is becoming more mainstream.
Restraints:
- High Production Costs: Producing plant-based meat products involves advanced technologies and high-quality ingredients, which can result in higher production costs compared to traditional meat. These costs are often passed on to consumers, making plant-based options more expensive. The higher price point can deter price-sensitive consumers, limiting the overall market growth.
- Cultural and Taste Preferences: Traditional meat has been a staple in many diets worldwide, and cultural preferences and tastes for conventional meat can be deeply ingrained. This can make it challenging for plant-based meat products to gain widespread acceptance. Resistance to changing dietary habits and preferences for the taste of real meat can slow down the adoption rate of plant-based alternatives.
Opportunities:
- Cost-Effective Production Methods Development: Research and development efforts focused on improving production efficiency and reducing costs can make plant-based meat products more affordable. Innovations in ingredient sourcing and processing technologies can contribute to cost reductions.
- Expansion into Emerging Markets: Emerging markets present significant growth opportunities due to rising disposable incomes, urbanization, and increasing awareness of health and environmental issues. Targeted marketing and distribution strategies can help tap into these markets.
- Sustainability Focus: Highlighting the environmental benefits of plant-based meat can attract eco-conscious consumers.
Challenges:
- Competition: The plant-based meat market is becoming increasingly crowded, with competition from established food companies and new startups.
- Consumer Perception: Some consumers may still have negative perceptions about the health or taste of plant-based meats.
- Regulations: Evolving regulations around labeling and ingredients for plant-based products can create challenges for manufacturers.
Plant Based Meat Market: Segmentation Analysis
The global plant-based meat market is segmented based on product, sources, storage, end-user, distribution channel, and region
By Product Insights
Based on Product, the global plant-based meat market is divided into burgers, patties, grounds, nuggets, sausages, and others. Plant-based burgers segment has held a market share of around 29.11% in 2023. Burger segment is one of the most popular and well-established segments in the plant-based meat market. They are designed to closely mimic the taste and texture of traditional beef burgers. Increasing consumer demand for healthier and more sustainable alternatives to beef burgers drives the growth of this segment??. Many fast-food chains and restaurants have added plant-based burgers to their menus, significantly boosting market visibility and acceptance?.
Plant-based patties, often used interchangeably with burgers, refer to the standalone product that can be used in various recipes beyond just burgers. Patties are versatile and can be used in different culinary applications, appealing to both home cooks and professional chefs??. Growing awareness of health benefits associated with plant-based diets fuels demand for plant-based patties??.
Plant-based grounds segment is minced or ground products designed to mimic ground beef, used in a variety of dishes such as tacos, spaghetti, and chili. Plant-based grounds offer flexibility for various recipes, making them a popular choice among consumers seeking meat alternatives?. These products often offer similar or enhanced nutritional profiles compared to ground meat, attracting health-conscious consumers?.
Plant-based nuggets are designed to replicate traditional chicken nuggets, targeting both children and adults who seek convenient and familiar snack options. Nuggets are convenient and easy to prepare, appealing to busy consumers looking for quick meal solutions??.
Plant-based sausages are designed to mimic traditional pork or beef sausages, available in various flavors and styles, including breakfast sausages and grilling sausages. The availability of various flavors and styles makes plant-based sausages appealing to a wide range of consumers?.
By Sources Insights
On the basis of Sources, the global plant-based meat market is bifurcated into soy, pea, wheat, and others. Soy has been one of the most commonly used sources for plant-based meat products due to its high protein content and versatility. Soy-based products are known for their ability to closely mimic the texture and taste of traditional meat. Soy is rich in protein, essential amino acids, and other nutrients, making it an excellent meat substitute for health-conscious consumers??. Soy is used in a wide range of plant-based meat products, including burgers, sausages, and deli slices?.
Pea protein has gained popularity as a key ingredient in plant-based meat products due to its hypoallergenic properties and high protein content. It is especially favored by consumers seeking soy-free alternatives. Pea protein is hypoallergenic, making it suitable for consumers with soy or gluten allergies?. Pea cultivation is generally considered more sustainable and environmentally friendly compared to other crops??.
Wheat protein, especially seitan, is another popular source used in plant-based meat products. It is known for its ability to replicate the chewy texture of meat, making it a preferred choice for certain types of plant-based meat products. Wheat protein provides a meat-like texture that is difficult to achieve with other plant proteins??. Wheat protein is relatively inexpensive to produce, making it an attractive option for manufacturers and consumers alike.
By Storage Insights
Based on Storage, the global plant-based meat market is categorized into frozen plant-based meat, refrigerated plant-based meat, and shelf-stable plant-based meat. Frozen plant-based meat products are designed for long-term storage and include items like burgers, sausages, and grounds. They are typically available in supermarkets and grocery stores. Frozen products have a longer shelf life compared to refrigerated or shelf-stable items, reducing waste and making them convenient for consumers who shop infrequently?.
Refrigerated plant-based meat products are designed for short-term storage and are typically found in the refrigerated sections of grocery stores. This category includes fresh plant-based burgers, sausages, and deli slices. Consumers often perceive refrigerated products as fresher and more appealing compared to frozen or shelf-stable options??. These products are ready to cook and consume, offering convenience for consumers looking for quick meal solutions??.
Shelf-stable plant-based meat products segment do not require refrigeration and include items like jerky, canned meats, and ready-to-eat meals. These products are designed for long-term storage and convenience. Shelf-stable products are highly convenient and portable, making them ideal for on-the-go consumption, travel, and emergency food supplies??.
By End-User Insights
By End-User, the global plant-based meat market is bifurcated into retail and HORECA. The retail segment encompasses grocery stores, supermarkets, hypermarkets, and online retail platforms where consumers purchase plant-based meat products for home consumption. Increasing consumer demand for convenient and healthy food options drives growth in the retail segment. Shoppers are looking for plant-based alternatives that they can easily prepare at home??.
HORECA segment holds the largest share of the global plant-based meat market. This segment has held a market share of around 59.32% in 2023. HORECA (Hotels, Restaurants, and Catering) segment includes food service establishments such as hotels, restaurants, cafes, and catering services that offer plant-based meat dishes to consumers. Restaurants and hotels are diversifying their menus to include plant-based options, catering to the growing number of consumers seeking vegetarian and vegan meals??.
By Distribution Channel Insights
In terms of Distribution Channel, the global plant-based meat market is categorized into supermarkets/hypermarkets, convenience stores, online retail, and foodservice channels. Supermarkets and hypermarkets are major retail channels for plant-based meat products, offering a wide variety of options to consumers. These stores provide a broad selection of plant-based meat products, catering to diverse consumer preferences??. Supermarkets and hypermarkets attract large numbers of shoppers, increasing the visibility and accessibility of plant-based meat products?.
Convenience stores segment cater to consumers seeking quick and easy meal solutions, including ready-to-eat plant-based meat products. These stores are typically located in easily accessible areas, making it convenient for consumers to purchase plant-based meat products on the go??.
Online retail platforms have become increasingly important for distributing plant-based meat products, offering consumers the convenience of home delivery and a wide range of options. The rapid growth of e-commerce platforms has made it easier for consumers to purchase plant-based meat products online??. Online retailers often offer a broader selection of products compared to physical stores, including niche and specialty items??.
Foodservice channels segment, including restaurants, cafes, and catering services, are significant distributors of plant-based meat products, offering them as part of their menus. Increasing consumer interest in plant-based diets drives restaurants and foodservice providers to include these options on their menus??. The foodservice industry’s focus on sustainability and reducing environmental impact supports the adoption of plant-based meat products??.
Recent Developments:
- In October 2022 - Plant-based pioneer Beyond Meat launched Beyond SteakTM, a product aiming to replicate the taste and texture of seared steak. This launch signifies advancements in technology for replicating meat characteristics, potentially attracting new consumers seeking plant-based alternatives with a familiar meat experience.
- In June 2022 - Conagra Brands, a major food company, expanded its Gardein brand with a new Pea & Wheat Plant-Based Chicken line. This move indicates established players recognizing the growing demand for diverse plant-based options beyond burgers.
- In March 2022 - Valio Oy, a Finnish company, acquired Gold & Green Foods Oy. This strategic move strengthens Valio's position in the Finnish plant-based food market and suggests their ambitions for international growth. The acquisition might also signal potential consolidation within the plant-based sector as larger players seek to expand their market share.
Report Scope
Report Attribute |
Details |
Market Size in 2023 |
USD 5.35 Billion |
Projected Market Size in 2032 |
USD 33.12 Billion |
CAGR Growth Rate |
22.4% CAGR |
Base Year |
2023 |
Forecast Years |
2024-2032 |
Key Market Players |
Amy's Kitchen Inc., Beyond Meat, Conagra Inc., DR. PRAEGER'S SENSIBLE FOODS, Eat JUST Inc., Gold&Green Foods Ltd., Gooddot, Impossible Foods Inc., Kellogg NA Co., Kraft Foods Inc., Lightlife Foods Inc., LikeMeat GmbH, Maple Leaf Foods, Marlow Foods Ltd. (Cauldron), Moving Mountains, No Evil Foods, Ojah B.V., OmniFoods, Quorn, Sunfed, Tofurky, Trader Joe's, VBites Foods Limited, Vegetarian Butcher, and Others. |
Key Segment |
By Product, By Sources, By Storage, By End-User, By Distribution Channel, and By Region |
Major Regions Covered |
North America, Europe, Asia Pacific, Latin America, and the Middle East &, Africa |
Purchase Options |
Request customized purchase options to meet your research needs. Explore purchase options |
Plant Based Meat Market: Regional Analysis
- North America dominates the global market during forecast period
North America dominates the plant-based meat market, accounting for approximately 37.12% of the total market revenue in 2023. The plant-based meat market in North America is experiencing significant growth, driven by high consumer awareness and acceptance of plant-based diets. This region benefits from substantial investments in research and development and robust marketing campaigns by key industry players like Beyond Meat and Impossible Foods. These companies have established a strong market presence through extensive product offerings and distribution networks. The market's expansion is also supported by increasing health and wellness trends, which highlight the benefits of plant-based diets for health, animal welfare, and environmental sustainability.
In Europe, the plant-based meat market is also growing robustly, supported by strong regulatory frameworks promoting sustainable and healthy food choices and a high level of consumer awareness. Countries such as Germany, the UK, and the Netherlands are leading the charge with high acceptance of plant-based diets. The market growth is further driven by the expanding availability of plant-based meat products in supermarkets and specialty stores.
The Asia-Pacific region is witnessing rapid growth in the plant-based meat market, propelled by increasing urbanization, rising disposable incomes, and growing awareness of health and environmental issues. Countries like China, India, and Japan are at the forefront, with a notable shift towards healthier and environmentally sustainable diets. The market's expansion is supported by the rapid increase in both traditional and online retail channels offering plant-based products.
Latin America is emerging as a promising market for plant-based meat products, driven by a growing consumer interest in health and sustainability. Urbanization and increased availability of plant-based products in urban areas are significant factors contributing to this growth. Countries like Brazil and Mexico hold substantial untapped potential.
The Middle East & Africa region is gradually adopting plant-based meat products, supported by economic growth, increasing health consciousness, and a growing expatriate population with diverse dietary preferences. Rising disposable incomes and a young population interested in health and wellness trends further drive the market.
Plant Based Meat Market: Competitive Landscape
Some of the main competitors dominating the global plant-based meat market include;
- Amy's Kitchen, Inc.
- Beyond Meat
- Conagra Inc.
- DR. PRAEGER'S SENSIBLE FOODS
- Eat JUST Inc.
- Gold&Green Foods Ltd.
- Gooddot
- Impossible Foods Inc.
- Kellogg NA Co.
- Kraft Foods Inc.
- Lightlife Foods Inc.
- LikeMeat GmbH
- Maple Leaf Foods
- Marlow Foods Ltd. (Cauldron)
- Moving Mountains
- No Evil Foods
- Ojah B.V.
- OmniFoods
- Quorn
- Sunfed
- Tofurky
- Trader Joe's
- VBites Foods Limited
- Vegetarian Butcher
The global plant-based meat market is segmented as follows:
By Product Segment Analysis
- Burgers
- Patties
- Grounds
- Nuggets
- Sausages
- Others
By Sources Segment Analysis
- Soy
- Pea
- Wheat
- Others
By Storage Segment Analysis
- Frozen Plant-Based Meat
- Refrigerated Plant-Based Meat
- Shelf-Stable Plant-Based Meat
By End-User Segment Analysis
- Retail
- HORECA
By Distribution Channel Segment Analysis
- Supermarkets/Hypermarkets
- Convenience Stores
- Online Retail
- Foodservice Channels
By Regional Segment Analysis
- North America
- The U.S.
- Canada
- Mexico
- Europe
- France
- The UK
- Spain
- Germany
- Italy
- Rest of Europe
- Asia Pacific
- China
- Japan
- India
- Australia
- Southeast Asia
- Rest of Asia Pacific
- The Middle East & Africa
- Saudi Arabia
- UAE
- Egypt
- Kuwait
- South Africa
- Rest of the Middle East & Africa
- Latin America
- Brazil
- Argentina
- Rest of Latin America
Industry Major Market Players
- Amy's Kitchen Inc.
- Beyond Meat
- Conagra Inc.
- DR. PRAEGER'S SENSIBLE FOODS
- Eat JUST Inc.
- Gold&Green Foods Ltd.
- Gooddot
- Impossible Foods Inc.
- Kellogg NA Co.
- Kraft Foods Inc.
- Lightlife Foods Inc.
- LikeMeat GmbH
- Maple Leaf Foods
- Marlow Foods Ltd. (Cauldron)
- Moving Mountains
- No Evil Foods
- Ojah B.V.
- OmniFoods
- Quorn
- Sunfed
- Tofurky
- Trader Joe's
- VBites Foods Limited
- Vegetarian Butcher
Frequently Asked Questions


Copyright © 2025 - 2026, All Rights Reserved, Facts and Factors