![]()
Search Market Research Report
Data Visualization Market Size, Share Global Analysis Report, 2022 – 2028

Data Visualization Market Size, Share, Growth Analysis Report By Solution (Embedded Data Visualization Module, and Standalone Visualization Software), By Component (Services, and Software), By Industry (BFSI, Government, Information Technology, Education, Real Estate, Manufacturing, and Others), By Enterprise Size (Small & Medium Size, and Large-Scale), and By Region - Global and Regional Industry Insights, Overview, Comprehensive Analysis, Trends, Statistical Research, Market Intelligence, Historical Data and Forecast 2022 – 2028
Industry Insights
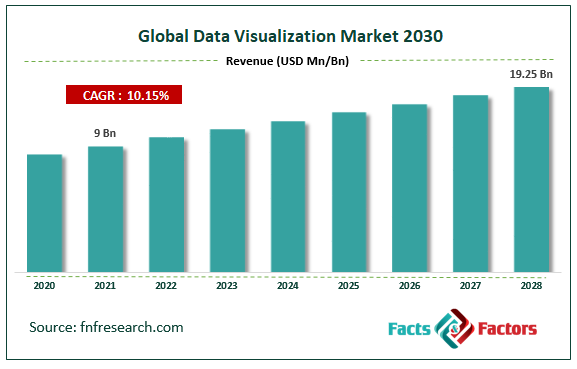
[213+ Pages Report] According to Facts and Factors, the global data visualization market size was worth around USD 9 billion in 2021 and is predicted to grow to around USD 19.25 billion by 2028 with a compound annual growth rate (CAGR) of roughly 10.15% between 2022 and 2028. The report analyzes the global data visualization market drivers, restraints/challenges, and the effect they have on the demands during the projection period. In addition, the report explores emerging opportunities in the data visualization market.
 Market Overview
Data visualization is the interdisciplinary field of representing collected data or information graphically. Over time, data visualization has become a more effective way of communicating information since it makes data interpretation and analysis easier, especially in the case of the presence of large or numerous data, for instance, a time series. The field also entails the in-depth study of visual representation of abstract data to aid human cognition reinforcement. The abstract data consists of non-numerical, for instance, geographic information or text, and numerical information. Data visualization thus produced related to scientific visualization and infographics. The core of data visualization can be found in statistics and many scholars in this field also sometimes referred to it as descriptive statistics. However, data visualization is more complicated than it seems since it requires expertise in computer, statistical, and design skills to create an accurate and productive graphical representation of the vast information generated. The end goal of data visualization is to deliver substantial and productive results or analysis that can help the business make strategic or profitable decisions and strengthen the profile of the organization or any other entity that uses the advanced field of statistics.
Key Insights
- As per the analysis shared by our research analyst, the global data visualization market is estimated to grow annually at a CAGR of around 10.15% over the forecast period (2022-2028).
- In terms of revenue, the global data visualization market size was valued at around USD 9 billion in 2021 and is projected to reach USD 19.25 billion, by 2028. Due to a variety of driving factors, the market is predicted to rise at a significant rate.
- Based on solution segmentation, the embedded data visualization module was predicted to show maximum market share in the year 2021
- Based on industry segmentation, information technology was the leading revenue-generating industry in 2021.
- On the basis of region, North America was the leading revenue generator in 2021
Covid-19 Impact:
The global market cap was highly influenced by the onset of Covid-19 owing to the vast unorganized data that emerged due to uncertain and critical situations that affected the global economy during this time. All small to large-scale businesses were severely impacted during this time and business leaders were looking for options to track the revenues and losses and make useful derivations from the analysis leading to a high adoption rate of the field.
Growth Drivers
- Growing businesses and transactions to propel market growth
The global data visualization market is projected to grow owing to the number of businesses and the corresponding transactions resulting in the generation of billions of data pertaining to costs, revenues, expenses, profits, and losses. In the past, since there was limited digital data it was relatively easier to maintain and analyze the information. However, with digitization, information load has considerably increased resulting in companies adopting higher technology to help them interpret the information and make useful decisions out of it. For instance, as per a 2018 report, more than 33 zettabytes of information were created, consumed, and copied across the globe.
Restraints
- High cost of installation and maintenance to restrict the market growth
The software and services associated with data visualization are high in cost. Although there are some versions of the technology that can be used, it is limited to companies or organizations with a lesser number of information that does not require advanced analytics. However, for companies that deal with a huge amount of digital information, the advanced systems help data visualization become a necessary tool which may result in high total cost to the company restricting its adoption.
Opportunities
- Growing advances in data visualization to provide expansion scenarios
Various companies providing data visualization and corresponding services are regularly upgrading their products to keep up with the growing demands of users. This also involves strategic decisions like mergers and acquisitions to help the businesses to expand their global footprint. For instance, in August 2019, Tableau Software, LLC was acquired by Salesforce.com Inc, allowing the company to use artificial intelligence for delivering data visualization insights to its customers.
Challenges
- Generating confidence about the benefits of the technology to challenge market growth
Any cost-center system can benefit only if it has a high return on investment (ROI) otherwise the company may deem it as an unnecessary cause resulting in the complete discard of the technology. It is important that data visualization service companies provide effective reasoning about the benefits of the technology and how exactly the use of the systems translate to high profits or lowered losses. The stronger the confidence amongst the users that the use of technology is positively impacting the business, the higher will be the acceptance rate of the systems.
Segmentation Analysis
- The global data visualization market is segmented based on solution, component, industry, enterprise size, and region.
Based on the solution, the global market is segmented into embedded data visualization module and standalone visualization software. Embedded modules are systems that come with the technology in its entirety including the application programming interface and related software plug-ins. For instance, a survey by analytics and business intelligence concluded that more than 85% of users prefer embedded systems of one single technology over standalone applications.
Based on component, the global market segments are services and software. During the projection period, the software is projected to have a hold over more than 50% of the global market since many companies may have their teams to work on the part of the services unless for extremely exclusive problems that can be dealt with only by the teams from the software companies.
Based on industry, the global market divides into banking, financial services, and insurance (BFSI), government, information technology, education, real estate, manufacturing, and others. The most dominant segment is information technology since they deal with immense and critical information regularly allowing them to have access to new and different patterns and errors. Further growth in the IT sector is projected to help with the segmental growth. For example, the Indian IT sector reached a market value of USD 22.65 billion in the fiscal year 2022.
Based on enterprise size, the global market is segmented into small & medium size and large scale where the highest adoption rate was witnessed in large-scale industries. In India, for a company to be deemed as large scale, it needs to have fixed assets worth INR 10 crore
Recent Developments:
- In February 2019, DataRobot Inc., and QlikTech International entered a collaboration to integrate the platform of DataRobot with the automated machine learning modeling by QlikTech. This move is intended to help the consumers with predictive information for better decision making
- In January 2020, RoX AI was acquired by QlikTech International AB which helped the company strengthen its global footprint along with access to its consumers with the tool to manage business data proactively and in real-time.
Report Scope
Report Attribute |
Details |
Market Size in 2021 |
USD 9 Billion |
Projected Market Size in 2028 |
USD 19.25 Billion |
CAGR Growth Rate |
10.15% CAGR |
Base Year |
2021 |
Forecast Years |
2022-2028 |
Key Market Players |
Highsoft AS, Alteryx Inc., Dundas Data Visualization Inc., ChartBlocks Ltd., Microsoft Corporation, IBM Corporation, Looker Data Sciences, Cluvio GmbH, QlikTech Corporation, and Others |
Key Segment |
By Solution, Component, Industry, Enterprise Size, and Region |
Major Regions Covered |
North America, Europe, Asia Pacific, Latin America, and the Middle East &, Africa |
Purchase Options |
Request customized purchase options to meet your research needs. Explore purchase options |
Regional Analysis
- North America to lead the market growth in the coming years
The global data visualization market is projected to grow with the highest CAGR in North America owing to the high penetration of data visualization techniques across industries as a direct consequence of the advanced overall economy. The growing number of businesses and the corresponding data are projected to help regional growth. In the last quarter of 2021, the USA witnessed an addition of more than 4,00,000 new companies. As per Statista, in March 2021, more than 8,40,000 businesses were less than 1 year old in the country. This data is indicative of the growing economy and the subsequent increase in the need for tools for analyzing the information generated from such activities. Asia-Pacific is also projected to register subsequent revenue because of the infrastructure of economies like India, China, Japan, and others.
Competitive Analysis
- Highsoft AS
- Alteryx Inc.
- Dundas Data Visualization Inc.
- ChartBlocks Ltd.
- Microsoft Corporation
- IBM Corporation
- Looker Data Sciences
- Cluvio GmbH
- QlikTech Corporation
The global data visualization market is segmented as follows:
By Solution
- Embedded Data Visualization Module
- Standalone Visualization Software
By Component
- Services
- Software
By Industry
- BFSI
- Government
- Information Technology
- Education
- Real Estate
- Manufacturing
- Others
By Enterprise Size
- Small & Medium Size
- Large-Scale
By Regional Segment Analysis
- North America
- The U.S.
- Canada
- Mexico
- Europe
- France
- The UK
- Spain
- Germany
- Italy
- Nordic Countries
- Denmark
- Sweden
- Norway
- Benelux Union
- Belgium
- The Netherlands
- Luxembourg
- Rest of Europe
- Asia Pacific
- China
- Japan
- India
- Australia
- South Korea
- Southeast Asia
- Indonesia
- Thailand
- Malaysia
- Singapore
- Rest of Southeast Asia
- Rest of Asia Pacific
- The Middle East & Africa
- Saudi Arabia
- UAE
- Egypt
- South Africa
- Rest of the Middle East & Africa
- Latin America
- Brazil
- Argentina
- Rest of Latin America
Industry Major Market Players
- Highsoft AS
- Alteryx Inc.
- Dundas Data Visualization Inc.
- ChartBlocks Ltd.
- Microsoft Corporation
- IBM Corporation
- Looker Data Sciences
- Cluvio GmbH
- QlikTech Corporation


Copyright © 2025 - 2026, All Rights Reserved, Facts and Factors