07-Sep-2022 | Facts and Factors
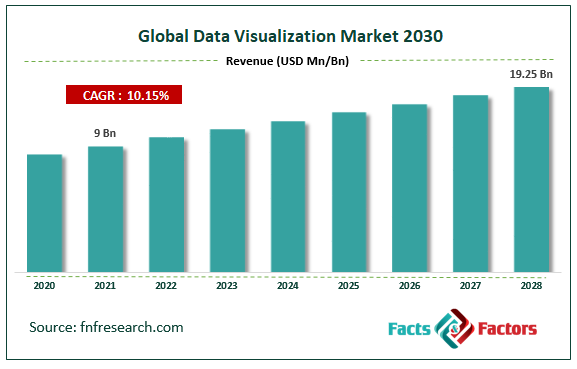
According to Facts and Factors, the global data visualization market size was worth around USD 9 billion in 2021 and is predicted to grow to around USD 19.25 billion by 2028 with a compound annual growth rate (CAGR) of roughly 10.15% between 2022 and 2028.
Data visualization is the process of translating raw information into visual objects like lines, graphs, plots, maps, and other forms. As per studies, to come to a conclusion that results in positive outcomes, it is essential for the human brain to accurately comprehend the meaning of the information present in front of them without much delay. This is possible with the help of data visualization since it acts as a powerful communication tool. It is known that the human mind can understand information when it is correctly presented and in a matter that holds their attention for a long time, which becomes impossible in the presence of vast information without any tool to correctly explore the true meaning of the data. Only when figures or numbers are presented correctly in a way that is easily understood, can the human mind make sense of what the data truly represents resulting in favorable conclusions and subsequent decisions. The growing number of unstructured and unorganized data resulted in companies, both public and private, looking for options that can aid data interpretation and reading for the business leader to make the right decisions for the survival of the business entity.
Browse the full “Data Visualization Market Size, Share, Growth Analysis Report By Solution (Embedded Data Visualization Module, and Standalone Visualization Software), By Component (Services, and Software), By Industry (BFSI, Government, Information Technology, Education, Real Estate, Manufacturing, and Others), By Enterprise Size (Small & Medium Size, and Large-Scale), and By Region - Global and Regional Industry Insights, Overview, Comprehensive Analysis, Trends, Statistical Research, Market Intelligence, Historical Data and Forecast 2022 – 2028" report at https://www.fnfresearch.com/data-visualization-market
Covid-19 resulted in a higher adopted trend for the technology during 2020 and 2021. This was a direct consequence of the sudden explosion of heavy data that was generated not only in the healthcare sector but also in the research and pharmaceutical companies along with the necessity of reorganizing future plans of the businesses that incurred heavy losses during this time.
The global data visualization market cap is anticipated to grow owing to the rising number of players in the market along with the requirement for high visualization techniques. For some commercial or government organizations, basic visualization tools act as a saving factor however there is a surge in demand for advanced tools associated with graphical visualization of information. With the rise of artificial intelligence and machine learning, more companies are adopting the advancing technologies in decision-making since these tools have proven to be effective time again in saving businesses from incurring losses. In 2019, Deloitte Touche Tohmatsu Ltd., launched a, now popular, public data visualization tool which works on machine learning, AI, algorithm, blockchain, and other advanced sub-tools.
The high cost of installation and maintenance may restrict the global market growth while growing advances in data visualization are projected to provide expansion scenarios. The global market may face challenges in generating confidence about the benefits of the technology.
The global data visualization market is segmented based on solution, component, industry, enterprise size, and region.
Based on the solution, the global market is segmented into embedded data visualization module and standalone visualization software. Embedded modules are systems that come with the technology in its entirety including the application programming interface and related software plug-ins. For instance, a survey by analytics and business intelligence concluded that more than 85% of users prefer embedded systems of one single technology over standalone applications.
Based on component, the global market segments are services and software. During the projection period, the software is projected to have a hold over more than 50% of the global market since many companies may have their teams to work on the part of the services unless for extremely exclusive problems that can be dealt with only by the teams from the software companies.
Based on industry, the global market divides into banking, financial services, & insurance (BFSI), government, information technology, education, real estate, manufacturing, and others. The most dominant segment is information technology since they deal with immense and critical information regularly allowing them to have access to new and different patterns and errors. Further growth in the IT sector is projected to help with the segmental growth. For example, the Indian IT sector reached a market value of USD 22.65 billion in the fiscal year 2022.
Based on enterprise size, the global market is segmented into small & medium size and large scale where the highest adoption rate was witnessed in large-scale industries. In India, for a company to be deemed as large scale, it needs to have fixed assets worth INR 10 crore
North America is anticipated to generate the highest revenue in the global data visualization market in the coming years because of the presence of a vast number of large-scale companies which are the major consumers of the technology currently. The regional market may also benefit from the rising trend of investments in data visualization technology from industry giants in start-ups to encourage growth in the field which also ultimately helps them in expansion. The rise in Asia-Pacific is projected to be a direct result of growth in the information technology sector in countries like China, India, Singapore, Japan, etc. The IT sector in the region is projected to reach over USD 675 billion by the end of 2022 while growing by 6.2% from the previous year.
Report Scope
Report Attribute |
Details |
Market Size in 2021 |
USD 9 Billion |
Projected Market Size in 2028 |
USD 19.25 Billion |
CAGR Growth Rate |
10.15% CAGR |
Base Year |
2021 |
Forecast Years |
2022-2028 |
Key Market Players |
Highsoft AS, Alteryx Inc., Dundas Data Visualization Inc., ChartBlocks Ltd., Microsoft Corporation, IBM Corporation, Looker Data Sciences, Cluvio GmbH, QlikTech Corporation, and Others |
Key Segment |
By Solution, Component, Industry, Enterprise Size, and Region |
Major Regions Covered |
North America, Europe, Asia Pacific, Latin America, and the Middle East &, Africa |
Purchase Options |
Request customized purchase options to meet your research needs. Explore purchase options |
The global data visualization market is led by players like Highsoft AS, Alteryx Inc., Dundas Data Visualization, Inc., ChartBlocks Ltd., Microsoft Corporation, IBM Corporation, Looker Data Sciences, Cluvio GmbH, and QlikTech Corporation
Recent Developments:
- In August 2022, Revel, the owner of the most successful visualization tool called eDiscovery platform, launched Streams, a new and advanced data visualization engine which is powered by Reveal AI. This has helped the company raise the bar in the global market by creating a communication channel that uses AI to understand concepts, patterns, and anomalies.
- In August 2022, Observable, a data visualization platform, launched the Free Teams tier which allows users to create free teams on the data visualization platform and collaborate in real-time. The launch aims to help reduce the barriers faced by people when collaborating while enabling and empowering them to partner with other people without restrictions.
The global data visualization market is segmented as follows:
By Solution
- Embedded Data Visualization Module
- Standalone Visualization Software
By Component
By Industry
- BFSI
- Government
- Information Technology
- Education
- Real Estate
- Manufacturing
- Others
By Enterprise Size
- Small & Medium Size
- Large-Scale
By Region
- North America
- Europe
- France
- The UK
- Spain
- Germany
- Italy
- Nordic Countries
- Benelux Union
- Belgium
- The Netherlands
- Luxembourg
- Rest of Europe
- Asia Pacific
- China
- Japan
- India
- Australia
- South Korea
- Southeast Asia
- Indonesia
- Thailand
- Malaysia
- Singapore
- Rest of Southeast Asia
- Rest of Asia Pacific
- The Middle East & Africa
- Saudi Arabia
- UAE
- Egypt
- South Africa
- Rest of the Middle East & Africa
- Latin America
- Brazil
- Argentina
- Rest of Latin America
About Us:
Facts & Factors is a leading market research organization offering industry expertise and scrupulous consulting services to clients for their business development. The reports and services offered by Facts and Factors are used by prestigious academic institutions, start-ups, and companies globally to measure and understand the changing international and regional business backgrounds. Our client’s/customer’s conviction on our solutions and services has pushed us in delivering always the best. Our advanced research solutions have helped them in appropriate decision-making and guidance for strategies to expand their business.
Contact Us:
Facts & Factors
A 2108, Sargam,
Nanded City,
Sinhagad Road,
Pune 411041, India
USA: +1-347-989-3985
Email: [email protected]
Web: https://www.fnfresearch.com

