Search Market Research Report

Discover Our Latest Reports
Discover Our Featured Reports
Discover Top Selling Reports

Zirconium and Hafnium Market Size, Share Global Analysis Report, 2020–2026

report img

Zirconium and Hafnium Market By Type (Nuclear Grade Zirconium, Industrial Grade Zirconium, Hafnium) By Sales Channel (Direct and Indirect) and By Application (Nuclear Industry, Zircaloy Alloys Industry, Others): Global Industry Outlook, Market Size, Business Intelligence, Consumer Preferences, Statistical Surveys, Comprehensive Analysis, Historical Developments, Current Trends, and Forecast 2020–2026

Industry Insights

The Zirconium and Hafnium market report analyzes and notifies the industry statistics at the global as well as regional and country levels in order to acquire a thorough perspective of the entire Zirconium and Hafnium market. The historical and past insights are provided for FY 2016 to FY 2019 whereas projected trends are delivered for FY 2020 to FY 2026. The quantitative and numerical data is represented in terms of both volume (Tons) and value (USD Million) from FY 2016 – 2026.

This specialized and expertise-oriented industry research report scrutinizes the technical and commercial business outlook of the Zirconium and Hafnium industries. The report analyzes and declares the historical and current trends analysis of the Zirconium and Hafnium industry and subsequently recommends the projected trends anticipated to be observed in the Zirconium and Hafnium market during the upcoming years.

Zirconium and Hafnium Market Size

To know more about this report | Request Free Sample Copy


logoKey Insights from Primary Research

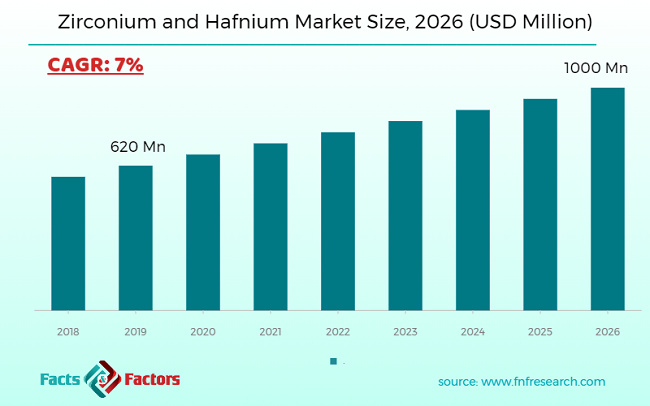
  • As per the details shared by our primary respondents, the Zirconium and Hafnium market is set to grow at a CAGR of around 7%.
  • Through this primary analysis, it was established that the Zirconium and Hafnium market was valued at around USD 620 Million in 2019.
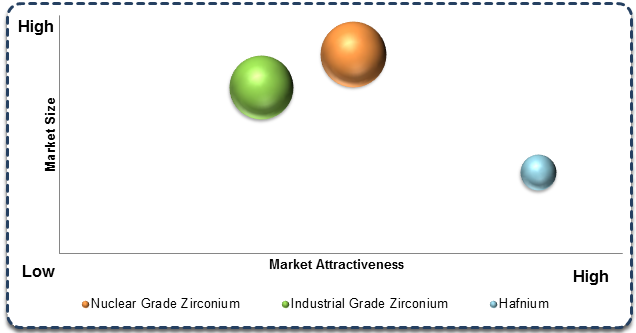
  • The “Industrial Grade Zirconium”, on the basis of type segmentation is expected to dominate the market due to the growing demand for the residential sector across the globe.
  • There would be a huge demand for the Zirconium and Hafnium market in the Asia Pacific region owing to its rising demand in the industry of the nuclear reactor and chemical processing industry.
  • On the basis of application segmentation, the “ Nuclear Industry” is expected to dominate the market.
  • According to the Sales Channel segmentation, the “Direct” sales channel is expected to be the leading revenue generator.

logoKey Recommendations from Analysts

  • As per our analysts, the Zirconium and Hafnium market is witnessing healthy growth owing to the growing demand for a clean source of energy to reduce harm to the environment.
  • The developing countries are hugely investing in nuclear reactors and construction which seeks good opportunities for investments in these sectors.
  • Growing at a CAGR of around 7%, Zirconium and Hafnium provide plentiful opportunities for all of the involved investors across the entire value chain.
  • Owing to the abundant natural resources, the countries of Asia Pacific have good opportunities for extracting Zirconium and Hafnium and can implement it for various applications and can also export it to other companies and gain good business opportunities and profits.
  • Various innovative products and ideas that are implementing zirconium and hafnium are gaining good market size owing to its durability.

logoMarket Attractiveness – By Type

Zirconium and Hafnium Market

To know more about this report | Request Free Sample Copy


The quantitative data is further underlined and reinforced by comprehensive qualitative data which comprises various across-the-board market dynamics. The rationales which directly or indirectly impact the Zirconium and Hafnium industry are exemplified through parameters such as growth drivers, restraints, challenges, and opportunities among other impacting factors.

Throughout our research report, we have encompassed all the proven models and tools of industry analysis and extensively illustrated all the key business strategies and business models adopted in the Zirconium and Hafnium industries. The report provides an all-inclusive and detailed competitive landscape prevalent in the Zirconium and Hafnium markets.

The report utilizes established industry analysis tools and models such as Porter’s Five Forces framework to analyze and recognize critical business strategies adopted by various stakeholders involved in the entire value chain of the Zirconium and Hafnium industries. The Zirconium and Hafnium market report additionally employs SWOT analysis and PESTLE analysis models for further in-depth analysis.

The report study further includes an in-depth analysis of industry players' market shares and provides an overview of leading players' market positions in the Zirconium and Hafnium sectors. Key strategic developments in the Zirconium and Hafnium market competitive landscape such as acquisitions & mergers, inaugurations of different products and services, partnerships & joint ventures, MoU agreements, VC & funding activities, R&D activities, and geographic expansion among other noteworthy activities by key players of the Zirconium and Hafnium market are appropriately highlighted in the report.

The growing demand for Zirconium alloys in nuclear reactor is expected to drive the market as the components of the fuel rod that are used in the nuclear reactor are mainly made of zirconium alloys as zirconium is a ductile metal and has mechanical properties that are similar to titanium and stainless steel. It provides good corrosion resistance and has very low neutron absorption which makes these zirconium alloys favorable in the field of a nuclear reactor.

The Zirconium and Hafnium market research report delivers an acute valuation and taxonomy of the Zirconium and Hafnium industry by practically splitting the market on the basis of different types, applications, and regions. Through the analysis of the historical and projected trends, all the segments and sub-segments were evaluated through the bottom-up approach, and different market sizes have been projected for FY 2020 to FY 2026. The regional segmentation of the Zirconium and Hafnium industry includes the complete classification of all the major continents including North America, Latin America, Europe, Asia Pacific, and the Middle East & Africa. Further, country-wise data for the Zirconium and Hafnium industries is provided for the leading economies of the world.

The Zirconium and Hafnium market is segmented based on Type, Sales Channel, and Application. On the basis of type segmentation, the market is classified into Nuclear Grade Zirconium, Industrial Grade Zirconium, and Hafnium. In terms of Sales Channels, the market is divided into Direct and Indirect. In terms of Application segmentation, the market is bifurcated into Nuclear Industry, Zircaloy Alloys Industry, and Others.

logoReport Scope

Report Attribute

Details

Market Size in 2019

USD 620 Million

Projected Market Size in 2026

USD 1000 Million

CAGR Growth Rate

7% CAGR

Base Year

2019

Forecast Years

2020-2026

Key Market Players

Zirconium and Hafnium market, but not restricted to include Framatome (Areva), Westinghouse Electric Company LLC, ATI, Chepetsky Mechanical Plant, Nuclear Fuel Complex, SNWZH, CNNC Jinghuan, Guangdong Orient Zirconic, Boati Huashen, CITIC Jinzhou Metal.

Key Segment

By Type, By Application, By Sales Channel, By Region

Major Regions Covered

North America, Europe, Asia Pacific, Latin America, and the Middle East & Africa

Purchase Options

Request customized purchase options to meet your research needs. Explore purchase options

The taxonomy of the Zirconium and Hafnium industry by its scope and segmentation is as follows:

logoSome of the essential players operating in the Zirconium and Hafnium market, but not restricted to include

  •  Framatome (Areva)
  •  Westinghouse Electric Company LLC
  •  ATI
  •  Chepetsky Mechanical Plant
  •  Nuclear Fuel Complex
  •  SNWZH
  •  CNNC Jinghuan
  •  Guangdong Orient Zirconic
  •  Boati Huashen
  •  CITIC Jinzhou Metal.

logo By Type Segmentation Analysis (Customizable)

  • Nuclear Grade Zirconium
  • Industrial Grade Zirconium
  • Hafnium

logo By Sales Channel Segmentation Analysis (Customizable)

  • Direct
  • Indirect

logo By Application Segmentation Analysis (Customizable)

  • Nuclear Industry
  • Zircaloy Alloys Industry
  • Others

logo Regional Segmentation Analysis (Customizable)

  • North America
    • The U.S.
    • Canada
  • Europe
    • Germany
    • The UK
    • France
    • Spain
    • Italy
    • Rest of Europe
  • Asia Pacific
    • China
    • Japan
    • India
    • South Korea
    • Southeast Asia
    • Rest of Asia Pacific
  • Latin America
    • Brazil
    • Mexico
    • Rest of Latin America
  • Middle East & Africa
    • GCC
    • South Africa
    • Rest of the Middle East & Africa

Table of Content

  1. CHAPTER 1. Executive Summary
  2. CHAPTER 2. Zirconium and Hafnium Market – Type Analysis
    1. 2.1. Global Zirconium and Hafnium Market Share, by Type, 2015-2025 (USD Million)
    2. 2.2. Global Zirconium and Hafnium Market share, by Type, 2015-2025 (Tons)
    3. 2.3. Nuclear Grade Zirconium
      1. 2.3.1. Global Nuclear Zirconium and Hafnium Market, 2015-2025 (USD Million)
      2. 2.3.2. Global Nuclear Zirconium and Hafnium Market, 2015-2025 (Tons)
    4. 2.4. Industrial Grade Zirconium
      1. 2.4.1. Global Industrial Zirconium and Hafnium Market, 2015-2025 (USD Million)
      2. 2.4.2. Global Industrial Zirconium and Hafnium Market, 2015-2025 (Tons)
    5. 2.5. Hafnium
      1. 2.5.1. Global Hafnium Market, 2015-2025 (USD Million)
      2. 2.5.2. Global Hafnium Market, 2015-2025 (Tons)
  3. CHAPTER 3. Zirconium and Hafnium Market – Sales Channel Analysis
    1. 3.1. Global Zirconium and Hafnium Market Share, by Sales Channel, 2015-2025 (USD Million)
    2. 3.2. Global Zirconium and Hafnium Market share, by Sales Channel, 2015-2025 (Tons)
    3. 3.3. Direct
      1. 3.3.1. Global Zirconium and Hafnium Market by Direct, 2015-2025 (USD Million)
      2. 3.3.2. Global Zirconium and Hafnium Market by Direct, 2015-2025 (Tons)
    4. 3.4. Indirect
      1. 3.4.1. Global Zirconium and Hafnium Market by Indirect, 2015-2025 (USD Million)
      2. 3.4.2. Global Zirconium and Hafnium Market by Indirect, 2015-2025 (Tons)
  4. CHAPTER 4. Zirconium and Hafnium Market – Application Analysis
    1. 4.1. Global Zirconium and Hafnium Market Share, by Application, 2015-2025 (USD Million)
    2. 4.2. Global Zirconium and Hafnium Market Share, by Application, 2015-2025 (Tons)
    3. 4.3. Nuclear Industry
      1. 4.3.1. Global Zirconium and Hafnium Market for Nuclear Industry, 2015-2025 (USD Million)
      2. 4.3.2. Global Zirconium and Hafnium Market for Nuclear Industry, 2015-2025 (Tons)
    4. 4.4. Zircaloy Alloys Industry
      1. 4.4.1. Global Zirconium and Hafnium Market for Zircaloy Alloys Industry, 2015-2025 (USD Million)
      2. 4.4.2. Global Zirconium and Hafnium Market for Zircaloy Alloys Industry, 2015-2025 (Tons)
    5. 4.5. Others
      1. 4.5.1. Global Zirconium and Hafnium Market for Others, 2015-2025 (USD Million)
      2. 4.5.2. Global Zirconium and Hafnium Market for Others, 2015-2025 (Tons)
  5. CHAPTER 5. Zirconium and Hafnium Market – Regional Analysis
    1. 5.1. Global Zirconium and Hafnium Market Share, by Region, 2015-2025 (Value)
    2. 5.2. Global Zirconium and Hafnium Market Share, by Region, 2015-2025 (Volume)
    3. 5.3. North America
      1. 5.3.1. North America Zirconium and Hafnium Market Size and Forecast, 2015-2025 (USD Million)
      2. 5.3.2. North America Zirconium and Hafnium Market, by Country, 2015-2025 (USD Million)
      3. 5.3.3. North America Market Size and Forecast, 2015-2025 (Tons)
      4. 5.3.4. North America Zirconium and Hafnium Market, by Country, 2015-2025 (Tons)
      5. 5.3.5. North America Zirconium and Hafnium Market, by Type, 2015-2025
        1. 5.3.5.1. North America Zirconium and Hafnium Market, by Type, 2015-2025 (USD Million)
        2. 5.3.5.2. North America Zirconium and Hafnium Market, by Type, 2015-2025 (Tons)
      6. 5.3.6. North America Zirconium and Hafnium Market, by Sales Channel, 2015-2025
        1. 5.3.6.1. North America Zirconium and Hafnium Market, by Sales Channel, 2015-2025 (USD Million)
        2. 5.3.6.2. North America Zirconium and Hafnium Market, by Sales Channel, 2015-2025 (Tons)
      7. 5.3.7. North America Zirconium and Hafnium Market, by Application, 2015-2025
        1. 5.3.7.1. North America Zirconium and Hafnium Market, by Application, 2015-2025 (USD Million)
        2. 5.3.7.2. North America Zirconium and Hafnium Market, by Application, 2015-2025 (Tons)
      8. 5.3.8. U.S.
        1. 5.3.8.1. U.S. Market Size and Forecast, 2015-2025 (USD Million)
        2. 5.3.8.2. U.S. Market Size and Forecast, 2015-2025 (Tons)
      9. 5.3.9. Canada
        1. 5.3.9.1. Canada Market Size and Forecast, 2015-2025 (USD Million)
        2. 5.3.9.2. Canada Market Size and Forecast, 2015-2025 (Tons)
    4. 5.4. Europe
      1. 5.4.1. Europe Zirconium and Hafnium Market Size and Forecast, 2015-2025 (USD Million)
      2. 5.4.2. Europe Zirconium and Hafnium Market, by Country, 2015-2025 (USD Million)
      3. 5.4.3. Europe Market Size and Forecast, 2015-2025 (Tons)
      4. 5.4.4. Europe Zirconium and Hafnium Market, by Country, 2015-2025 (Tons)
      5. 5.4.5. Europe Zirconium and Hafnium Market, by Type, 2015-2025
        1. 5.4.5.1. Europe Zirconium and Hafnium Market, by Type, 2015-2025 (USD Million)
        2. 5.4.5.2. Europe Zirconium and Hafnium Market, by Type, 2015-2025 (Tons)
      6. 5.4.6. Europe Zirconium and Hafnium Market, by Sales Channel, 2015-2025
        1. 5.4.6.1. Europe Zirconium and Hafnium Market, by Sales Channel, 2015-2025 (USD Million)
        2. 5.4.6.2. Europe Zirconium and Hafnium Market, by Sales Channel, 2015-2025 (Tons)
      7. 5.4.7. Europe Zirconium and Hafnium Market, by Application, 2015-2025
        1. 5.4.7.1. Europe Zirconium and Hafnium Market, by Application, 2015-2025 (USD Million)
        2. 5.4.7.2. Europe Zirconium and Hafnium Market, by Application, 2015-2025 (Tons)
      8. 5.4.8. Germany
        1. 5.4.8.1. Germany Market Size and Forecast, 2015-2025 (USD Million)
        2. 5.4.8.2. Germany Market Size and Forecast, 2015-2025 (Tons)
      9. 5.4.9. France
        1. 5.4.9.1. France Market Size and Forecast, 2015-2025 (USD Million)
        2. 5.4.9.2. France Market Size and Forecast, 2015-2025 (Tons)
      10. 5.4.10. UK
        1. 5.4.10.1. UK Market Size and Forecast, 2015-2025 (USD Million)
        2. 5.4.10.2. UK Market Size and Forecast, 2015-2025 (Tons)
      11. 5.4.11. Italy
        1. 5.4.11.1. Italy Market Size and Forecast, 2015-2025 (USD Million)
        2. 5.4.11.2. Italy Market Size and Forecast, 2015-2025 (Tons)
      12. 5.4.12. Spain
        1. 5.4.12.1. Spain Market Size and Forecast, 2015-2025 (USD Million)
        2. 5.4.12.2. Spain Market Size and Forecast, 2015-2025 (Tons)
      13. 5.4.13. Rest of Europe
        1. 5.4.13.1. Rest of Europe Market Size and Forecast, 2015-2025 (USD Million)
        2. 5.4.13.2. Rest of Europe Market Size and Forecast, 2015-2025 (Tons)
    5. 5.5. Asia Pacific
      1. 5.5.1. Asia Pacific Zirconium and Hafnium Market Size and Forecast, 2015-2025 (USD Million)
      2. 5.5.2. Asia Pacific Zirconium and Hafnium Market, by Country, 2015-2025 (USD Million)
      3. 5.5.3. Asia Pacific Market Size and Forecast, 2015-2025 (Tons)
      4. 5.5.4. Asia Pacific Zirconium and Hafnium Market, by Country, 2015-2025 (Tons)
      5. 5.5.5. Asia Pacific Zirconium and Hafnium Market, by Type, 2015-2025
        1. 5.5.5.1. Asia Pacific Zirconium and Hafnium Market, by Type, 2015-2025 (USD Million)
        2. 5.5.5.2. Asia Pacific Zirconium and Hafnium Market, by Type, 2015-2025 (Tons)
      6. 5.5.6. Asia Pacific Zirconium and Hafnium Market, by Sales Channel, 2015-2025
        1. 5.5.6.1. Asia Pacific Zirconium and Hafnium Market, by Sales Channel, 2015-2025 (USD Million)
        2. 5.5.6.2. Asia Pacific Zirconium and Hafnium Market, by Sales Channel, 2015-2025 (Tons)
      7. 5.5.7. Asia Pacific Zirconium and Hafnium Market, by Application, 2015-2025
        1. 5.5.7.1. Asia Pacific Zirconium and Hafnium Market, by Application, 2015-2025 (USD Million)
        2. 5.5.7.2. Asia Pacific Zirconium and Hafnium Market, by Application, 2015-2025 (Tons)
      8. 5.5.8. China
        1. 5.5.8.1. China Market Size and Forecast, 2015-2025 (USD Million)
        2. 5.5.8.2. China Market Size and Forecast, 2015-2025 (Tons)
      9. 5.5.9. Japan
        1. 5.5.9.1. Japan Market Size and Forecast, 2015-2025 (USD Million)
        2. 5.5.9.2. Japan Market Size and Forecast, 2015-2025 (Tons)
      10. 5.5.10. India
        1. 5.5.10.1. India Market Size and Forecast, 2015-2025 (USD Million)
        2. 5.5.10.2. India Market Size and Forecast, 2015-2025 (Tons)
      11. 5.5.11. South Korea
        1. 5.5.11.1. South Korea Market Size and Forecast, 2015-2025 (USD Million)
        2. 5.5.11.2. South Korea Market Size and Forecast, 2015-2025 (Tons)
      12. 5.5.12. Southeast Asia
        1. 5.5.12.1. Southeast Asia Market Size and Forecast, 2015-2025 (USD Million)
        2. 5.5.12.2. Southeast Asia Market Size and Forecast, 2015-2025 (Tons)
      13. 5.5.13. Rest of Asia Pacific
        1. 5.5.13.1. Rest of Asia Pacific Market Size and Forecast, 2015-2025 (USD Million)
        2. 5.5.13.2. Rest of Asia Pacific Market Size and Forecast, 2015-2025 (Tons)
    6. 5.6. Latin America
      1. 5.6.1. Latin America Zirconium and Hafnium Market Size and Forecast, 2015-2025
      2. 5.6.2. Latin America Zirconium and Hafnium Market, by Country, 2015-2025 (USD Million)
      3. 5.6.3. Latin America Market Size and Forecast, 2015-2025 (Tons)
      4. 5.6.4. Latin America Zirconium and Hafnium Market, by Country, 2015-2025 (Tons)
      5. 5.6.5. Latin America Zirconium and Hafnium Market, by Type, 2015-2025
        1. 5.6.5.1. Latin America Zirconium and Hafnium Market, by Type, 2015-2025 (USD Million)
        2. 5.6.5.2. Latin America Zirconium and Hafnium Market, by Type, 2015-2025 (Tons)
      6. 5.6.6. Latin America Zirconium and Hafnium Market, by Sales Channel, 2015-2025
        1. 5.6.6.1. Latin America Zirconium and Hafnium Market, by Sales Channel, 2015-2025 (USD Million)
        2. 5.6.6.2. Latin America Zirconium and Hafnium Market, by Sales Channel, 2015-2025 (Tons)
      7. 5.6.7. Latin America Zirconium and Hafnium Market, by Application, 2015-2025
        1. 5.6.7.1. Latin America Zirconium and Hafnium Market, by Application, 2015-2025 (USD Million)
        2. 5.6.7.2. Latin America Zirconium and Hafnium Market, by Application, 2015-2025 (Tons)
      8. 5.6.8. Brazil
        1. 5.6.8.1. Brazil Market Size and Forecast, 2015-2025 (USD Million)
        2. 5.6.8.2. Brazil Market Size and Forecast, 2015-2025 (Tons)
      9. 5.6.9. Mexico
        1. 5.6.9.1. Mexico Market Size and Forecast, 2015-2025 (USD Million)
        2. 5.6.9.2. Mexico Market Size and Forecast, 2015-2025 (Tons)
      10. 5.6.10. Rest of Latin America
        1. 5.6.10.1. Rest of Latin America Market Size and Forecast, 2015-2025 (USD Million)
        2. 5.6.10.2. Rest of Latin America Market Size and Forecast, 2015-2025 (Tons)
    7. 5.7. Middle East & Africa
      1. 5.7.1. The Middle East & Africa Zirconium and Hafnium Market Size and Forecast, 2015-2025
      2. 5.7.2. The Middle East & Africa Zirconium and Hafnium Market, by Country, 2015-2025 (USD Million)
      3. 5.7.3. The Middle East & Africa Market Size and Forecast, 2015-2025 (Tons)
      4. 5.7.4. The Middle East & Africa Zirconium and Hafnium Market, by Country, 2015-2025 (Tons)
      5. 5.7.5. The Middle East & Africa Zirconium and Hafnium Market, by Type, 2015-2025
        1. 5.7.5.1. The Middle East & Africa Zirconium and Hafnium Market, by Type, 2015-2025 (USD Million)
        2. 5.7.5.2. The Middle East & Africa Zirconium and Hafnium Market, by Type, 2015-2025 (Tons)
      6. 5.7.6. The Middle East & Africa Zirconium and Hafnium Market, by Sales Channel, 2015-2025
        1. 5.7.6.1. The Middle East & Africa Zirconium and Hafnium Market, by Sales Channel, 2015-2025 (USD Million)
        2. 5.7.6.2. The Middle East & Africa Zirconium and Hafnium Market, by Sales Channel, 2015-2025 (Tons)
      7. 5.7.7. The Middle East & Africa Zirconium and Hafnium Market, by Application, 2015-2025
        1. 5.7.7.1. The Middle East & Africa Zirconium and Hafnium Market, by Application, 2015-2025 (USD Million)
        2. 5.7.7.2. The Middle East & Africa Zirconium and Hafnium Market, by Application, 2015-2025 (Tons)
      8. 5.7.8. GCC Countries
        1. 5.7.8.1. GCC Countries Market Size and Forecast, 2015-2025 (USD Million)
        2. 5.7.8.2. GCC Countries Market Size and Forecast, 2015-2025 (Tons)
      9. 5.7.9. South Africa
        1. 5.7.9.1. South Africa Market Size and Forecast, 2015-2025 (USD Million)
        2. 5.7.9.2. South Africa Market Size and Forecast, 2015-2025 (Tons)
      10. 5.7.10. Rest of The Middle East & Africa
        1. 5.7.10.1. Rest of The Middle East & Africa Market Size and Forecast, 2015-2025 (USD Million)
        2. 5.7.10.2. Rest of The Middle East & Africa Market Size and Forecast, 2015-2025 (Tons)
  6. CHAPTER 6. Zirconium and Hafnium Production, Consumption, Export, Import by Regions
    1. 6.1. Global Zirconium and Hafnium Production, 2015-2025 (Tons)
    2. 6.2. Global Import and Export Analysis, by Region
  7. CHAPTER 7. Zirconium and Hafnium Market – Competitive Landscape
    1. 7.1. Competitor Market Share – Revenue
    2. 7.2. Competitor Market Share – Volume
    3. 7.3. Strategic Development
  8. CHAPTER 8. Company Profiles
    1. 8.1. Framatome (Areva)
      1. 8.1.1. Company Overview
      2. 8.1.2. Framatome (Areva) Sales, Revenue, Price, and Gross Margin
      3. 8.1.3. Product Portfolio
      4. 8.1.4. Recent Initiatives
    2. 8.2. Westinghouse Electric Company LLC
      1. 8.2.1. Company Overview
      2. 8.2.2. Westinghouse Electric Company LLC Sales, Revenue, Price, and Gross Margin
      3. 8.2.3. Product Portfolio
      4. 8.2.4. Recent Initiatives
    3. 8.3. ATI
      1. 8.3.1. Company Overview
      2. 8.3.2. ATI Sales, Revenue, Price, and Gross Margin
      3. 8.3.3. Product Portfolio
      4. 8.3.4. Recent Initiatives
    4. 8.4. Chepetsky Mechanical Plant
      1. 8.4.1. Company Overview
      2. 8.4.2. Chepetsky Mechanical Plant Sales, Revenue, Price, and Gross Margin
      3. 8.4.3. Product Portfolio
    5. 8.5. Nuclear Fuel Complex
      1. 8.5.1. Company Overview
      2. 8.5.2. Product Portfolio
    6. 8.6. SNWZH
      1. 8.6.1. Company Overview
      2. 8.6.2. SNWZH Sales, Revenue, Price, and Gross Margin
      3. 8.6.3. Product Portfolio
    7. 8.7. CNNC Jinghuan
      1. 8.7.1. Company Overview
      2. 8.7.2. CNNC Jinghuan Sales, Revenue, Price, and Gross Margin
      3. 8.7.3. Product Portfolio
    8. 8.8. Guangdong Orient Zirconic
      1. 8.8.1. Company Overview
      2. 8.8.2. Guangdong Orient Zirconic Sales, Revenue, Price, and Gross Margin
      3. 8.8.3. Product Portfolio
    9. 8.9. Boati Huashen
      1. 8.9.1. Company Overview
      2. 8.9.2. Boati Huashen Sales, Revenue, Price, and Gross Margin
      3. 8.9.3. Product Portfolio
    10. 8.10. CITIC Jinzhou Metal
      1. 8.10.1. Company Overview
      2. 8.10.2. CITIC Jinzhou Metal Sales, Revenue, Price, and Gross Margin
      3. 8.10.3. Product Portfolio
  9. CHAPTER 9. Zirconium and Hafnium — Industry Analysis
    1. 9.1. Introduction and Taxonomy
    2. 9.2. Zirconium and Hafnium Market – Key Trends
      1. 9.2.1. Market Drivers
      2. 9.2.2. Market Restraints
      3. 9.2.3. Market Opportunities
    3. 9.3. Value Chain Analysis
    4. 9.4. Key Mandates and Regulations
    5. 9.5. Technological Roadmap and Timeline:
    6. 9.6. Zirconium and Hafnium market – Attractiveness Analysis
      1. 9.6.1. By Type
      2. 9.6.2. By Sales Channel
      3. 9.6.3. By Application
      4. 9.6.4. By Region
  10. CHAPTER 10. Raw Material analysis
    1. 10.1. Zirconium and Hafnium Key Raw Material Analysis
      1. 10.1.1. Key Raw Materials
    2. 10.2. Key Suppliers of Raw Materials
    3. 10.3. Proportion of Manufacturing Cost Structure
      1. 10.3.1. Raw Materials
      2. 10.3.2. Labor Cost
    4. 10.4. Manufacturing Expenses Analysis of Zirconium and Hafnium
  11. CHAPTER 11. Industrial Chain, Sourcing Strategy and Downstream Buyers
    1. 11.1. Zirconium and Hafnium Industrial Chain Analysis
    2. 11.2. Upstream Raw Materials Sourcing
      1. 11.2.1. Risk Mitigation:
      2. 11.2.2. Supplier Relationships:
      3. 11.2.3. Business Processes:
      4. 11.2.4. Securing the Product:
    3. 11.3. Raw Materials Sources of Zirconium and Hafnium Major Manufacturers in 2016
    4. 11.4. Downstream Buyers
    5. 11.5. Distributors/Traders List
  12. CHAPTER 12. Marketing Strategy Analysis, Distributors
    1. 12.1. Marketing Channel
    2. 12.2. Direct Marketing
    3. 12.3. Indirect Marketing
    4. 12.4. Marketing Channel Development Trend
    5. 12.5. Economic/Political Environmental Change
  13. CHAPTER 13. Report Conclusion
  14. CHAPTER 14. Research Approach & Methodology
    1. 14.1. Report Description
    2. 14.2. Research Scope
    3. 14.3. Research Methodology
      1. 14.3.1. Secondary Research
      2. 14.3.2. Primary Research
      3. 14.3.3. Models
        1. 14.3.3.1. Company Share Analysis Model
        2. 14.3.3.2. Revenue Based Modeling
        3. 14.3.3.3. Research Limitations

        List of Figures

        FIG. 1 Global Zirconium and Hafnium Market, 2015-2025 (USD Million)
        FIG. 2 Global Nuclear Zirconium and Hafnium Market, 2015-2025 (USD Million)
        FIG. 3 Global Nuclear Zirconium and Hafnium   Market, 2015-2025 (Tons)
        FIG. 4 Global Industrial Zirconium and Hafnium Market, 2015-2025 (USD Million)
        FIG. 5 Global Industrial Zirconium and Hafnium   Market, 2015-2025 (Tons)
        FIG. 6 Global Hafnium Market, 2015-2025 (USD Million)
        FIG. 7 Global Hafnium Market, 2015-2025 (Tons)
        FIG. 8 Global Zirconium and Hafnium Market by Direct, 2015-2025 (USD Million)
        FIG. 9 Global Zirconium and Hafnium Market by Direct, 2015-2025 (Tons)
        FIG. 10 Global Zirconium and Hafnium Market by Indirect, 2015-2025 (USD Million)
        FIG. 11 Global Zirconium and Hafnium Market by Indirect, 2015-2025 (Tons)
        FIG. 12 Global Zirconium and Hafnium Market for Nuclear Industry, 2015-2025 (USD Million)
        FIG. 13 Global Zirconium and Hafnium Market for Nuclear Industry, 2015-2025 (Tons)
        FIG. 14 Global Zirconium and Hafnium Market for Zircaloy Alloys Industry, 2015-2025 (USD Million)
        FIG. 15 Global Zirconium and Hafnium Market for Zircaloy Alloys Industry, 2015-2025 (Tons)
        FIG. 16 Global Zirconium and Hafnium Market for Others, 2015-2025 (USD Million)
        FIG. 17 Global Zirconium and Hafnium Market for Others, 2015-2025 (Tons)
        FIG. 18 North America  Zirconium and Hafnium Market, 2015-2025 (USD Million)
        FIG. 19 North America  Zirconium and Hafnium Market, 2015-2025 (Tons)
        FIG. 20 U.S.  Zirconium and Hafnium Market, 2015-2025
        FIG. 21 U.S.  Zirconium and Hafnium   Market, 2015-2025 (Tons)
        FIG. 22 Canada  Zirconium and Hafnium Market, 2015-2025
        FIG. 23 Canada  Zirconium and Hafnium   Market, 2015-2025 (Tons)
        FIG. 24 Europe  Zirconium and Hafnium Market, 2015-2025 (USD Million)
        FIG. 25 Europe  Zirconium and Hafnium Market, 2015-2025 (Tons)
        FIG. 26 Germany  Zirconium and Hafnium Market, 2015-2025 (USD Million)
        FIG. 27 Germany  Zirconium and Hafnium   Market, 2015-2025 (Tons)
        FIG. 28 France  Zirconium and Hafnium Market, 2015-2025 (USD Million)
        FIG. 29 France  Zirconium and Hafnium   Market, 2015-2025 (Tons)
        FIG. 30 UK  Zirconium and Hafnium Market, 2015-2025 (USD Million)
        FIG. 31 UK  Zirconium and Hafnium   Market, 2015-2025 (Tons)
        FIG. 32 Italy  Zirconium and Hafnium Market, 2015-2025 (USD Million)
        FIG. 33 Italy  Zirconium and Hafnium   Market, 2015-2025 (Tons)
        FIG. 34 Spain  Zirconium and Hafnium Market, 2015-2025 (USD Million)
        FIG. 35 Spain  Zirconium and Hafnium   Market, 2015-2025 (Tons)
        FIG. 36 Rest of Europe  Zirconium and Hafnium Market, 2015-2025 (USD Million)
        FIG. 37 Rest of Europe  Zirconium and Hafnium Market, 2015-2025 (Tons)
        FIG. 38 Asia Pacific  Zirconium and Hafnium Market, 2015-2025 (USD Million)
        FIG. 39 Asia Pacific  Zirconium and Hafnium Market, 2015-2025 (Tons)
        FIG. 40 China  Zirconium and Hafnium Market, 2015-2025
        FIG. 41 China  Zirconium and Hafnium   Market, 2015-2025 (Tons)
        FIG. 42 Japan  Zirconium and Hafnium Market, 2015-2025
        FIG. 43 Japan  Zirconium and Hafnium   Market, 2015-2025 (Tons)
        FIG. 44 India  Zirconium and Hafnium Market, 2015-2025
        FIG. 45 India  Zirconium and Hafnium   Market, 2015-2025 (Tons)
        FIG. 46 South Korea  Zirconium and Hafnium Market, 2015-2025
        FIG. 47 South Korea  Zirconium and Hafnium Market, 2015-2025 (Tons)
        FIG. 48 Southeast Asia  Zirconium and Hafnium Market, 2015-2025
        FIG. 49 Southeast Asia  Zirconium and Hafnium   Market, 2015-2025 (Tons)
        FIG. 50 Rest of Asia Pacific  Zirconium and Hafnium Market, 2015-2025
        FIG. 51 Rest of Asia Pacific  Zirconium and Hafnium Market, 2015-2025 (Tons)
        FIG. 52 Latin America  Zirconium and Hafnium Market, 2015-2025
        FIG. 53 Latin America  Zirconium and Hafnium Market, 2015-2025 (Tons)
        FIG. 54 Brazil  Zirconium and Hafnium Market, 2015-2025
        FIG. 55 Brazil  Zirconium and Hafnium   Market, 2015-2025 (Tons)
        FIG. 56 Mexico  Zirconium and Hafnium Market, 2015-2025
        FIG. 57 Mexico  Zirconium and Hafnium   Market, 2015-2025 (Tons)
        FIG. 58 Rest of Latin America  Zirconium and Hafnium Market, 2015-2025
        FIG. 59 Rest of Latin America  Zirconium and Hafnium Market, 2015-2025 (Tons)
        FIG. 60 The Middle East & Africa  Zirconium and Hafnium Market, 2015-2025 (USD Million)
        FIG. 61 The Middle East & Africa  Zirconium and Hafnium Market, 2015-2025 (Tons)
        FIG. 62 GCC Countries  Zirconium and Hafnium Market, 2015-2025
        FIG. 63 GCC Countries  Zirconium and Hafnium   Market, 2015-2025 (Tons)
        FIG. 64 South Africa  Zirconium and Hafnium Market, 2015-2025
        FIG. 65 South Africa  Zirconium and Hafnium   Market, 2015-2025 (Tons)
        FIG. 66 Rest of The Middle East & Africa  Zirconium and Hafnium Market, 2015-2025
        FIG. 67 Rest of The Middle East & Africa  Zirconium and Hafnium Market, 2015-2025 (Tons)
        FIG. 68 Global Zirconium and Hafnium Production, 2015-2025 (Tons)
        FIG. 69 North America Zirconium and Hafnium Production, 2015-2025 (Tons)
        FIG. 70 Europe Zirconium and Hafnium Production, 2015-2025 (Tons)
        FIG. 71 Asia Pacific Zirconium and Hafnium Production, 2015-2025 (Tons)
        FIG. 72 Latin America Zirconium and Hafnium Production, 2015-2025 (Tons)
        FIG. 73 The Middle East and Africa Zirconium and Hafnium Production, 2015-2025 (Tons)
        FIG. 74 Competitor Market Share – Revenue
        FIG. 75 Competitor Market Share – Volume
        FIG. 76 Framatome (Areva) Zirconium Revenue (USD Million)
        FIG. 77 Framatome (Areva) Zirconium Market Share (%)
        FIG. 78 Framatome (Areva) Hafnium Revenue (USD Million)
        FIG. 79 Framatome (Areva) Hafnium Market Share (%)
        FIG. 80 Westinghouse Electric Company LLC Zirconium Revenue (USD Million)
        FIG. 81 Westinghouse Electric Company LLC Zirconium Market Share (%)
        FIG. 82 ATI Zirconium Revenue (USD Million)
        FIG. 83 ATI Zirconium Market Share (%)
        FIG. 84 ATI Hafnium Revenue (USD Million)
        FIG. 85 ATI Hafnium Market Share (%)
        FIG. 86 Chepetsky Mechanical Plant Zirconium Revenue (USD Million)
        FIG. 87 Chepetsky Mechanical Plant Zirconium Market Share (%)
        FIG. 88 SNWZH Zirconium Revenue (USD Million)
        FIG. 89 SNWZH Zirconium Market Share (%)
        FIG. 90 SNWZH Hafnium Revenue (USD Million)
        FIG. 91 SNWZH Hafnium Market Share (%)
        FIG. 92 CNNC JINGHUAN Zirconium Revenue (USD Million)
        FIG. 93 CNNC JINGHUAN Zirconium Market Share (%)
        FIG. 94 CNNC JINGHUAN Hafnium Revenue (USD Million)
        FIG. 95 CNNC JINGHUAN Hafnium Market Share (%)
        FIG. 96 Guangdong Orient Zirconic Zirconium Revenue (USD Million)
        FIG. 97 Guangdong Orient Zirconic Zirconium Market Share (%)
        FIG. 98 Boati Huashen Zirconium Revenue (USD Million)
        FIG. 99 Boati Huashen Zirconium Market Share (%)
        FIG. 100 CITIC JINZHOU METAL Zirconium Revenue (USD Million)
        FIG. 101 CITIC JINZHOU METAL Zirconium Market Share (%)
        FIG. 102 CITIC JINZHOU METAL Hafnium Revenue (USD Million)
        FIG. 103 CITIC JINZHOU METAL Hafnium Market Share (%)
        FIG. 104 Market Dynamics
        FIG. 105 Global Zirconium and Hafnium – Value Chain Analysis
        FIG. 106 Market Attractiveness Analysis – By Type
        FIG. 107 Market Attractiveness Analysis – By Sales Channel
        FIG. 108 Market Attractiveness Analysis – By Application
        FIG. 109 Market Attractiveness Analysis – By Region
        FIG. 110 Manufacturing Cost Structure of Zirconium and Hafnium
        FIG. 111 Zirconium and Hafnium Industrial Chain Analysis

        List of Tables

        TABLE 1 Global Zirconium and Hafnium Market, 2015-2025 (USD Million)
        TABLE 2 Global Zirconium and Hafnium Market, by Type, 2015-2025 (USD Million)
        TABLE 3 Global Zirconium and Hafnium Market, by Type, 2015-2025 (Tons)
        TABLE 4 Global Zirconium and Hafnium Market, by Sales Channel, 2015-2025 (USD Million)
        TABLE 5 Global Zirconium and Hafnium Market, by Sales Channel, 2015-2025 (Tons)
        TABLE 6 Global Zirconium and Hafnium Market, by Application, 2015-2025 (USD Million)
        TABLE 7 Global Zirconium and Hafnium Market, by Application, 2015-2025 (Tons)
        TABLE 8 Global Zirconium and Hafnium Market, by Region, 2015-2025 (USD Million)
        TABLE 9 Global Zirconium and Hafnium Market, by Region, 2015-2025 (Tons)
        TABLE 10 North America  Zirconium and Hafnium Market, by Type, 2015-2025 (USD Million)
        TABLE 11 North America  Zirconium and Hafnium Market, by Type, 2015-2025 (Tons)
        TABLE 12 North America  Zirconium and Hafnium Market, by Sales Channel, 2015-2025 (USD Million)
        TABLE 13 North America  Zirconium and Hafnium Market, by Sales Channel, 2015-2025 (Tons)
        TABLE 14 North America  Zirconium and Hafnium Market, by Application, 2015-2025 (USD Million)
        TABLE 15 North America  Zirconium and Hafnium Market, by Application, 2015-2025 (Tons)
        TABLE 16 Europe  Zirconium and Hafnium Market, by Type, 2015-2025 (USD Million)
        TABLE 17 Europe  Zirconium and Hafnium Market, by Type, 2015-2025 (Tons)
        TABLE 18 Europe  Zirconium and Hafnium Market, by Sales Channel, 2015-2025 (USD Million)
        TABLE 19 Europe  Zirconium and Hafnium Market, by Sales Channel, 2015-2025 (Tons)
        TABLE 20 Europe  Zirconium and Hafnium Market, by Application, 2015-2025 (USD Million)
        TABLE 21 Europe  Zirconium and Hafnium Market, by Application, 2015-2025 (Tons)
        TABLE 22 Asia Pacific  Zirconium and Hafnium Market, by Type, 2015-2025 (USD Million)
        TABLE 23 Asia Pacific  Zirconium and Hafnium Market, by Type, 2015-2025 (Tons)
        TABLE 24 Asia Pacific  Zirconium and Hafnium Market, by Sales Channel, 2015-2025 (USD Million)
        TABLE 25 Asia Pacific  Zirconium and Hafnium Market, by Sales Channel, 2015-2025 (Tons)
        TABLE 26 Asia Pacific  Zirconium and Hafnium Market, by Application, 2015-2025 (USD Million)
        TABLE 27 Asia Pacific  Zirconium and Hafnium Market, by Application, 2015-2025 (Tons)
        TABLE 28 Latin America  Zirconium and Hafnium Market, by Type, 2015-2025 (USD Million)
        TABLE 29 Latin America  Zirconium and Hafnium Market, by Type, 2015-2025 (Tons)
        TABLE 30 Latin America  Zirconium and Hafnium Market, by Sales Channel, 2015-2025 (USD Million)
        TABLE 31 Latin America  Zirconium and Hafnium Market, by Sales Channel, 2015-2025 (Tons)
        TABLE 32 Latin America  Zirconium and Hafnium Market, by Application, 2015-2025 (USD Million)
        TABLE 33 Latin America  Zirconium and Hafnium Market, by Application, 2015-2025 (Tons)
        TABLE 34 The Middle East & Africa  Zirconium and Hafnium Market, by Type, 2015-2025 (USD Million)
        TABLE 35 The Middle East & Africa  Zirconium and Hafnium Market, by Type, 2015-2025 (Tons)
        TABLE 36 The Middle East & Africa  Zirconium and Hafnium Market, by Sales Channel, 2015-2025 (USD Million)
        TABLE 37 The Middle East & Africa  Zirconium and Hafnium Market, by Sales Channel, 2015-2025 (Tons)
        TABLE 38 The Middle East & Africa  Zirconium and Hafnium Market, by Application, 2015-2025 (USD Million)
        TABLE 39 The Middle East & Africa  Zirconium and Hafnium Market, by Application, 2015-2025 (Tons)
        TABLE 40 North America Zirconium and Hafnium Production, Consumption, Export, Import, 2015-2025
        TABLE 41 Europe Zirconium and Hafnium Production, Consumption, Export, Import, 2015-2025
        TABLE 42 Asia Pacific Zirconium and Hafnium Production, Consumption, Export, Import, 2015-2025
        TABLE 43 Latin America Zirconium and Hafnium Production, Consumption, Export, Import, 2015-2025
        TABLE 44 Middle East & Africa Zirconium and Hafnium Production, Consumption, Export, Import, 2015-2025
        TABLE 45 Global Zirconium and Hafnium Market – Company Zirconium Revenue Analysis 2015-2018 (USD Million)
        TABLE 46 Global Zirconium and Hafnium Market – Company Zirconium and Hafnium Revenue Analysis 2015-2018 (USD Million)
        TABLE 47 Global Zirconium and Hafnium Market – Company Zirconium Revenue Share Analysis 2015-2018 (%)
        TABLE 48 Global Zirconium and Hafnium Market – Company Zirconium and Hafnium Revenue Share Analysis 2015-2018 (%)
        TABLE 49 Global Zirconium and Hafnium Market – Company Zirconium Volume Analysis 2015-2018 (Tons)
        TABLE 50 Global Zirconium and Hafnium Market – Company Zirconium and Hafnium Volume Analysis 2015-2018 (Tons)
        TABLE 51 Global Zirconium and Hafnium Market – Company Zirconium Volume Share Analysis 2015-2018(%)
        TABLE 52 Global Zirconium and Hafnium Market – Company Zirconium and Hafnium Volume Share Analysis 2015-2018(%)
        TABLE 53 Global Zirconium and Hafnium Market – Company Zirconium Production Analysis 2015-2018 (Tons)
        TABLE 54 Global Zirconium and Hafnium Market – Company Zirconium and Hafnium Production Analysis 2015-2018 (Tons)
        TABLE 55 Strategic Development
        TABLE 56 Market Drivers
        TABLE 57 Market Restraints
        TABLE 58 Market Opportunities
        TABLE 59 Production Base and Market Concentration Rate of Raw Material
        TABLE 60 Key Suppliers of Raw Materials
        TABLE 61 Raw Materials Sources of Zirconium and Hafnium Major Manufacturers in 2016
        TABLE 62 Major Buyers of Zirconium and Hafnium
        TABLE 63 Distributors/Traders of Zirconium and Hafnium

Industry Major Market Players

  •  Framatome (Areva)
  •  Westinghouse Electric Company LLC
  •  ATI
  •  Chepetsky Mechanical Plant
  •  Nuclear Fuel Complex
  •  SNWZH
  •  CNNC Jinghuan
  •  Guangdong Orient Zirconic
  •  Boati Huashen
  •  CITIC Jinzhou Metal.