Search Market Research Report

Discover Our Latest Reports
Discover Our Featured Reports
Discover Top Selling Reports

Yacht Market Size, Share Global Analysis Report, 2021–2026

report img

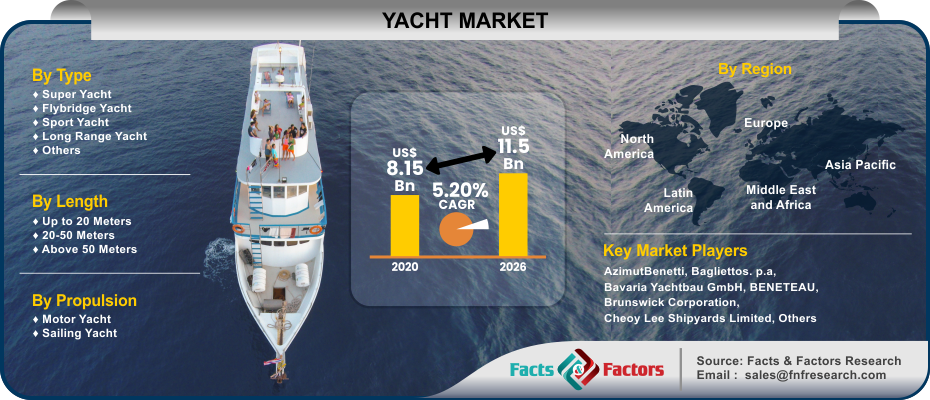
Yacht Market By Type (Super Yacht, Flybridge Yacht, Sport Yacht, Long Range Yacht), By Length (Up to 20 Meters,20-50 Meters, Above 50 Meters), By Propulsion (Motor Yacht, Sailing Yacht), By Region, And Segment Forecast 2021–2026

Industry Insights

[206+ Pages Report] According to facts and factors, the global yacht market was valued at approximately USD 8.15 Billion in 2020 and is predicted to create revenue of roughly USD 11.05 Billion by the end of 2026, with a CAGR of approximately 5.20% between 2021 and 2026.

logoMarket Overview                      

A yacht is a crewed sailing ship primarily used for recreational and sporting purposes. Wind sailing or a propulsion system, such as an internal combustion engine (ICE) or a gas turbine, can be used to power it. Yachts are usually mass-produced by using various materials, such as aluminum, steel, fiberglass, carbon fiber, wood, and treated wood with epoxy resins. Some yachts are usually charted or rented by private entities and are equipped with sophisticated, elegant, and customized amenities such as a jacuzzi spa, gym, sauna, and sun lounges. They are also furnished with style, modern design, comfort, and technologically advanced components to enhance the yacht's overall performance and user experiences.

Yachts are huge, luxury, professionally crewed motor or sailing yachts that range in length from 75 feet and expanding to more than 250 feet. Yachts are commonly available for charter as well as private usage, allowing for a seamless luxury experience with high standards and comfort. Traditionally manufactured using woods, composites and fiber-reinforced polymers gain huge popularity in the last few years. Demand for yachts has augmented steadily in the last few years. This can be attributed to a shift in people's lifestyles fuelled by an increase in high-net-worth individuals, a rise in participation in leisure and recreational activities, and an increase in the popularity of yacht tourism.

logoIndustry Growth Factors

The demand for yachts has grown steadily over the last few years, owing to the increase in people's disposable money and their preference for leisure or recreational activities. The increased demand of travelers for luxury tourism, personalized service, and exclusive travel are the driving factors of yacht sales. Manufacturers are emphasizing the inclusion of luxury features to increase performance and customer experience. Over the last few years, manufacturing technologies have also changed significantly. Yachts were manufactured using fiber-reinforced polymers and wood. On the other hand, composites have grown in popularity as a result of advantages like corrosion resistance, fewer maintenance costs, and greater strength-to-weight properties. The usage of an electronically regulated fuel injection system offers the flexibility to let engines operate at variable speeds and considerably reduce noise, vibration, and discharges in port and coastal areas. It also benefits the improvement of the yacht propulsion system's efficiency.

logo Covid-19 Analysis

The COVID-19 pandemic had an adverse impact on the market growth, particularly yacht chartering businesses. The market was impacted by the outbreak of the pandemic and the subsequent lockdowns imposed by governments on several countries, as well as stringent travel restrictions. Furthermore, supply chain disruptions became a significant obstacle to manufacturing. On the other hand, as restrictions were eased, people became more inclined to engage in leisure activities and the market began to revive. As more people were willing to go along with their families, manufacturing companies have seen an increase in the number of orders for new yachts.

logoSegmentation Analysis

The yacht market is segmented based on type, length, and propulsion. As per type yacht market is segmented into (superyacht, flybridge yacht, sport yacht, long-range yacht, others), by length (up to 20 meters,20-50 meters, above 50 meters), and by propulsion (motor yacht. sailing yacht).In 2020, the superyacht segment dominated the market, accounting for more than 29% of overall revenue. The segment's high popularity among end-users is expected to boost its growth. The sport yacht is projected to emerge as the fastest-growing segment in the market. The growing demands for a sports yacht in nations like China and France are accountable for the segment's growth.

logoYacht Market: Report Scope

Report Attribute

Details

Market Size in 2020

USD 8.15 Billion

Projected Market Size in 2026

USD 11.05 Billion

CAGR Growth Rate

5.20%

Base Year

2020

Forecast Years

2021-2026

Key Market Players

AzimutBenetti, Bagliettos. p.a, Bavaria Yachtbau GmbH, BENETEAU, Brunswick Corporation, Cheoy Lee Shipyards Limited,  Alexander Marine International Viking Yacht Company  and Others

Key Segments

Type, Length, Propulsion, and Region

Major Regions Covered

North America, Europe, Asia Pacific, Latin America, and Middle East & Africa

Purchase Options

Request customized purchase options to meet your research needs. Explore purchase options

logo Regional Analysis

In the global market, Europe held the largest share. The considerable increase can be attributed to expanding yacht purchases in the region. Factors such as a growth in the number of HNWIs and the growing popularity of water sports and fishing in European countries are driving demand. As a result of the region's attractiveness and recent favorable policies, passenger traffic in coastal and marine tourism is predicted to increase in the upcoming years. Sail training, fishing, kayaking, white-water rafting, and one-day scuba diving as well as boating trips free diving, and snorkeling, are examples of investments in coastal areas and leisure activities.

Yacht Market

To know more about this report | Request Free Sample Copy

logo Competitive Players

Some of the essential players operating in the yacht market are

  • Alexander Marine International 
  • Azimut - Benetti S.P.A. 
  • Brunswick Corporation 
  • Viking Yacht Company 
  • Christensen Shipyards LLC 
  • SanlorenzoS.p.A 
  • Feadship Holland B.V. 
  • FincantieriS.p.A. (CDP IndustriaS.p.A.) 
  • Damen Shipyards Group N.V. 
  • Heesen Yachts Sales B.V 
  • Horizon Yacht USA (Metal Shark Boats) 
  • Palumbo Group S.P.A 
  • Princess Yachts Limited (LVMH Group) 
  • Sunseeker International (Wanda Group)

To expand a higher market share, the key market occupants are undertaking initiatives and adopting strategies such as entering into partnerships, engaging in mergers and acquisitions, maintaining competitive prices, making investments, and launching new products and services for their products and services. For instance, the Azimut-Benetti Group declared the debut of a new yacht type under the Magellano collection in July 2020. Ken Freivokh designed the new Magellano 30 METRI boat

logo By Type

  • Super Yacht
  • Flybridge Yacht
  • Sport Yacht
  • Long Range Yacht
  • Others

logo By Length

  • Up to 20 Meters
  • 20-50 Meters
  • Above 50 Meters

logo By Propulsion

  • Motor Yacht
  • Sailing Yacht

logo By Region

  • North America
    • U.S.
    • Canada
  • Europe
    • Germany
    • France
    • U.K.
    • Italy
    • Spain
    • Rest of Europe
  • Asia Pacific
    • China
    • Japan
    • India
    • South Korea
    • South-East Asia
    • Rest of Asia Pacific
  • Latin America
    • Brazil
    • Mexico
    • Rest of Latin America
  • The Middle-East and Africa
    • GCC Countries
    • South Africa
    • Rest of Middle-East Africa

Table of Content

  1. Chapter 1 Executive Summary
    1. 1.1. Introduction of Yacht
    2. 1.2. Global Yacht Market, 2020 & 2026 (USD Billion)
    3. 1.3. Global Yacht Market, 2016 – 2026 (USD Billion) (K Units)
    4. 1.4. Global Yacht Market Absolute Revenue Opportunity, 2016 – 2026 (USD Billion)
    5. 1.5. Global Yacht Market Incremental Revenue Opportunity, 2020 – 2026 (USD Billion)
  2. Chapter 2 Yacht Market – Sales Channel Analysis
    1. 2.1. Global Yacht Market – Sales Channel Overview
    2. 2.2. Global Yacht Market Share, by Sales Channel, 2020 & 2026 (USD Billion)
    3. 2.3. Global Yacht Market share, by Sales Channel, 2020 & 2026 (K Units)
    4. 2.4. Premium Food Service
      1. 2.4.1. Global Premium Food Service Yacht Market, 2016 – 2026 (USD Billion)
      2. 2.4.2. Global Premium Food Service Yacht Market, 2016 – 2026 (K Units)
    5. 2.5. Non Premium Food Service
      1. 2.5.1. Global Non Premium Food Service Yacht Market, 2016 – 2026 (USD Billion)
      2. 2.5.2. Global Non Premium Food Service Yacht Market, 2016 – 2026 (K Units)
    6. 2.6. B2B
      1. 2.6.1. Global B2B Yacht Market, 2016 – 2026 (USD Billion)
      2. 2.6.2. Global B2B Yacht Market, 2016 – 2026 (K Units)
  3. Chapter 3 Yacht Market – Application Analysis
    1. 3.1. Global Yacht Market – Application Overview
    2. 3.2. Global Yacht Market Share, by Application, 2020 & 2026 (USD Billion)
    3. 3.3. Global Yacht Market Share, by Application, 2020 & 2026 (K Units)
    4. 3.4. Savory
      1. 3.4.1. Global Savory Yacht Market, 2016 – 2026 (USD Billion)
      2. 3.4.2. Global Savory Yacht Market, 2016 – 2026 (K Units)
    5. 3.5. Sandwich
      1. 3.5.1. Global Sandwich Yacht Market, 2016 – 2026 (USD Billion)
      2. 3.5.2. Global Sandwich Yacht Market, 2016 – 2026 (K Units)
    6. 3.6. Salad Dressings & Dip
      1. 3.6.1. Global Salad Dressings & Dip Yacht Market, 2016 – 2026 (USD Billion)
      2. 3.6.2. Global Salad Dressings & Dip Yacht Market, 2016 – 2026 (K Units)
    7. 3.7. Baked Goods/Desserts
      1. 3.7.1. Global Baked Goods/Desserts Yacht Market, 2016 – 2026 (USD Billion)
      2. 3.7.2. Global Baked Goods/Desserts Yacht Market, 2016 – 2026 (K Units)
    8. 3.8. Ice Creams & Smoothies
      1. 3.8.1. Global Ice Creams & Smoothies Yacht Market, 2016 – 2026 (USD Billion)
      2. 3.8.2. Global Ice Creams & Smoothies Yacht Market, 2016 – 2026 (K Units)
  4. Chapter 4 Yacht Market – Regional Analysis
    1. 4.1. Global Yacht Market Regional Overview
    2. 4.2. Global Yacht Market Share, by Region, 2020 & 2026 (USD Billion)
    3. 4.3. Global Yacht Market Share, by Region, 2020 & 2026 (K Units)
    4. 4.4. North America
      1. 4.4.1. North America Yacht Market, 2016 – 2026 (USD Billion)
        1. 4.4.1.1. North America Yacht Market, by Country, 2016 - 2026 (USD Billion)
      2. 4.4.2. North America Market, 2016 – 2026 (K Units)
        1. 4.4.2.1. North America Yacht Market, by Country, 2016 - 2026 (K Units)
      3. 4.4.3. North America Yacht Market, by Sales Channel, 2016 – 2026
        1. 4.4.3.1. North America Yacht Market, by Sales Channel, 2016 – 2026 (USD Billion)
        2. 4.4.3.2. North America Yacht Market, by Sales Channel, 2016 – 2026 (K Units)
      4. 4.4.4. North America Yacht Market, by Application, 2016 – 2026
        1. 4.4.4.1. North America Yacht Market, by Application, 2016 – 2026 (USD Billion)
        2. 4.4.4.2. North America Yacht Market, by Application, 2016 – 2026 (K Units)
      5. 4.4.5. U.S.
        1. 4.4.5.1. U.S. Yacht Market, 2016 – 2026 (USD Billion)
        2. 4.4.5.2. U.S. Yacht Market, 2016 – 2026 (K Units)
      6. 4.4.6. Canada
        1. 4.4.6.1. Canada Yacht Market, 2016 – 2026 (USD Billion)
        2. 4.4.6.2. Canada Yacht Market, 2016 – 2026 (K Units)
    5. 4.5. Europe
      1. 4.5.1. Europe Yacht Market, 2016 – 2026 (USD Billion)
        1. 4.5.1.1. Europe Yacht Market, by Country, 2016 - 2026 (USD Billion)
      2. 4.5.2. Europe Yacht Market, 2016 – 2026 (K Units)
        1. 4.5.2.1. Europe Yacht Market, by Country, 2016 - 2026 (K Units)
      3. 4.5.3. Europe Yacht Market, by Sales Channel, 2016 – 2026
        1. 4.5.3.1. Europe Yacht Market, by Sales Channel, 2016 – 2026 (USD Billion)
        2. 4.5.3.2. Europe Yacht Market, by Sales Channel, 2016 – 2026 (K Units)
      4. 4.5.4. Europe Yacht Market, by Application, 2016 – 2026
        1. 4.5.4.1. Europe Yacht Market, by Application, 2016 – 2026 (USD Billion)
        2. 4.5.4.2. Europe Yacht Market, by Application, 2016 – 2026 (K Units)
      5. 4.5.5. Germany
        1. 4.5.5.1. Germany Yacht Market, 2016 – 2026 (USD Billion)
        2. 4.5.5.2. Germany Yacht Market, 2016 – 2026 (K Units)
      6. 4.5.6. France
        1. 4.5.6.1. France Yacht Market, 2016 – 2026 (USD Billion)
        2. 4.5.6.2. France Yacht Market, 2016 – 2026 (K Units)
      7. 4.5.7. U.K.
        1. 4.5.7.1. U.K. Yacht Market, 2016 – 2026 (USD Billion)
        2. 4.5.7.2. U.K. Yacht Market, 2016 – 2026 (K Units)
      8. 4.5.8. Italy
        1. 4.5.8.1. Italy Yacht Market, 2016 – 2026 (USD Billion)
        2. 4.5.8.2. Italy Yacht Market, 2016 – 2026 (K Units)
      9. 4.5.9. Spain
        1. 4.5.9.1. Spain Yacht Market, 2016 – 2026 (USD Billion)
        2. 4.5.9.2. Spain Yacht Market, 2016 – 2026 (K Units)
      10. 4.5.10. Rest of Europe
        1. 4.5.10.1. Rest of Europe Yacht Market, 2016 – 2026 (USD Billion)
        2. 4.5.10.2. Rest of Europe Yacht Market, 2016 – 2026 (K Units)
    6. 4.6. Asia Pacific
      1. 4.6.1. Asia Pacific Yacht Market, 2016 – 2026 (USD Billion)
        1. 4.6.1.1. Asia Pacific Yacht Market, by Country, 2016 - 2026 (USD Billion)
      2. 4.6.2. Asia Pacific Yacht Market, 2016 – 2026 (K Units)
        1. 4.6.2.1. Asia Pacific Yacht Market, by Country, 2016 - 2026 (K Units)
      3. 4.6.3. Asia Pacific Yacht Market, by Sales Channel, 2016 – 2026
        1. 4.6.3.1. Asia Pacific Yacht Market, by Sales Channel, 2016 – 2026 (USD Billion)
        2. 4.6.3.2. Asia Pacific Yacht Market, by Sales Channel, 2016 – 2026 (K Units)
      4. 4.6.4. Asia Pacific Yacht Market, by Application, 2016 – 2026
        1. 4.6.4.1. Asia Pacific Yacht Market, by Application, 2016 – 2026 (USD Billion)
        2. 4.6.4.2. Asia Pacific Yacht Market, by Application, 2016 – 2026 (K Units)
      5. 4.6.5. China
        1. 4.6.5.1. China Yacht Market, 2016 – 2026 (USD Billion)
        2. 4.6.5.2. China Yacht Market, 2016 – 2026 (K Units)
      6. 4.6.6. India
        1. 4.6.6.1. India Yacht Market, 2016 – 2026 (USD Billion)
        2. 4.6.6.2. India Yacht Market, 2016 – 2026 (K Units)
      7. 4.6.7. Japan
        1. 4.6.7.1. Japan Yacht Market, 2016 – 2026 (USD Billion)
        2. 4.6.7.2. Japan Yacht Market, 2016 – 2026 (K Units)
      8. 4.6.8. South Korea
        1. 4.6.8.1. South Korea Yacht Market, 2016 – 2026 (USD Billion)
        2. 4.6.8.2. South Korea Yacht Market, 2016 – 2026 (K Units)
      9. 4.6.9. South-East Asia
        1. 4.6.9.1. South-East Asia Yacht Market, 2016 – 2026 (USD Billion)
        2. 4.6.9.2. South-East Asia Yacht Market, 2016 – 2026 (K Units)
      10. 4.6.10. Rest of Asia Pacific
        1. 4.6.10.1. Rest of Asia Pacific Yacht Market, 2016 – 2026 (USD Billion)
        2. 4.6.10.2. Rest of Asia Pacific Yacht Market, 2016 – 2026 (K Units)
    7. 4.7. Latin America
      1. 4.7.1. Latin America Yacht Market, 2016 – 2026 (USD Billion)
        1. 4.7.1.1. Latin America Yacht Market, by Country, 2016 - 2026 (USD Billion)
      2. 4.7.2. Latin America Yacht Market, 2016 – 2026 (K Units)
        1. 4.7.2.1. Latin America Yacht Market, by Country, 2016 - 2026 (K Units)
      3. 4.7.3. Latin America Yacht Market, by Sales Channel, 2016 – 2026
        1. 4.7.3.1. Latin America Yacht Market, by Sales Channel, 2016 – 2026 (USD Billion)
        2. 4.7.3.2. Latin America Yacht Market, by Sales Channel, 2016 – 2026 (K Units)
      4. 4.7.4. Latin America Yacht Market, by Application, 2016 – 2026
        1. 4.7.4.1. Latin America Yacht Market, by Application, 2016 – 2026 (USD Billion)
        2. 4.7.4.2. Latin America Yacht Market, by Application, 2016 – 2026 (K Units)
      5. 4.7.5. Brazil
        1. 4.7.5.1. Brazil Yacht Market, 2016 – 2026 (USD Billion)
        2. 4.7.5.2. Brazil Yacht Market, 2016 – 2026 (K Units)
      6. 4.7.6. Mexico
        1. 4.7.6.1. Mexico Yacht Market, 2016 – 2026 (USD Billion)
        2. 4.7.6.2. Mexico Yacht Market, 2016 – 2026 (K Units)
      7. 4.7.7. Rest of Latin America
        1. 4.7.7.1. Rest of Latin America Yacht Market, 2016 – 2026 (USD Billion)
        2. 4.7.7.2. Rest of Latin America Yacht Market, 2016 – 2026 (K Units)
    8. 4.8. Middle East & Africa
      1. 4.8.1. Middle East & Africa Yacht Market, 2016 – 2026 (USD Billion)
        1. 4.8.1.1. Middle East & Africa Yacht Market, by Country, 2016 - 2026 (USD Billion)
      2. 4.8.2. Middle East & Africa Yacht Market, 2016 – 2026 (K Units)
        1. 4.8.2.1. Middle East & Africa Yacht Market, by Country, 2016 - 2026 (K Units)
      3. 4.8.3. Middle East & Africa Yacht Market, by Sales Channel, 2016 – 2026
        1. 4.8.3.1. Middle East & Africa Yacht Market, by Sales Channel, 2016 – 2026 (USD Billion)
        2. 4.8.3.2. Middle East & Africa Yacht Market, by Sales Channel, 2016 – 2026 (K Units)
      4. 4.8.4. Middle East & Africa Yacht Market, by Application, 2016 – 2026
        1. 4.8.4.1. Middle East & Africa Yacht Market, by Application, 2016 – 2026 (USD Billion)
        2. 4.8.4.2. Middle East & Africa Yacht Market, by Application, 2016 – 2026 (K Units)
      5. 4.8.5. GCC
        1. 4.8.5.1. GCC Yacht Market, 2016 – 2026 (USD Billion)
        2. 4.8.5.2. GCC Yacht Market, 2016 – 2026 (K Units)
      6. 4.8.6. South Africa
        1. 4.8.6.1. South Africa Yacht Market, 2016 – 2026 (USD Billion)
        2. 4.8.6.2. South Africa Yacht Market, 2016 – 2026 (K Units)
      7. 4.8.7. Rest of Middle East & Africa
        1. 4.8.7.1. Rest of Middle East & Africa Yacht Market, 2016 – 2026 (USD Billion)
        2. 4.8.7.2. Rest of Middle East & Africa Yacht Market, 2016 – 2026 (K Units)
  5. Chapter 5 Yacht Production, Consumption, Export, Import by Regions
    1. 5.1. Global Yacht Production and Consumption, 2016 – 2026 (K Units)
    2. 5.2. Global Import and Export Analysis, by Region
  6. Chapter 6 Yacht Market – Competitive Landscape
    1. 6.1. Competitor Market Share – Revenue
    2. 6.2. Market Concentration Rate Analysis, Top 3 and Top 5 Players
    3. 6.3. Competitor Market Share – Volume
    4. 6.4. Strategic Developments
      1. 6.4.1. Acquisitions and Mergers
      2. 6.4.2. New Products
      3. 6.4.3. Research & Development Activities
  7. Chapter 7 Company Profiles
    1. 7.1. Daisy Brand LLC
      1. 7.1.1. Company Overview
      2. 7.1.2. Product/Service Portfolio
      3. 7.1.3. Daisy Brand LLC Sales, Revenue, Price, and Gross Margin
      4. 7.1.4. Daisy Brand LLC Revenue and Growth Rate
      5. 7.1.5. Daisy Brand LLC Market Share
      6. 7.1.6. Recent Initiatives, Funding/VC Activities, and Technological Innovations
    2. 7.2. Dean Foods
      1. 7.2.1. Company Overview
      2. 7.2.2. Product/Service Portfolio
      3. 7.2.3. Dean Foods Sales, Revenue, Price, and Gross Margin
      4. 7.2.4. Dean Foods Revenue and Growth Rate
      5. 7.2.5. Dean Foods Market Share
      6. 7.2.6. Recent Initiatives, Funding/VC Activities, and Technological Innovations
    3. 7.3. Land O’ Lakes
      1. 7.3.1. Company Overview
      2. 7.3.2. Product/Service Portfolio
      3. 7.3.3. Land O’ Lakes Sales, Revenue, Price, and Gross Margin
      4. 7.3.4. Land O’ Lakes Revenue and Growth Rate
      5. 7.3.5. Land O’ Lakes Market Share
      6. 7.3.6. Recent Initiatives, Funding/VC Activities, and Technological Innovations
    4. 7.4. Scott Brothers Diary Inc.
      1. 7.4.1. Company Overview
      2. 7.4.2. Product/Service Portfolio
      3. 7.4.3. Scott Brothers Diary Inc. Sales, Revenue, Price, and Gross Margin
      4. 7.4.4. Scott Brothers Diary Inc. Revenue and Growth Rate
      5. 7.4.5. Scott Brothers Diary Inc. Market Share
      6. 7.4.6. Recent Initiatives, Funding/VC Activities, and Technological Innovations
    5. 7.5. Uelzena Ingredients
      1. 7.5.1. Company Overview
      2. 7.5.2. Product/Service Portfolio
      3. 7.5.3. Uelzena Ingredients Sales, Revenue, Price, and Gross Margin
      4. 7.5.4. Uelzena Ingredients Revenue and Growth Rate
      5. 7.5.5. Uelzena Ingredients Market Share
      6. 7.5.6. Recent Initiatives, Funding/VC Activities, and Technological Innovations
    6. 7.6. Compsey Creamery
      1. 7.6.1. Company Overview
      2. 7.6.2. Product/Service Portfolio
      3. 7.6.3. Compsey Creamery Sales, Revenue, Price, and Gross Margin
      4. 7.6.4. Compsey Creamery Revenue and Growth Rate
      5. 7.6.5. Compsey Creamery Market Share
      6. 7.6.6. Recent Initiatives, Funding/VC Activities, and Technological Innovations
    7. 7.7. Prairie Farms Dairy
      1. 7.7.1. Company Overview
      2. 7.7.2. Product/Service Portfolio
      3. 7.7.3. Prairie Farms Dairy Sales, Revenue, Price, and Gross Margin
      4. 7.7.4. Prairie Farms Dairy Revenue and Growth Rate
      5. 7.7.5. Prairie Farms Dairy Market Share
      6. 7.7.6. Recent Initiatives, Funding/VC Activities, and Technological Innovations
    8. 7.8. HP Hood LLC
      1. 7.8.1. Company Overview
      2. 7.8.2. Product/Service Portfolio
      3. 7.8.3. HP Hood LLC Sales, Revenue, Price, and Gross Margin
      4. 7.8.4. HP Hood LLC Revenue and Growth Rate
      5. 7.8.5. HP Hood LLC Market Share
      6. 7.8.6. Recent Initiatives, Funding/VC Activities, and Technological Innovations
    9. 7.9. Cabot Creamery
      1. 7.9.1. Company Overview
      2. 7.9.2. Product/Service Portfolio
      3. 7.9.3. Cabot Creamery Sales, Revenue, Price, and Gross Margin
      4. 7.9.4. Cabot Creamery Revenue and Growth Rate
      5. 7.9.5. Cabot Creamery Market Share
      6. 7.9.6. Recent Initiatives, Funding/VC Activities, and Technological Innovations
    10. 7.10. Barambah Organics Pty Ltd.
      1. 7.10.1. Company Overview
      2. 7.10.2. Product/Service Portfolio
      3. 7.10.3. Barambah Organics Pty Ltd. Sales, Revenue, Price, and Gross Margin
      4. 7.10.4. Barambah Organics Pty Ltd. Revenue and Growth Rate
      5. 7.10.5. Barambah Organics Pty Ltd. Market Share
      6. 7.10.6. Recent Initiatives, Funding/VC Activities, and Technological Innovations
    11. 7.11. Meggle
      1. 7.11.1. Company Overview
      2. 7.11.2. Product/Service Portfolio
      3. 7.11.3. Meggle Sales, Revenue, Price, and Gross Margin
      4. 7.11.4. Meggle Revenue and Growth Rate
      5. 7.11.5. Meggle Market Share
      6. 7.11.6. Recent Initiatives, Funding/VC Activities, and Technological Innovations
  8. Chapter 8 Yacht — Industry Analysis
    1. 8.1. Introduction and Taxonomy
    2. 8.2. Yacht Market – Key Trends
      1. 8.2.1. Market Drivers
      2. 8.2.2. Market Restraints
      3. 8.2.3. Market Opportunities
    3. 8.3. Value Chain Analysis
    4. 8.4. Key Mandates and Regulations
    5. 8.5. Technology Roadmap and Timeline
    6. 8.6. Yacht Market – Attractiveness Analysis
      1. 8.6.1. By Sales Channel
      2. 8.6.2. By Application
      3. 8.6.3. By Region
  9. Chapter 9 Raw Material Analysis
    1. 9.1. Yacht Key Raw Material Analysis
      1. 9.1.1. Key Raw Materials
      2. 9.1.2. Price Trend of Key Raw Materials
    2. 9.2. Key Suppliers of Raw Materials
    3. 9.3. Proportion of Manufacturing Cost Structure
      1. 9.3.1. Raw Materials Cost
      2. 9.3.2. Labor Cost
      3. 9.3.3. Manufacturing Expenses
      4. 9.3.4. Miscellaneous Expenses
    4. 9.4. Manufacturing Cost Analysis of Yacht
  10. Chapter 10 Industrial Chain, Sourcing Strategy, and Downstream Buyers
    1. 10.1. Yacht Industrial Chain Analysis
    2. 10.2. Upstream Raw Materials Sourcing
      1. 10.2.1. Risk Mitigation:
      2. 10.2.2. Supplier Relationships:
      3. 10.2.3. Business Processes:
      4. 10.2.4. Securing the Product:
    3. 10.3. Raw Materials Sources of Yacht Major Manufacturers
    4. 10.4. Downstream Buyers
    5. 10.5. Distributors/Traders List
  11. Chapter 11 Marketing Strategy Analysis, Distributors
    1. 11.1. Marketing Channel
    2. 11.2. Direct Marketing
    3. 11.3. Indirect Marketing
    4. 11.4. Marketing Channel Development Trends
    5. 11.5. Economic/Political Environmental Change
  12. Chapter 12 Report Conclusion & Key Insights
    1. 12.1. Key Insights from Primary Interviews & Surveys Respondents
    2. 12.2. Key Takeaways from Analysts, Consultants, and Industry Leaders
  13. Chapter 13 Research Approach & Methodology
    1. 13.1. Report Description
    2. 13.2. Research Scope
    3. 13.3. Research Methodology
      1. 13.3.1. Secondary Research
      2. 13.3.2. Primary Research
      3. 13.3.3. Statistical Models
        1. 13.3.3.1. Company Share Analysis Model
        2. 13.3.3.2. Revenue Based Modeling
      4. 13.3.4. Research Limitations

      List of Figures

      Fig.1	Product Picture of Yacht
      Fig.2	Global Yacht Market, 2016 – 2026 (USD Billion)
      Fig.3	Global Yacht Market, 2016 – 2026 (K Units)
      Fig.4	Global Yacht Market Absolute Revenue Opportunity, 2016 – 2026 (USD Billion)
      Fig.5	Global Yacht Market Incremental Revenue Opportunity, 2020 – 2026 (USD Billion)
      Fig.6	Global Yacht Market Share, by Sales Channel, 2020 & 2026 (USD Billion)
      Fig.7	Global Yacht Market Share, by Sales Channel, 2020 & 2026 (K Units)
      Fig.8	Global Premium Food Service Yacht Market, 2016 – 2026 (USD Billion)
      Fig.9	Global Premium Food Service Yacht Market, 2016 – 2026 (K Units)
      Fig.10	Global Non Premium Food Service Yacht Market, 2016 – 2026 (USD Billion)
      Fig.11	Global Non Premium Food Service Yacht  Market, 2016 – 2026 (K Units)
      Fig.12	Global B2B Yacht Market, 2016 – 2026 (USD Billion)
      Fig.13	Global B2B Yacht  Market, 2016 – 2026 (K Units)
      Fig.14	Global Yacht Market Share, by Application, 2020 & 2026 (USD Billion)
      Fig.15	Global Yacht Market Share, by Application, 2020 & 2026 (K Units)
      Fig.16	Global Savory Yacht Market, 2016 – 2026 (USD Billion)
      Fig.17	Global Savory Yacht  Market, 2016 – 2026 (K Units)
      Fig.18	Global Sandwich Yacht Market, 2016 – 2026 (USD Billion)
      Fig.19	Global Sandwich Yacht  Market, 2016 – 2026 (K Units)
      Fig.20	Global Salad Dressings & Dip Yacht Market, 2016 – 2026 (USD Billion)
      Fig.21	Global Salad Dressings & Dip Yacht  Market, 2016 – 2026 (K Units)
      Fig.22	Global Baked Goods/Desserts Yacht Market, 2016 – 2026 (USD Billion)
      Fig.23	Global Baked Goods/Desserts Yacht  Market, 2016 – 2026 (K Units)
      Fig.24	Global Ice Creams & Smoothies Yacht Market, 2016 – 2026 (USD Billion)
      Fig.25	Global Ice Creams & Smoothies Yacht  Market, 2016 – 2026 (K Units)
      Fig.26	Global Yacht Market Share, by Region, 2020 & 2026 (USD Billion)
      Fig.27	Global Yacht Market Share, by Region, 2020 & 2026 (K Units)
      Fig.28	North America Yacht Market, 2016 – 2026 (USD Billion)
      Fig.29	North America Yacht Market, 2016 – 2026 (K Units)
      Fig.30	U.S. Yacht Market, 2016 – 2026 (USD Billion)
      Fig.31	U.S. Yacht  Market, 2016 – 2026 (K Units)
      Fig.32	Canada Yacht Market, 2016 – 2026 (USD Billion)
      Fig.33	Canada Yacht  Market, 2016 – 2026 (K Units)
      Fig.34	Europe Yacht Market, 2016 – 2026 (USD Billion)
      Fig.35	Europe Yacht  Market, 2016 – 2026 (K Units)
      Fig.36	Germany Yacht Market, 2016 – 2026 (USD Billion)
      Fig.37	Germany Yacht  Market, 2016 – 2026 (K Units)
      Fig.38	France Yacht Market, 2016 – 2026 (USD Billion)
      Fig.39	France Yacht  Market, 2016 – 2026 (K Units)
      Fig.40	U.K. Yacht Market, 2016 – 2026 (USD Billion)
      Fig.41	U.K. Yacht  Market, 2016 – 2026 (K Units)
      Fig.42	Italy Yacht Market, 2016 – 2026 (USD Billion)
      Fig.43	Italy Yacht  Market, 2016 – 2026 (K Units)
      Fig.44	Spain Yacht Market, 2016 – 2026 (USD Billion)
      Fig.45	Spain Yacht  Market, 2016 – 2026 (K Units)
      Fig.46	Rest of Europe Yacht Market, 2016 – 2026 (USD Billion)
      Fig.47	Rest of Europe Yacht  Market, 2016 – 2026 (K Units)
      Fig.48	Asia Pacific Yacht Market, 2016 – 2026 (USD Billion)
      Fig.49	Asia Pacific Yacht  Market, 2016 – 2026 (K Units)
      Fig.50	China Yacht Market, 2016 – 2026 (USD Billion)
      Fig.51	China Yacht  Market, 2016 – 2026 (K Units)
      Fig.52	India Yacht Market, 2016-2026 (USD Billion)
      Fig.53	India Yacht  Market, 2016 – 2026 (K Units)
      Fig.54	Japan Yacht Market, 2016 – 2026 (USD Billion)
      Fig.55	Japan Yacht  Market, 2016 – 2026 (K Units)
      Fig.56	South Korea Yacht Market, 2016 – 2026 (USD Billion)
      Fig.57	South Korea Yacht  Market, 2016 – 2026 (K Units)
      Fig.58	South-East Asia Yacht Market, 2016 – 2026 (USD Billion)
      Fig.59	South-East Asia Yacht  Market, 2016 – 2026 (K Units)
      Fig.60	Rest of Asia Pacific Yacht Market, 2016 – 2026 (USD Billion)
      Fig.61	Rest of Asia Pacific Yacht  Market, 2016 – 2026 (K Units)
      Fig.62	Latin America Yacht Market, 2016 – 2026 (USD Billion)
      Fig.63	Latin America Yacht  Market, 2016 – 2026 (K Units)
      Fig.64	Brazil Yacht Market, 2016 – 2026 (USD Billion)
      Fig.65	Brazil Yacht  Market, 2016 – 2026 (K Units)
      Fig.66	Mexico Yacht Market, 2016 – 2026 (USD Billion)
      Fig.67	Mexico Yacht  Market, 2016 – 2026 (K Units)
      Fig.68	Rest of Latin America Yacht Market, 2016 – 2026 (USD Billion)
      Fig.69	Rest of Latin America Yacht  Market, 2016 – 2026 (K Units)
      Fig.70	Middle East & Africa Yacht Market, 2016 – 2026 (USD Billion)
      Fig.71	Middle East & Africa Yacht  Market, 2016 – 2026 (K Units)
      Fig.72	GCC Yacht Market, 2016 – 2026 (USD Billion)
      Fig.73	GCC Yacht Market, 2016 – 2026 (K Units)
      Fig.74	South Africa Yacht Market, 2016 – 2026 (USD Billion)
      Fig.75	South Africa Yacht  Market, 2016 – 2026 (K Units)
      Fig.76	Rest of Middle East & Africa Yacht Market, 2016 – 2026 (USD Billion)
      Fig.77	Rest of Middle East & Africa Yacht Market, 2016 – 2026 (K Units)
      Fig.78	Global Yacht Production and Consumption, 2016 – 2026 (K Units)
      Fig.79	North America Yacht Production and Consumption, 2016 – 2026 (K Units)
      Fig.80	Europe Yacht Production and Consumption, 2016 – 2026 (USD Billion) (K Units)
      Fig.81	Asia Pacific Yacht Production and Consumption, 2016 – 2026 (USD Billion) (K Units)
      Fig.82	Latin America Yacht Production and Consumption, 2016 – 2026 (USD Billion) (K Units)
      Fig.83	Middle East and Africa Yacht Production and Consumption, 2016 – 2026 (USD Billion) (K Units)
      Fig.84	Competitor Market Share – Revenue
      Fig.85	Competitor Market Share – Volume
      Fig.86	Daisy Brand LLC Revenue and Growth Rate
      Fig.87	Daisy Brand LLC Market Share
      Fig.88	Market Dynamics
      Fig.89	Global Yacht – Value Chain Analysis
      Fig.90	Key Mandates and Regulations
      Fig.91	Technology Roadmap and Timeline
      Fig.92	Market Attractiveness Analysis – By Sales Channel
      Fig.93	Market Attractiveness Analysis – By Application
      Fig.94	Market Attractiveness Analysis – By Region
      Fig.95	Manufacturing Cost Structure of Yacht
      Fig.96	Yacht Industrial Chain Analysis
      Fig.97	Market Channels
      Fig.98	Marketing Channel Development Trend
      Fig.99	Growth in World Gross Product, 2008-2018
      

      List of Tables

      Table 1	Global Yacht Market, 2020 & 2026 (USD Billion)
      Table 2	Global Yacht Market, by Sales Channel, 2016 – 2026 (USD Billion)
      Table 3	Global Yacht Market, by Sales Channel, 2016 – 2026 (K Units)
      Table 4	Global Yacht Market, by Application, 2016 – 2026 (USD Billion)
      Table 5	Global Yacht Market, by Application, 2016 – 2026 (K Units)
      Table 6	Global Yacht Market, by Region, 2016 – 2026 (USD Billion)
      Table 7	Global Yacht Market, by Region, 2016 – 2026 (K Units)
      Table 8	North America Yacht Market, by Country, 2016 – 2026 (USD Billion)
      Table 9	North America Yacht Market, by Country, 2016 – 2026 (K Units)
      Table 10North America Yacht Market, by Sales Channel, 2016 – 2026 (USD Billion)
      Table 11  North America Yacht Market, by Sales Channel, 2016 – 2026 (K Units)
      Table 12 North America Yacht Market, by Application, 2016 – 2026 (USD Billion)
      Table 13 North America Yacht Market, by Application, 2016 – 2026 (K Units)
      Table 14 Europe Yacht Market, by Country, 2016 – 2026 (USD Billion)
      Table 15 Europe Yacht Market, by Country, 2016 – 2026 (K Units)
      Table 16 Europe Yacht Market, by Sales Channel, 2016 – 2026 (USD Billion)
      Table 17 Europe Yacht Market, by Sales Channel, 2016 – 2026 (K Units)
      Table 18 Europe Yacht Market, by Application, 2016 – 2026 (USD Billion)
      Table 19 Europe Yacht Market, by Application, 2016 – 2026 (K Units)
      Table 20 Asia Pacific Yacht Market, by Country, 2016 – 2026 (USD Billion)
      Table 21 Europe Yacht Market, by Country, 2016 – 2026 (K Units)
      Table 22 Asia Pacific Yacht Market, by Sales Channel, 2016 – 2026 (USD Billion)
      Table 23 Asia Pacific Yacht Market, by Sales Channel, 2016 – 2026 (K Units)
      Table 24 Asia Pacific Yacht Market, by Application (Recipes), 2016 – 2026 (USD Billion)
      Table 25 Asia Pacific Yacht Market, by Application, 2016 – 2026 (K Units)
      Table 26 Latin America Yacht Market, by Country, 2016 – 2026 (USD Billion)
      Table 27 Latin America Yacht Market, by Country, 2016 – 2026 (K Units)
      Table 28 Latin America Yacht Market, by Sales Channel, 2016 – 2026 (USD Billion)
      Table 29 Latin America Yacht Market, by Sales Channel, 2016 – 2026 (K Units)
      Table 30 Latin America Yacht Market, by Application, 2016 – 2026 (USD Billion)
      Table 31 Latin America Yacht Market, by Application, 2016 – 2026 (K Units)
      Table 32 Middle East & Africa Yacht Market, by Country, 2016 – 2026 (USD Billion)
      Table 33 Middle East & Africa Yacht Market, by Country, 2016 – 2026 (K Units)
      Table 34 Middle East & Africa Yacht Market, by Sales Channel, 2016 – 2026 (USD Billion)
      Table 35 Middle East & Africa Yacht Market, by Sales Channel, 2016 – 2026 (K Units)
      Table 36 Middle East & Africa Yacht Market, by Application, 2016 – 2026 (USD Billion)
      Table 37 Middle East & Africa Yacht Market, by Application, 2016 – 2026 (K Units)
      Table 38 North America Yacht Production, Consumption, Export, Import, 2016 – 2019
      Table 39 Europe Yacht Production, Consumption, Export, Import, 2016 – 2019
      Table 40 Asia Pacific Yacht Production, Consumption, Export, Import, 2016 – 2019
      Table 41 Latin America Yacht Production, Consumption, Export, Import, 2016 – 2019
      Table 42 Middle East & Africa Yacht Production, Consumption, Export, Import, 2016 – 2019
      Table 43 Global Yacht Market - Company Revenue Analysis, 2016 – 2019 (USD Billion)
      Table 44 Global Yacht Market - Company Revenue Share Analysis, 2016 – 2019 (%)
      Table 45 Global Yacht Market - Company Volume Analysis, 2016 – 2019 (K Units)
      Table 46 Global Yacht Market - Company Volume Share Analysis, 2016 – 2019 (%)
      Table 47 Acquisitions and Mergers
      Table 48 Market Drivers – Impact Analysis
      Table 49 Market Restraints
      Table 50 Market Opportunities
      Table 51 Production Base and Market Concentration Rate of Raw Material
      Table 52 Key Suppliers of Raw Materials
      Table 53 Raw Materials Sources of Yacht Major Manufacturers
      Table 54 Major Buyers of Yacht
      Table 55 Distributors/Traders of Yacht by Region
      

Industry Major Market Players

  • Alexander Marine International 
  • Azimut - Benetti S.P.A. 
  • Brunswick Corporation 
  • Viking Yacht Company 
  • Christensen Shipyards LLC 
  • SanlorenzoS.p.A 
  • Feadship Holland B.V. 
  • FincantieriS.p.A. (CDP IndustriaS.p.A.) 
  • Damen Shipyards Group N.V. 
  • Heesen Yachts Sales B.V 
  • Horizon Yacht USA (Metal Shark Boats) 
  • Palumbo Group S.P.A 
  • Princess Yachts Limited (LVMH Group) 
  • Sunseeker International (Wanda Group)