Search Market Research Report

Discover Our Latest Reports
Discover Our Featured Reports
Discover Top Selling Reports

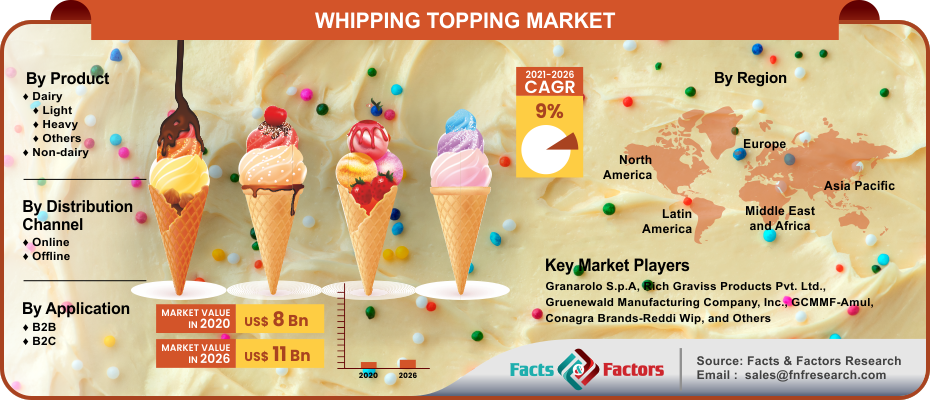
Whipping Topping Market Size, Share Global Analysis Report, 2021 – 2026

report img

Whipping Topping Market By Product (Dairy and Non-Dairy), By Distribution Channel (Online and Offline), By Application (B2B and B2C), And By Regions - Global & Regional Industry Perspective, Comprehensive Analysis, and Forecast 2021 – 2026

Industry Insights

[198+ Pages Report] The global whipping topping market size was assessed to be around USD 8 Billion in 2020 and is expected to grow at a CAGR of 9% from 2021 to 2026 to a value of USD 11 Billion by 2026.

logoMarket Overview

Whipping cream is generally used to add a softer, fluffy, and creamy texture to pastry and bakery products. This texture is expected to stay for a longer time. The demand for this product is found to be growing in household food, soup, meat, bakery, ready-cooked dishes, desserts, ice cream, and homely coffee preparations. Additionally, the inclination toward natural/organic products is expected to further propel the global whipping topping market over the forecast period as the consumers are trying to avoid the consumption of chemical pesticides and fertilizers containing food.

logoIndustry Growth Factors

Growing consumption of foods like ice creams, pies, hot chocolate milkshakes, cupcakes, sundaes, cakes, cheesecake, waffles, and puddings is expected to be the key factor driving the product demand. The increasing use of whipping topping in different deserts such as layered cakes, profiteroles, and also as a decorative component for delicacies like signature cakes and themed deserts is projected to drive the global whipping topping market. Furthermore, the rising demand for 30­36% of fat content due to more health consciousness among consumers will further augment market growth during the forecast period. The availability of whipped creams in different flavors such as vanilla, orange, cinnamon, coffee, rose, chocolate, and kahlua is expected to fuel the demand for the whipping topping market. Moreover, the rising popularity of social media due to a high number of food bloggers & the availability of posts and videos regarding whipping creams’ utilization in pies, cakes, tarts, etc. will bolster the global whipping topping market.

Whipping Topping Market

To know more about this report | Request Free Sample Copy

logoSegmentation Analysis

The global whipping topping market is divided into product, distribution channel, application, and regions.

Based on product, the market is segmented into dairy and non-dairy. The dairy products segment is expected to hold the highest market share during the forecast period due to its preference among retail customers, commercial bakers, and chefs as it is cost-effective compared to vegan products. Moreover, the diverse fat contents make it a preferable option among health-conscious customers. The global whipping topping market is classified into online and offline. The online category is projected to dominate the market due to rising online sales because of the internet usage among consumers to gain better access to different brands and various whipping topping products. The growing opportunities for the sales of whipping cream on the online platform due to reliability and security will drive the demand for whipping topping. The idea of increasing margins by reducing costs as per the vendors will benefit the market over the forecast period. On the basis of application, the whipping topping market is categorized into B2B and B2C. From all these, B2B accounts for the largest market share as the baking industry is flourishing at a rapid rate. Furthermore, the growing demand for natural, whole grains and preservative absent products will drive the demand for low-fat whipping topping. The interest in paying for healthy and costly food products also helps drive this segment.

logo Report Scope

Report Attribute

Details

Market Size in 2020

USD 8 Billion

Projected Market Size in 2026

USD 11 Billion

CAGR Growth Rate

9% CAGR

Base Year

2020

Forecast Years

2021-2026

Key Market Players

Granarolo S.p.A, Rich Graviss Products Pvt. Ltd., Gruenewald Manufacturing Company Inc., GCMMF-Amul, Conagra Brands-Reddi Wip, and Others

Key Segment

By Product, By Distribution Channel, By Application, and Region

Major Regions Covered

North America, Europe, Asia Pacific, Latin America, and Middle East & Africa

Purchase Options

Request customized purchase options to meet your research needs. Explore purchase options

logo Regional Analysis

The global whipping topping market is estimated to be led by Europe over the forecast period. The basic reason behind the market growth is the demand for whipping topping markets in regions such as the U.K., Netherlands, Germany, Belgium, and France. Additionally, the use of this product in coffee and pancakes in European regions on a large scale also boost the demand. On the other hand, Asia Pacific exhibits the fastest growth owing to rising investments in capital intensive tools for easy animal rearing and development of milk products in regions such as India and China, The presence of vitamins A, D, E, K, and choline as well as diet-consciousness among consumers is estimated to augment the global whipping topping market expansion.

logo Competitive Players

Some of the major players dominating the global whipping topping market include

  • Granarolo S.p.A
  • Rich Graviss Products Pvt. Ltd.
  • Gruenewald Manufacturing Company Inc.
  • GCMMF-Amul
  • Conagra Brands-Reddi Wip
  • Cabot Creamery
  • Borden Dairy Company
  • Gay Lea Foods Co-operative Ltd.
  • Narsaria’s
  • Hanan Products Co. Inc.

logo By Product Segment Analysis

  • Dairy
    • Light
    • Heavy
    • Others
  • Non-dairy

logo By Distribution Channel Segment Analysis

  • Online
  • Offline

logo By Application Segment Analysis

  • B2B
  • B2C

logo By Regional Segment Analysis

  • North America
    • U.S.
    • Canada
  • Europe
    • UK
    • France
    • Germany
    • Italy
    • Spain
    • Rest of Europe
  • Asia Pacific
    • China
    • Japan
    • India
    • South Korea
    • Southeast Asia
    • Rest of Asia Pacific
  • Latin America
    • Brazil
    • Mexico
    • Rest of Latin America
  • Middle East and Africa
    • GCC Countries
    • South Africa
    • Rest of MEA

Table of Content

  1. Chapter 1 Executive Summary
    1. 1.1. Introduction of Whipping Topping
    2. 1.2. Global Whipping Topping Market, 2019 & 2026 (USD Billion)
    3. 1.3. Global Whipping Topping Market, 2016 – 2026 (USD Billion)
    4. 1.4. Global Whipping Topping Market Absolute Revenue Opportunity, 2016 – 2026 (USD Billion)
    5. 1.5. Global Whipping Topping Market Incremental Revenue Opportunity, 2020 – 2026 (USD Billion)
  2. Chapter 2 Whipping Topping Market – Product Analysis
    1. 2.1. Global Whipping Topping Market – Product Overview
    2. 2.2. Global Whipping Topping Market Share, by Product, 2019 & 2026 (USD Billion)
    3. 2.3. Dairy
      1. 2.3.1. Global Dairy Whipping Topping Market, 2016 – 2026 (USD Billion)
    4. 2.4. Non-Dairy
      1. 2.4.1. Global Non-Dairy Whipping Topping Market, 2016 – 2026 (USD Billion)
  3. Chapter 3 Whipping Topping Market – Distribution Channel Analysis
    1. 3.1. Global Whipping Topping Market – Distribution Channel Overview
    2. 3.2. Global Whipping Topping Market Share, by Distribution Channel, 2019 & 2026 (USD Billion)
    3. 3.3. Online
      1. 3.3.1. Global Online Whipping Topping Market, 2016 – 2026 (USD Billion)
    4. 3.4. Offline
      1. 3.4.1. Global Offline Whipping Topping Market, 2016 – 2026 (USD Billion)
  4. Chapter 4 Whipping Topping Market – Application Analysis
    1. 4.1. Global Whipping Topping Market – Application Overview
    2. 4.2. Global Whipping Topping Market Share, by Application, 2019 & 2026 (USD Billion)
    3. 4.3. B2B
      1. 4.3.1. Global B2B Whipping Topping Market, 2016 – 2026 (USD Billion)
    4. 4.4. B2C
      1. 4.4.1. Global B2C Whipping Topping Market, 2016 – 2026 (USD Billion)
  5. Chapter 5 Whipping Topping Market – Regional Analysis
    1. 5.1. Global Whipping Topping Market Regional Overview
    2. 5.2. Global Whipping Topping Market Share, by Region, 2019 & 2026 (USD Billion)
    3. 5.3. North America
      1. 5.3.1. North America Whipping Topping Market, 2016 – 2026 (USD Billion)
        1. 5.3.1.1. North America Whipping Topping Market, by Country, 2016 - 2026 (USD Billion)
      2. 5.3.2. North America Whipping Topping Market, by Product, 2016 – 2026
        1. 5.3.2.1. North America Whipping Topping Market, by Product, 2016 – 2026 (USD Billion)
      3. 5.3.3. North America Whipping Topping Market, by Distribution Channel, 2016 – 2026
        1. 5.3.3.1. North America Whipping Topping Market, by Distribution Channel, 2016 – 2026 (USD Billion)
      4. 5.3.4. North America Whipping Topping Market, by Application, 2016 – 2026
        1. 5.3.4.1. North America Whipping Topping Market, by Application, 2016 – 2026 (USD Billion)
      5. 5.3.5. U.S.
        1. 5.3.5.1. U.S. Whipping Topping Market, 2016 – 2026 (USD Billion)
      6. 5.3.6. Canada
        1. 5.3.6.1. Canada Whipping Topping Market, 2016 – 2026 (USD Billion)
    4. 5.4. Europe
      1. 5.4.1. Europe Whipping Topping Market, 2016 – 2026 (USD Billion)
        1. 5.4.1.1. Europe Whipping Topping Market, by Country, 2016 - 2026 (USD Billion)
      2. 5.4.2. Europe Whipping Topping Market, by Product, 2016 – 2026
        1. 5.4.2.1. Europe Whipping Topping Market, by Product, 2016 – 2026 (USD Billion)
      3. 5.4.3. Europe Whipping Topping Market, by Distribution Channel, 2016 – 2026
        1. 5.4.3.1. Europe Whipping Topping Market, by Distribution Channel, 2016 – 2026 (USD Billion)
      4. 5.4.4. Europe Whipping Topping Market, by Application, 2016 – 2026
        1. 5.4.4.1. Europe Whipping Topping Market, by Application, 2016 – 2026 (USD Billion)
      5. 5.4.5. Germany
        1. 5.4.5.1. Germany Whipping Topping Market, 2016 – 2026 (USD Billion)
      6. 5.4.6. France
        1. 5.4.6.1. France Whipping Topping Market, 2016 – 2026 (USD Billion)
      7. 5.4.7. U.K.
        1. 5.4.7.1. U.K. Whipping Topping Market, 2016 – 2026 (USD Billion)
      8. 5.4.8. Italy
        1. 5.4.8.1. Italy Whipping Topping Market, 2016 – 2026 (USD Billion)
      9. 5.4.9. Spain
        1. 5.4.9.1. Spain Whipping Topping Market, 2016 – 2026 (USD Billion)
      10. 5.4.10. Rest of Europe
        1. 5.4.10.1. Rest of Europe Whipping Topping Market, 2016 – 2026 (USD Billion)
    5. 5.5. Asia Pacific
      1. 5.5.1. Asia Pacific Whipping Topping Market, 2016 – 2026 (USD Billion)
        1. 5.5.1.1. Asia Pacific Whipping Topping Market, by Country, 2016 - 2026 (USD Billion)
      2. 5.5.2. Asia Pacific Whipping Topping Market, by Product, 2016 – 2026
        1. 5.5.2.1. Asia Pacific Whipping Topping Market, by Product, 2016 – 2026 (USD Billion)
      3. 5.5.3. Asia Pacific Whipping Topping Market, by Distribution Channel, 2016 – 2026
        1. 5.5.3.1. Asia Pacific Whipping Topping Market, by Distribution Channel, 2016 – 2026 (USD Billion)
      4. 5.5.4. Asia Pacific Whipping Topping Market, by Application, 2016 – 2026
        1. 5.5.4.1. Asia Pacific Whipping Topping Market, by Application, 2016 – 2026 (USD Billion)
      5. 5.5.5. China
        1. 5.5.5.1. China Whipping Topping Market, 2016 – 2026 (USD Billion)
      6. 5.5.6. Japan
        1. 5.5.6.1. Japan Whipping Topping Market, 2016 – 2026 (USD Billion)
      7. 5.5.7. India
        1. 5.5.7.1. India Whipping Topping Market, 2016 – 2026 (USD Billion)
      8. 5.5.8. South Korea
        1. 5.5.8.1. South Korea Whipping Topping Market, 2016 – 2026 (USD Billion)
      9. 5.5.9. South-East Asia
        1. 5.5.9.1. South-East Asia Whipping Topping Market, 2016 – 2026 (USD Billion)
      10. 5.5.10. Rest of Asia Pacific
        1. 5.5.10.1. Rest of Asia Pacific Whipping Topping Market, 2016 – 2026 (USD Billion)
    6. 5.6. Latin America
      1. 5.6.1. Latin America Whipping Topping Market, 2016 – 2026 (USD Billion)
        1. 5.6.1.1. Latin America Whipping Topping Market, by Country, 2016 - 2026 (USD Billion)
      2. 5.6.2. Latin America Whipping Topping Market, by Product, 2016 – 2026
        1. 5.6.2.1. Latin America Whipping Topping Market, by Product, 2016 – 2026 (USD Billion)
      3. 5.6.3. Latin America Whipping Topping Market, by Distribution Channel, 2016 – 2026
        1. 5.6.3.1. Latin America Whipping Topping Market, by Distribution Channel, 2016 – 2026 (USD Billion)
      4. 5.6.4. Latin America Whipping Topping Market, by Application, 2016 – 2026
        1. 5.6.4.1. Latin America Whipping Topping Market, by Application, 2016 – 2026 (USD Billion)
      5. 5.6.5. Brazil
        1. 5.6.5.1. Brazil Whipping Topping Market, 2016 – 2026 (USD Billion)
      6. 5.6.6. Mexico
        1. 5.6.6.1. Mexico Whipping Topping Market, 2016 – 2026 (USD Billion)
      7. 5.6.7. Rest of Latin America
        1. 5.6.7.1. Rest of Latin America Whipping Topping Market, 2016 – 2026 (USD Billion)
    7. 5.7. The Middle-East and Africa
      1. 5.7.1. The Middle-East and Africa Whipping Topping Market, 2016 – 2026 (USD Billion)
        1. 5.7.1.1. The Middle-East and Africa Whipping Topping Market, by Country, 2016 - 2026 (USD Billion)
      2. 5.7.2. The Middle-East and Africa Whipping Topping Market, by Product, 2016 – 2026
        1. 5.7.2.1. The Middle-East and Africa Whipping Topping Market, by Product, 2016 – 2026 (USD Billion)
      3. 5.7.3. The Middle-East and Africa Whipping Topping Market, by Distribution Channel, 2016 – 2026
        1. 5.7.3.1. The Middle-East and Africa Whipping Topping Market, by Distribution Channel, 2016 – 2026 (USD Billion)
      4. 5.7.4. The Middle-East and Africa Whipping Topping Market, by Application, 2016 – 2026
        1. 5.7.4.1. The Middle-East and Africa Whipping Topping Market, by Application, 2016 – 2026 (USD Billion)
      5. 5.7.5. GCC Countries
        1. 5.7.5.1. GCC Countries Whipping Topping Market, 2016 – 2026 (USD Billion)
      6. 5.7.6. South Africa
        1. 5.7.6.1. South Africa Whipping Topping Market, 2016 – 2026 (USD Billion)
      7. 5.7.7. Rest of Middle-East Africa
        1. 5.7.7.1. Rest of Middle-East Africa Whipping Topping Market, 2016 – 2026 (USD Billion)
  6. Chapter 6 Whipping Topping Market – Competitive Landscape
    1. 6.1. Competitor Market Share – Revenue
    2. 6.2. Market Concentration Rate Analysis, Top 3 and Top 5 Players
    3. 6.3. Strategic Developments
      1. 6.3.1. Acquisitions and Mergers
      2. 6.3.2. New Products
      3. 6.3.3. Research & Development Activities
  7. Chapter 7 Company Profiles
    1. 7.1. Granarolo S.p.A
      1. 7.1.1. Company Overview
      2. 7.1.2. Product/Service Portfolio
      3. 7.1.3. Granarolo S.p.A Sales, Revenue, and Gross Margin
      4. 7.1.4. Granarolo S.p.A Revenue and Growth Rate
      5. 7.1.5. Granarolo S.p.A Market Share
      6. 7.1.6. Recent Initiatives, Funding/VC Activities, and Technological Innovations
    2. 7.2. Rich Graviss Products Pvt. Ltd.
      1. 7.2.1. Company Overview
      2. 7.2.2. Product/Service Portfolio
      3. 7.2.3. Rich Graviss Products Pvt. Ltd. Sales, Revenue, and Gross Margin
      4. 7.2.4. Rich Graviss Products Pvt. Ltd. Revenue and Growth Rate
      5. 7.2.5. Rich Graviss Products Pvt. Ltd. Market Share
      6. 7.2.6. Recent Initiatives, Funding/VC Activities, and Technological Innovations
    3. 7.3. Gruenewald Manufacturing Company Inc.
      1. 7.3.1. Company Overview
      2. 7.3.2. Product/Service Portfolio
      3. 7.3.3. Gruenewald Manufacturing Company Inc. Sales, Revenue, and Gross Margin
      4. 7.3.4. Gruenewald Manufacturing Company Inc. Revenue and Growth Rate
      5. 7.3.5. Gruenewald Manufacturing Company Inc. Market Share
      6. 7.3.6. Recent Initiatives, Funding/VC Activities, and Technological Innovations
    4. 7.4. GCMMF-Amul
      1. 7.4.1. Company Overview
      2. 7.4.2. Product/Service Portfolio
      3. 7.4.3. GCMMF-Amul Sales, Revenue, and Gross Margin
      4. 7.4.4. GCMMF-Amul Revenue and Growth Rate
      5. 7.4.5. GCMMF-Amul Market Share
      6. 7.4.6. Recent Initiatives, Funding/VC Activities, and Technological Innovations
    5. 7.5. Conagra Brands-Reddi Wip
      1. 7.5.1. Company Overview
      2. 7.5.2. Product/Service Portfolio
      3. 7.5.3. Conagra Brands-Reddi Wip Sales, Revenue, and Gross Margin
      4. 7.5.4. Conagra Brands-Reddi Wip Revenue and Growth Rate
      5. 7.5.5. Conagra Brands-Reddi Wip Market Share
      6. 7.5.6. Recent Initiatives, Funding/VC Activities, and Technological Innovations
    6. 7.6. Cabot Creamery
      1. 7.6.1. Company Overview
      2. 7.6.2. Product/Service Portfolio
      3. 7.6.3. Cabot Creamery Sales, Revenue, and Gross Margin
      4. 7.6.4. Cabot Creamery Revenue and Growth Rate
      5. 7.6.5. Cabot Creamery Market Share
      6. 7.6.6. Recent Initiatives, Funding/VC Activities, and Technological Innovations
    7. 7.7. Borden Dairy Company
      1. 7.7.1. Company Overview
      2. 7.7.2. Product/Service Portfolio
      3. 7.7.3. Borden Dairy Company Sales, Revenue, and Gross Margin
      4. 7.7.4. Borden Dairy Company Revenue and Growth Rate
      5. 7.7.5. Borden Dairy Company Market Share
      6. 7.7.6. Recent Initiatives, Funding/VC Activities, and Technological Innovations
    8. 7.8. Gay Lea Foods Co-operative Ltd.
      1. 7.8.1. Company Overview
      2. 7.8.2. Product/Service Portfolio
      3. 7.8.3. Gay Lea Foods Co-operative Ltd. Sales, Revenue, and Gross Margin
      4. 7.8.4. Gay Lea Foods Co-operative Ltd. Revenue and Growth Rate
      5. 7.8.5. Gay Lea Foods Co-operative Ltd. Market Share
      6. 7.8.6. Recent Initiatives, Funding/VC Activities, and Technological Innovations
    9. 7.9. Narsaria’s
      1. 7.9.1. Company Overview
      2. 7.9.2. Product/Service Portfolio
      3. 7.9.3. Narsaria’s Sales, Revenue, and Gross Margin
      4. 7.9.4. Narsaria’s Revenue and Growth Rate
      5. 7.9.5. Narsaria’s Market Share
      6. 7.9.6. Recent Initiatives, Funding/VC Activities, and Technological Innovations
    10. 7.10. Hanan Products Co. Inc
      1. 7.10.1. Company Overview
      2. 7.10.2. Product/Service Portfolio
      3. 7.10.3. Hanan Products Co. Inc Sales, Revenue, and Gross Margin
      4. 7.10.4. Hanan Products Co. Inc Revenue and Growth Rate
      5. 7.10.5. Hanan Products Co. Inc Market Share
      6. 7.10.6. Recent Initiatives, Funding/VC Activities, and Technological Innovations
  8. Chapter 8 Whipping Topping — Industry Analysis
    1. 8.1. Introduction and Taxonomy
    2. 8.2. Whipping Topping Market – Key Trends
      1. 8.2.1. Market Drivers
      2. 8.2.2. Market Restraints
      3. 8.2.3. Market Opportunities
    3. 8.3. Value Chain Analysis
    4. 8.4. Key Mandates and Regulations
    5. 8.5. Technology Roadmap and Timeline
    6. 8.6. Whipping Topping Market – Attractiveness Analysis
      1. 8.6.1. By Product
      2. 8.6.2. By Distribution Channel
      3. 8.6.3. By Application
      4. 8.6.4. By Region
  9. Chapter 9 Industrial Chain, Sourcing Strategy, and Downstream Buyers
    1. 9.1. Whipping Topping Industrial Chain Analysis
    2. 9.2. Downstream Buyers
    3. 9.3. Distributors/Traders List
  10. Chapter 10 Marketing Strategy Analysis
    1. 10.1. Marketing Channel
    2. 10.2. Direct Marketing
    3. 10.3. Indirect Marketing
    4. 10.4. Marketing Channel Development Trends
    5. 10.5. Economic/Political Environmental Change
  11. Chapter 11 Report Conclusion & Key Insights
    1. 11.1. Key Insights from Primary Interviews & Surveys Respondents
    2. 11.2. Key Takeaways from Analysts, Consultants, and Industry Leaders
  12. Chapter 12 Research Approach & Methodology
    1. 12.1. Report Description
    2. 12.2. Research Scope
    3. 12.3. Research Methodology
      1. 12.3.1. Secondary Research
      2. 12.3.2. Primary Research
      3. 12.3.3. Statistical Models
        1. 12.3.3.1. Company Share Analysis Model
        2. 12.3.3.2. Revenue Based Modeling
      4. 12.3.4. Research Limitations

      List of Figures

      Fig.1	Product Picture of Whipping Topping
      Fig.2	Global Whipping Topping Market, 2016 – 2026 (USD Billion)
      Fig.3	Global Whipping Topping Market Absolute Revenue Opportunity, 2016 – 2026 (USD Billion)
      Fig.4	Global Whipping Topping Market Incremental Revenue Opportunity, 2020 – 2026 (USD Billion)
      Fig.5	Global Whipping Topping Market Share, by Product, 2019 & 2026 (USD Billion)
      Fig.6	Global Dairy Whipping Topping Market, 2016 – 2026 (USD Billion)
      Fig.7	Global Non-Dairy Whipping Topping Market, 2016 – 2026 (USD Billion)
      Fig.8	Global Whipping Topping Market Share, by Distribution Channel, 2019 & 2026 (USD Billion)
      Fig.9	Global Online Whipping Topping Market, 2016 – 2026 (USD Billion)
      Fig.10	Global Offline Whipping Topping Market, 2016 – 2026 (USD Billion)
      Fig.11	Global Whipping Topping Market Share, by Application, 2019 & 2026 (USD Billion)
      Fig.12	Global B2B Whipping Topping Market, 2016 – 2026 (USD Billion)
      Fig.13	Global B2C Whipping Topping Market, 2016 – 2026 (USD Billion)
      Fig.14	Global Whipping Topping Market Share, by Region, 2019 & 2026 (USD Billion)
      Fig.15	North America Whipping Topping Market, 2016 – 2026 (USD Billion)
      Fig.16	U.S. Whipping Topping Market, 2016 – 2026 (USD Billion)
      Fig.17	Canada Whipping Topping Market, 2016 – 2026 (USD Billion)
      Fig.18	Europe Whipping Topping Market, 2016 – 2026 (USD Billion)
      Fig.19	Germany Whipping Topping Market, 2016 – 2026 (USD Billion)
      Fig.20	France Whipping Topping Market, 2016 – 2026 (USD Billion)
      Fig.21	U.K. Whipping Topping Market, 2016 – 2026 (USD Billion)
      Fig.22	Italy Whipping Topping Market, 2016 – 2026 (USD Billion)
      Fig.23	Spain Whipping Topping Market, 2016 – 2026 (USD Billion)
      Fig.24	Rest of Europe Whipping Topping Market, 2016 – 2026 (USD Billion)
      Fig.25	Asia Pacific Whipping Topping Market, 2016 – 2026 (USD Billion)
      Fig.26	China Whipping Topping Market, 2016 – 2026 (USD Billion)
      Fig.27	Japan Whipping Topping Market, 2016 – 2026 (USD Billion)
      Fig.28	India Whipping Topping Market, 2016 – 2026 (USD Billion)
      Fig.29	South  Korea Whipping Topping Market, 2016 – 2026 (USD Billion)
      Fig.30	South-East Asia Whipping Topping Market, 2016 – 2026 (USD Billion)
      Fig.31	Rest of Asia Pacific Whipping Topping Market, 2016 – 2026 (USD Billion)
      Fig.32	Latin America Whipping Topping Market, 2016 – 2026 (USD Billion)
      Fig.33	Brazil Whipping Topping Market, 2016 – 2026 (USD Billion)
      Fig.34	Mexico Whipping Topping Market, 2016 – 2026 (USD Billion)
      Fig.35	Rest of Latin America Whipping Topping Market, 2016 – 2026 (USD Billion)
      Fig.36	The Middle-East and Africa Whipping Topping Market, 2016 – 2026 (USD Billion)
      Fig.37	GCC Countries Whipping Topping Market, 2016 – 2026 (USD Billion)
      Fig.38	South Africa Whipping Topping Market, 2016 – 2026 (USD Billion)
      Fig.39	Rest of Middle-East Africa Whipping Topping Market, 2016 – 2026 (USD Billion)
      Fig.40	Competitor Market Share – Revenue
      Fig.41	Granarolo S.p.A Revenue and Growth Rate
      Fig.42	Granarolo S.p.A Market Share
      Fig.43	Rich Graviss Products Pvt. Ltd. Revenue and Growth Rate
      Fig.44	Rich Graviss Products Pvt. Ltd. Market Share
      Fig.45	Gruenewald Manufacturing Company Inc. Revenue and Growth Rate
      Fig.46	Gruenewald Manufacturing Company Inc. Market Share
      Fig.47	GCMMF-Amul Revenue and Growth Rate
      Fig.48	GCMMF-Amul Market Share
      Fig.49	Conagra Brands-Reddi Wip Revenue and Growth Rate
      Fig.50	Conagra Brands-Reddi Wip Market Share
      Fig.51	Cabot Creamery Revenue and Growth Rate
      Fig.52	Cabot Creamery Market Share
      Fig.53	Borden Dairy Company Revenue and Growth Rate
      Fig.54	Borden Dairy Company Market Share
      Fig.55	Gay Lea Foods Co-operative Ltd. Revenue and Growth Rate
      Fig.56	Gay Lea Foods Co-operative Ltd. Market Share
      Fig.57	Narsaria’s Revenue and Growth Rate
      Fig.58	Narsaria’s Market Share
      Fig.59	Hanan Products Co. Inc Revenue and Growth Rate
      Fig.60	Hanan Products Co. Inc Market Share
      Fig.61	Market Dynamics
      Fig.62	Global Whipping Topping – Value Chain Analysis
      Fig.63	Key Mandates and Regulations
      Fig.64	Technology Roadmap and Timeline
      Fig.65	Market Attractiveness Analysis – By Product
      Fig.66	Market Attractiveness Analysis – By Distribution Channel
      Fig.67	Market Attractiveness Analysis – By Application
      Fig.68	Market Attractiveness Analysis – By Region
      Fig.69	Whipping Topping Industrial Chain Analysis
      Fig.70	Market Channels
      Fig.71	Marketing Channel Development Trend
      Fig.72	Growth in World Gross Product, 2008-2018
      

      List of Tables

      Table 1	Global Whipping Topping Market, 2019 & 2026 (USD Billion)
      Table 2	Global Whipping Topping Market, by Product, 2016 – 2026 (USD Billion)
      Table 3	Global Whipping Topping Market, by Distribution Channel, 2016 – 2026 (USD Billion)
      Table 4	Global Whipping Topping Market, by Application, 2016 – 2026 (USD Billion)
      Table 5	Global Whipping Topping Market, by Region, 2016 – 2026 (USD Billion)
      Table 6	North America Whipping Topping Market, by Country, 2016 – 2026 (USD Billion)
      Table 7	North America Whipping Topping Market, by Product, 2016 – 2026 (USD Billion)
      Table 8	North America Whipping Topping Market, by Distribution Channel, 2016 – 2026 (USD Billion)
      Table 9 North America Whipping Topping Market, by Application, 2016 – 2026 (USD Billion)
      Table 10 Europe Whipping Topping Market, by Country, 2016 – 2026 (USD Billion)
      Table 11 Europe Whipping Topping Market, by Product, 2016 – 2026 (USD Billion)
      Table 12 Europe Whipping Topping Market, by Distribution Channel, 2016 – 2026 (USD Billion)
      Table 13 Europe Whipping Topping Market, by Application, 2016 – 2026 (USD Billion)
      Table 14 Asia Pacific Whipping Topping Market, by Country, 2016 – 2026 (USD Billion)
      Table 15 Asia Pacific Whipping Topping Market, by Product, 2016 – 2026 (USD Billion)
      Table 16 Asia Pacific Whipping Topping Market, by Distribution Channel, 2016 – 2026 (USD Billion)
      Table 17 Asia Pacific Whipping Topping Market, by Application, 2016 – 2026 (USD Billion)
      Table 18 Latin America Whipping Topping Market, by Country, 2016 – 2026 (USD Billion)
      Table 19 Latin America Whipping Topping Market, by Product, 2016 – 2026 (USD Billion)
      Table 20 Latin America Whipping Topping Market, by Distribution Channel, 2016 – 2026 (USD Billion)
      Table 21 Latin America Whipping Topping Market, by Application, 2016 – 2026 (USD Billion)
      Table 22 The Middle-East and Africa Whipping Topping Market, by Country, 2016 – 2026 (USD Billion)
      Table 23 The Middle-East and Africa Whipping Topping Market, by Product, 2016 – 2026 (USD Billion)
      Table 24 The Middle-East and Africa Whipping Topping Market, by Distribution Channel, 2016 – 2026 (USD Billion)
      Table 25 The Middle-East and Africa Whipping Topping Market, by Application, 2016 – 2026 (USD Billion)
      Table 26 Global Whipping Topping Market - Company Revenue Analysis, 2016 – 2019 (USD Billion)
      Table 27 Global Whipping Topping Market - Company Revenue Share Analysis, 2016 – 2019 (%)
      Table 28 Acquisitions and Mergers
      Table 29 Market Drivers – Impact Analysis
      Table 30 Market Restraints
      Table 31 Market Opportunities
      Table 32 Major Buyers of Whipping Topping
      Table 33 Distributors/Traders of Whipping Topping by Region
      

Industry Major Market Players

  • Granarolo S.p.A
  • Rich Graviss Products Pvt. Ltd.
  • Gruenewald Manufacturing Company Inc.
  • GCMMF-Amul
  • Conagra Brands-Reddi Wip
  • Cabot Creamery
  • Borden Dairy Company
  • Gay Lea Foods Co-operative Ltd.
  • Narsaria’s
  • Hanan Products Co. Inc.