CHAPTER 1. Executive Summary 24
CHAPTER 2. Western Europe Business Management Consulting Services market – Consulting Services Analysis 27
2.1. Western Europe Business Management Consulting Services Market – Consulting Services Overview 27
2.2. Western Europe Business Management Consulting Services Market Share, by Consulting Services, 2018 & 2025 (USD Million) 27
2.3. Strategy Consulting 29
2.3.1. Strategy Consulting Western Europe Business Management Consulting Services Market, 2015-2027 (USD Million) 29
2.4. Technology Consulting 30
2.4.1. Technology Consulting Western Europe Business Management Consulting Services Market, 2015-2027 (USD Million) 30
2.5. Operations Consulting 31
2.5.1. Operations Consulting Western Europe Business Management Consulting Services Market, 2015-2027 (USD Million) 31
2.6. Finance & Accounting Consulting 32
2.6.1. Finance & Accounting Consulting Western Europe Business Management Consulting Services Market, 2015-2027 (USD Million) 32
2.7. HR Consulting 33
2.7.1. HR Consulting Western Europe Business Management Consulting Services Market, 2015-2027 (USD Million) 33
CHAPTER 3. Western Europe Business Management Consulting Services market – Organization Capital Analysis 33
3.1. Western Europe Business Management Consulting Services Market – Organization Capital Overview 33
3.2. Western Europe Business Management Consulting Services Market Share, by Organization Capital, 2018 & 2025 (USD Million) 34
3.3. Lesser than 300 Million 35
3.3.1. Lesser than 300 Million Western Europe Business Management Consulting Services Market, 2015-2027 (USD Million) 35
3.4. Between 300 and 2,000 Million 36
3.4.1. Between 300 and 2,000 Million Western Europe Business Management Consulting Services Market, 2015-2027 (USD Million) 36
3.5. Between 2,000 Million and 5,000 Million 37
3.5.1. Between 2,000 Million and 5,000 Million Western Europe Business Management Consulting Services Market, 2015-2027 (USD Million) 37
3.6. More than 5,000 Million 38
3.6.1. More than 5,000 Million Western Europe Business Management Consulting Services Market, 2015-2027 (USD Million) 38
CHAPTER 4. Western Europe Business Management Consulting Services market – Verticals Analysis 38
4.1. Western Europe Business Management Consulting Services Market – Verticals Overview 38
4.2. Western Europe Business Management Consulting Services Market Share, by Verticals, 2018 & 2025 (USD Million) 39
4.3. BFSI 41
4.3.1. BFSI Western Europe Business Management Consulting Services Market, 2015-2027 (USD Million) 41
4.4. Aviation 42
4.4.1. Aviation Western Europe Business Management Consulting Services Market, 2015-2027 (USD Million) 42
4.5. IT & Telecom 43
4.5.1. IT & Telecom Western Europe Business Management Consulting Services Market, 2015-2027 (USD Million) 43
4.6. Healthcare 44
4.6.1. Healthcare Western Europe Business Management Consulting Services Market, 2015-2027 (USD Million) 44
4.7. Retail & FMCG 45
4.7.1. Retail & FMCG Western Europe Business Management Consulting Services Market, 2015-2027 (USD Million) 45
4.8. Entertainment & Media 46
4.8.1. Entertainment & Media Western Europe Business Management Consulting Services Market, 2015-2027 (USD Million) 46
4.9. Transportation & Logistics 47
4.9.1. Transportation & Logistics Western Europe Business Management Consulting Services Market, 2015-2027 (USD Million) 47
CHAPTER 5. Western Europe Business Management Consulting Services market – Regional Analysis 48
5.1. Western Europe Business Management Consulting Services Market Regional Overview 48
5.2. Western Europe Business Management Consulting Services Market Share, by Region, 2018 & 2025 (Value) 48
5.3. Western Europe 50
5.3.1. Western Europe Business Management Consulting Services Market size and forecast, 2015-2027 50
5.3.2. Western Europe Business Management Consulting Services Market, by Country, 2018 & 2025 (USD Million) 50
5.3.3. Western Europe Business Management Consulting Services Market, by Consulting Services, 2015-2027 52
5.3.3.1. Western Europe Business Management Consulting Services Market, by Consulting Services, 2015-2027 (USD Million) 52
5.3.4. Western Europe Business Management Consulting Services Market, by Organization Capital, 2015-2027 53
5.3.4.1. Western Europe Business Management Consulting Services Market, by Organization Capital, 2015-2027 (USD Million) 53
5.3.5. Western Europe Business Management Consulting Services Market, by Verticals, 2015-2027 54
5.3.5.1. Western Europe Business Management Consulting Services Market, by Verticals, 2015-2027 (USD Million) 54
5.3.6. Austria 55
5.3.6.1. Austria Market size and forecast, 2015-2027 (USD Million) 55
5.3.7. France 56
5.3.7.1. France Market size and forecast, 2015-2027 (USD Million) 56
5.3.8. Germany 57
5.3.8.1. Germany Market size and forecast, 2015-2027 (USD Million) 57
5.3.9. Ireland 58
5.3.9.1. Ireland Market size and forecast, 2015-2027 (USD Million) 58
5.3.10. Switzerland 59
5.3.10.1. Switzerland Market size and forecast, 2015-2027 (USD Million) 59
5.3.11. UK 60
5.3.11.1. UK Market size and forecast, 2015-2027 (USD Million) 60
5.3.12. Spain 61
5.3.12.1. Spain Market size and forecast, 2015-2027 (USD Million) 61
5.3.13. Italy 62
5.3.13.1. Italy Market size and forecast, 2015-2027 (USD Million) 62
5.3.14. Nordics 63
5.3.14.1. Nordics Market size and forecast, 2015-2027 (USD Million) 63
5.3.15. Benelux Union 64
5.3.15.1. Benelux Union Market size and forecast, 2015-2027 (USD Million) 64
5.3.16. Rest of Western Europe 65
5.3.16.1. Rest of Western Europe Market size and forecast, 2015-2027 (USD Million) 65
CHAPTER 6. Western Europe Business Management Consulting Services market – Competitive Landscape 66
6.1. Competitor Market Share – Revenue 66
6.2. Market Concentration Rate Analysis, Top 3 and Top 5 Players 69
6.3. Strategic Development 70
6.3.1. Acquisitions and Mergers 70
6.3.2. New Products 70
6.3.3. Research & Development Activities 70
CHAPTER 7. Company Profiles 71
7.1. Accenture 71
7.1.1. Company Overview 71
7.1.2. Accenture Revenue and Gross Margin 71
7.1.3. Product portfolio 72
7.1.4. Recent initiatives 73
7.2. KPMG 73
7.2.1. Company Overview 73
7.2.2. KPMG Revenue and Gross Margin 73
7.2.3. Product portfolio 74
7.2.4. Recent initiatives 75
7.3. QVARTZ 75
7.3.1. Company Overview 75
7.3.2. QVARTZ Revenue and Gross Margin 75
7.3.3. Product portfolio 76
7.3.4. Recent initiatives 77
7.4. Altair Management Consultants 77
7.4.1. Company Overview 77
7.4.2. Altair Management Consultants Revenue and Gross Margin 77
7.4.3. Product portfolio 78
7.4.4. Recent initiatives 79
7.5. Avanti 79
7.5.1. Company Overview 79
7.5.2. Avanti Revenue and Gross Margin 79
7.5.3. Product portfolio 80
7.5.4. Recent initiatives 81
7.6. BAIN & COMPANY 81
7.6.1. Company Overview 81
7.6.2. BAIN & COMPANY Revenue and Gross Margin 81
7.6.3. Product portfolio 82
7.6.4. Recent initiatives 83
7.7. SPConsulting AB 83
7.7.1. Company Overview 83
7.7.2. SPConsulting AB Revenue and Gross Margin 83
7.7.3. Product portfolio 84
7.7.4. Recent initiatives 85
7.8. PwC 85
7.8.1. Company Overview 85
7.8.2. PwC Revenue and Gross Margin 85
7.8.3. Product portfolio 86
7.8.4. Recent initiatives 87
7.9. McKinsey & Company 87
7.9.1. Company Overview 87
7.9.2. McKinsey & Company Revenue and Gross Margin 87
7.9.3. Product portfolio 88
7.9.4. Recent initiatives 89
7.10. Aliby Consulting Group AB 89
7.10.1. Company Overview 89
7.10.2. Aliby Consulting Group AB Revenue and Gross Margin 89
7.10.3. Product portfolio 90
7.10.4. Recent initiatives 91
7.11. Influence 91
7.11.1. Company Overview 91
7.11.2. Influence Revenue and Gross Margin 91
7.11.3. Product portfolio 92
7.11.4. Recent initiatives 93
7.12. Mott MacDonald 93
7.12.1. Company Overview 93
7.12.2. Mott MacDonald Revenue and Gross Margin 93
7.12.3. Product portfolio 94
7.12.4. Recent initiatives 95
7.13. Poyry Plc 95
7.13.1. Company Overview 95
7.13.2. Poyry Plc Revenue and Gross Margin 95
7.13.3. Product portfolio 96
7.13.4. Recent initiatives 97
7.14. Booz Allen Hamilton 97
7.14.1. Company Overview 97
7.14.2. Booz Allen Hamilton Revenue and Gross Margin 97
7.14.3. Product portfolio 98
7.14.4. Recent initiatives 99
7.15. Boston Consulting Group 99
7.15.1. Company Overview 99
7.15.2. Boston Consulting Group Revenue and Gross Margin 99
7.15.3. Product portfolio 100
7.15.4. Recent initiatives 101
7.16. Capacent AB 101
7.16.1. Company Overview 101
7.16.2. Capacent AB Revenue and Gross Margin 101
7.16.3. Product portfolio 102
7.16.4. Recent initiatives 103
7.17. Cognizant 103
7.17.1. Company Overview 103
7.17.2. Cognizant Revenue and Gross Margin 103
7.17.3. Product portfolio 104
7.17.4. Recent initiatives 105
7.18. EFESO Consulting 105
7.18.1. Company Overview 105
7.18.2. EFESO Consulting Revenue and Gross Margin 105
7.18.3. Product portfolio 106
7.18.4. Recent initiatives 107
7.19. Capgemini 107
7.19.1. Company Overview 107
7.19.2. Capgemini Revenue and Gross Margin 107
7.19.3. Product portfolio 108
7.19.4. Recent initiatives 109
7.20. Deloitte 109
7.20.1. Company Overview 109
7.20.2. Deloitte Revenue and Gross Margin 109
7.20.3. Product portfolio 110
7.20.4. Recent initiatives 111
7.21. Intermind Consulting 111
7.21.1. Company Overview 111
7.21.2. Intermind Consulting Revenue and Gross Margin 111
7.21.3. Product portfolio 112
7.21.4. Recent initiatives 113
7.22. Ramboll Group 113
7.22.1. Company Overview 113
7.22.2. Ramboll Group Revenue and Gross Margin 113
7.22.3. Product portfolio 114
7.22.4. Recent initiatives 115
7.23. Navigant Consulting Inc. 115
7.23.1. Company Overview 115
7.23.2. Navigant Consulting Inc. Revenue and Gross Margin 115
7.23.3. Product portfolio 116
7.23.4. Recent initiatives 117
7.24. Siemens 117
7.24.1. Company Overview 117
7.24.2. Siemens Revenue and Gross Margin 117
7.24.3. Product portfolio 118
7.24.4. Recent initiatives 119
7.25. Ernst & Young Limited 119
7.25.1. Company Overview 119
7.25.2. Ernst & Young Limited Revenue and Gross Margin 119
7.25.3. Product portfolio 120
7.25.4. Recent initiatives 121
7.26. Everis Group 121
7.26.1. Company Overview 121
7.26.2. Everis Group Revenue and Gross Margin 121
7.26.3. Product portfolio 122
7.26.4. Recent initiatives 123
7.27. Barkawi Management Consultants 123
7.27.1. Company Overview 123
7.27.2. Barkawi Management Consultants Revenue and Gross Margin 123
7.27.3. Product portfolio 124
7.27.4. Recent initiatives 125
7.28. Tata Consultancy Services Limited 125
7.28.1. Company Overview 125
7.28.2. Tata Consultancy Services Limited Revenue and Gross Margin 125
7.28.3. Product portfolio 126
7.28.4. Recent initiatives 127
7.29. IBM Corporation 127
7.29.1. Company Overview 127
7.29.2. IBM Corporation Revenue and Gross Margin 127
7.29.3. Product portfolio 128
7.29.4. Recent initiatives 129
7.30. Implement Consulting Group 129
7.30.1. Company Overview 129
7.30.2. Implement Consulting Group Revenue and Gross Margin 129
7.30.3. Product portfolio 130
7.30.4. Recent initiatives 131
CHAPTER 8. Western Europe Business Management Consulting Services — Industry Analysis 132
8.1. Western Europe Business Management Consulting Services Market – Key Trends 132
8.1.1. Market Drivers 133
8.1.2. Market Restraints 133
8.1.3. Market Opportunities 134
8.2. Value Chain Analysis 135
8.3. Technology Roadmap and Timeline 136
8.4. Western Europe Business Management Consulting Services Market – Attractiveness Analysis 137
8.4.1. By Consulting Services 137
8.4.2. By Organization Capital 137
8.4.3. By Verticals 138
8.4.4. By Region 140
CHAPTER 9. Marketing Strategy Analysis, Distributors 141
9.1. Marketing Channel 141
9.2. Direct Marketing 142
9.3. Indirect Marketing 142
9.4. Marketing Channel Development Trend 142
9.5. Economic/Political Environmental Change 143
CHAPTER 10. Report Conclusion 144
CHAPTER 11. Research Approach & Methodology 145
11.1. Report Description 145
11.2. Research Scope 146
11.3. Research Methodology 146
11.3.1. Secondary Research 147
11.3.2. Primary Research 148
11.3.3. Models 149
11.3.3.1. Company Share Analysis Model 149
11.3.3.2. Revenue Based Modeling 150
11.3.3.3. Research Limitations 150
List of Figures
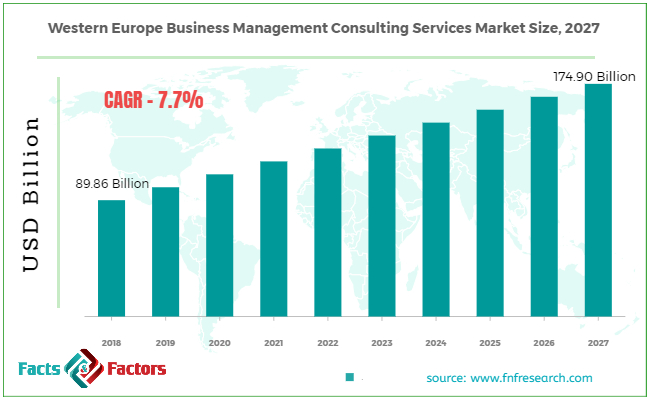
FIG. 1 Western Europe Business Management Consulting Services Market, 2015-2027 (USD Million) 26
FIG. 2 Western Europe Business Management Consulting Services Market Share, by Consulting Services, 2018 & 2025 (USD Million) 27
FIG. 3 Strategy Consulting Western Europe Business Management Consulting Services Market, 2015-2027 (USD Million) 29
FIG. 4 Technology Consulting Western Europe Business Management Consulting Services Market, 2015-2027 (USD Million) 30
FIG. 5 Operations Consulting Western Europe Business Management Consulting Services Market, 2015-2027 (USD Million) 31
FIG. 6 Finance & Accounting Consulting Western Europe Business Management Consulting Services Market, 2015-2027 (USD Million) 32
FIG. 7 HR Consulting Western Europe Business Management Consulting Services Market, 2015-2027 (USD Million) 33
FIG. 8 Western Europe Business Management Consulting Services Market Share, by Organization Capital, 2018 & 2025 (USD Million) 34
FIG. 9 Lesser than 300 Million Western Europe Business Management Consulting Services Market, 2015-2027 (USD Million) 35
FIG. 10 Between 300 and 2,000 Million Western Europe Business Management Consulting Services Market, 2015-2027 (USD Million) 36
FIG. 11 Between 2,000 Million and 5,000 Million Western Europe Business Management Consulting Services Market, 2015-2027 (USD Million) 37
FIG. 12 More than 5,000 Million Western Europe Business Management Consulting Services Market, 2015-2027 (USD Million) 38
FIG. 13 Western Europe Business Management Consulting Services Market Share, by Verticals, 2018 & 2025 (USD Million) 39
FIG. 14 BFSI Western Europe Business Management Consulting Services Market, 2015-2027 (USD Million) 41
FIG. 15 Aviation Western Europe Business Management Consulting Services Market, 2015-2027 (USD Million) 42
FIG. 16 IT & Telecom Western Europe Business Management Consulting Services Market, 2015-2027 (USD Million) 43
FIG. 17 Healthcare Western Europe Business Management Consulting Services Market, 2015-2027 (USD Million) 44
FIG. 18 Retail & FMCG Western Europe Business Management Consulting Services Market, 2015-2027 (USD Million) 45
FIG. 19 Entertainment & Media Western Europe Business Management Consulting Services Market, 2015-2027 (USD Million) 46
FIG. 20 Transportation & Logistics Western Europe Business Management Consulting Services Market, 2015-2027 (USD Million) 47
FIG. 21 Western Europe Business Management Consulting Services Market Share, by Region, 2018 & 2025 48
FIG. 22 Western Europe Business Management Consulting Services Market, 2015-2027 50
FIG. 23 Austria Western Europe Business Management Consulting Services Market, 2015-2027 55
FIG. 24 France Western Europe Business Management Consulting Services Market, 2015-2027 56
FIG. 25 Germany Western Europe Business Management Consulting Services Market, 2015-2027 57
FIG. 26 Ireland Western Europe Business Management Consulting Services Market, 2015-2027 58
FIG. 27 Switzerland Western Europe Business Management Consulting Services Market, 2015-2027 59
FIG. 28 UK Western Europe Business Management Consulting Services Market, 2015-2027 60
FIG. 29 Spain Western Europe Business Management Consulting Services Market, 2015-2027 61
FIG. 30 Italy Western Europe Business Management Consulting Services Market, 2015-2027 62
FIG. 31 Nordics Western Europe Business Management Consulting Services Market, 2015-2027 63
FIG. 32 Benelux Union Western Europe Business Management Consulting Services Market, 2015-2027 64
FIG. 33 Rest of Western Europe Business Management Consulting Services Market, 2015-2027 65
FIG. 34 Competitor Market Share – Revenue 66
FIG. 35 Accenture Revenue and Growth Rate 72
FIG. 36 Accenture Market Share 72
FIG. 37 KPMG Revenue and Growth Rate 74
FIG. 38 KPMG Market Share 74
FIG. 39 QVARTZ Revenue and Growth Rate 76
FIG. 40 QVARTZ Market Share 76
FIG. 41 Altair Management Consultants Revenue and Growth Rate 78
FIG. 42 Altair Management Consultants Market Share 78
FIG. 43 Avanti Revenue and Growth Rate 80
FIG. 44 Avanti Market Share 80
FIG. 45 BAIN & COMPANY Revenue and Growth Rate 82
FIG. 46 BAIN & COMPANY Market Share 82
FIG. 47 SPConsulting AB Revenue and Growth Rate 84
FIG. 48 SPConsulting AB Market Share 84
FIG. 49 PwC Revenue and Growth Rate 86
FIG. 50 PwC Market Share 86
FIG. 51 McKinsey & Company Revenue and Growth Rate 88
FIG. 52 McKinsey & Company Market Share 88
FIG. 53 Aliby Consulting Group AB Revenue and Growth Rate 90
FIG. 54 Aliby Consulting Group AB Market Share 90
FIG. 55 Influence Revenue and Growth Rate 92
FIG. 56 Influence Market Share 92
FIG. 57 Mott MacDonald Revenue and Growth Rate 94
FIG. 58 Mott MacDonald Market Share 94
FIG. 59 Poyry Plc Revenue and Growth Rate 96
FIG. 60 Poyry Plc Market Share 96
FIG. 61 Booz Allen Hamilton Revenue and Growth Rate 98
FIG. 62 Booz Allen Hamilton Market Share 98
FIG. 63 Boston Consulting Group Revenue and Growth Rate 100
FIG. 64 Boston Consulting Group Market Share 100
FIG. 65 Capacent AB Revenue and Growth Rate 102
FIG. 66 Capacent AB Market Share 102
FIG. 67 Cognizant Revenue and Growth Rate 104
FIG. 68 Cognizant Market Share 104
FIG. 69 EFESO Consulting Revenue and Growth Rate 106
FIG. 70 EFESO Consulting Market Share 106
FIG. 71 Capgemini Revenue and Growth Rate 108
FIG. 72 Capgemini Market Share 108
FIG. 73 Deloitte Revenue and Growth Rate 110
FIG. 74 Deloitte Market Share 110
FIG. 75 Intermind Consulting Revenue and Growth Rate 112
FIG. 76 Intermind Consulting Market Share 112
FIG. 77 Ramboll Group Revenue and Growth Rate 114
FIG. 78 Ramboll Group Market Share 114
FIG. 79 Navigant Consulting Inc. Revenue and Growth Rate 116
FIG. 80 Navigant Consulting Inc. Market Share 116
FIG. 81 Siemens Revenue and Growth Rate 118
FIG. 82 Siemens Market Share 118
FIG. 83 Ernst & Young Limited Revenue and Growth Rate 120
FIG. 84 Ernst & Young Limited Market Share 120
FIG. 85 Everis Group Revenue and Growth Rate 122
FIG. 86 Everis Group Market Share 122
FIG. 87 Barkawi Management Consultants Revenue and Growth Rate 124
FIG. 88 Barkawi Management Consultants Market Share 124
FIG. 89 Tata Consultancy Services Limited Revenue and Growth Rate 126
FIG. 90 Tata Consultancy Services Limited Market Share 126
FIG. 91 IBM Corporation Revenue and Growth Rate 128
FIG. 92 IBM Corporation Market Share 128
FIG. 93 Implement Consulting Group Revenue and Growth Rate 130
FIG. 94 Implement Consulting Group Market Share 130
FIG. 95 Market Dynamics 132
FIG. 96 Western Europe Business Management Consulting Services – Value Chain Analysis 135
FIG. 97 Technology Roadmap and Timeline 136
FIG. 98 Market Attractiveness Analysis – By Consulting Services 137
FIG. 99 Market Attractiveness Analysis – By Organization Capital 138
FIG. 100 Market Attractiveness Analysis – By Verticals 138
FIG. 101 Market Attractiveness Analysis – By Region 140
FIG. 102 Market Channel 141
FIG. 103 Marketing Channel Development Trend 142
FIG. 104 Growth in World Gross Product, 2008-2018 143
List of Tables
TABLE 1 Western Europe Business Management Consulting Services Market, 2018 & 2025 (USD Million) 25
TABLE 2 Western Europe Business Management Consulting Services market, by Consulting Services, 2015-2027 (USD Million) 27
TABLE 3 Western Europe Business Management Consulting Services market, by Organization Capital, 2015-2027 (USD Million) 34
TABLE 4 Western Europe Business Management Consulting Services market, by Verticals, 2015-2027 (USD Million) 39
TABLE 5 Western Europe Business Management Consulting Services market, by Region, 2015-2027 (USD Million) 48
TABLE 6 Western Europe Business Management Consulting Services Market, by Consulting Services, 2015-2027 (USD Million) 52
TABLE 7 Western Europe Business Management Consulting Services Market, by Organization Capital, 2015-2027 (USD Million) 53
TABLE 8 Western Europe Business Management Consulting Services Market, by Verticals, 2015-2027 (USD Million) 54
TABLE 9 Western Europe Business Management Consulting Services Market - Company Revenue Analysis 2015-2018 (USD Million) 66
TABLE 10 Western Europe Business Management Consulting Services Market - Company Revenue Share Analysis 2015-2018(%) 68
TABLE 11 Acquisitions and Mergers 70
TABLE 12 New Product/Service Launch 70
TABLE 13 Research & Development Activities 70
TABLE 14 Market Drivers 133
TABLE 15 Market Restraints 133
TABLE 16 Market Opportunities 134

 Report Scope

