Search Market Research Report

Discover Our Latest Reports
Discover Our Featured Reports
Discover Top Selling Reports

Waterproofing Chemicals Market Size, Share Global Analysis Report, 2020–2026

report img

Waterproofing Chemicals Market By Type (Bitumen, Ploymers, and Others) and By Application (Tunnel Liners, Roofing & Walls, Floors & Basements, Waste & Water Management, and Others): Global Industry Outlook, Market Size, Business Intelligence, Consumer Preferences, Statistical Surveys, Comprehensive Analysis, Historical Developments, Current Trends, and Forecast 2020–2026

Industry Insights

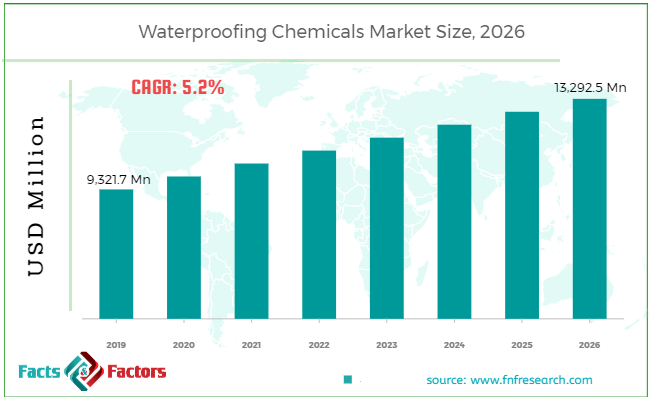
[180+ Pages Report] According to the report published by Facts Factors, the global waterproofing chemicals market size was worth around 9,321.7 million in 2019 and is predicted to grow to around USD 13,292.5 million by 2026 with a compound annual growth rate (CAGR) of roughly 5.2% between 2020 and 2026. The report analyzes the global waterproofing chemicals market drivers, restraints/challenges, and the effect they have on the demands during the projection period. In addition, the report explores emerging opportunities in the waterproofing chemicals market.

Waterproofing Chemicals Market

To know more about this report | Request Free Sample Copy

This specialized and expertise-oriented industry research report scrutinizes the technical and commercial business outlook of the waterproofing chemicals industry. The report analyzes and declares the historical and current trends analysis of the waterproofing chemicals industry and subsequently recommends the projected trends anticipated to be observed in the waterproofing chemicals market during the upcoming years.

The waterproofing chemicals market report analyzes and notifies the industry statistics at the global as well as regional and country levels in order to acquire a thorough perspective of the entire waterproofing chemicals market. The historical and past insights are provided for FY 2016 to FY 2019 whereas projected trends are delivered for FY 2020 to FY 2026. The quantitative and numerical data is represented in terms of value (USD Million) and volume (Kilotons) from FY 2016 – 2026


logoKey Insights from Primary Research

  • According to the primary CXOs of the global waterproofing chemicals market, the market is estimated to witness a substantial growth of nearly 5.2% over the forecast period.
  • The market was valued at USD 9,321.7 million, in 2019 and is expected to be valued at over USD 13,292.5 million, by 2026
  • On the basis of the product segment, bitumen dominated the global waterproofing chemicals market in 2019. In terms of revenue, it accounted for more than a 55% share of the total market in 2019.
  • Application-wise, the roofing & walls segment was the largest of the global waterproofing chemicals market in 2019. It accounted for more than 35% of the total market share in 2019.
  • By geography, the Asia Pacific region headed the market with a share of above 30%, in 2019.

logoKey Recommendations from Analysts

  • According to industry experts, growing water and wastewater management is expected to boom the demand for waterproofing chemicals during the forecast period.
  • Our analysts recommend that the Asia Pacific region is predicted to witness significant growth attributed to the growing demand for waterproofing chemicals from China and India.
  • According to our analyst, the escalating construction sector owing to the rapid growth in industrialization along with the economic boost is expected to boost the demand for bitumen-based chemical waterproofing during the years to come.
  • One of the latest developments seen in the waterproofing chemicals industry is rising compliance with the international manufacturing norm.
  • The regulatory authorities intend to formulate guidelines to curb the increase in emission rates, and in the process strive to develop a model that promotes energy-and green buildings. These programs are expected to increase demand for chemicals that are waterproof.

.The quantitative data is further underlined and reinforced by comprehensive qualitative data which comprises various across-the-board market dynamics. The rationales which directly or indirectly impact the waterproofing chemicals industry are exemplified through parameters such as growth drivers, restraints, challenges, and opportunities among other impacting factors.

Throughout our research report, we have encompassed all the proven models and tools of industry analysis and extensively illustrated all the key business strategies and business models adopted in the waterproofing chemicals industry. The report provides an all-inclusive and detailed competitive landscape prevalent in the waterproofing chemicals market.

The report utilizes established industry analysis tools and models such as Porter’s Five Forces framework to analyze and recognize critical business strategies adopted by various stakeholders involved in the entire value chain of the waterproofing chemicals industry. The waterproofing chemicals market report additionally employs SWOT analysis and PESTLE analysis models for further in-depth analysis.

The report study further includes an in-depth analysis of industry players' market shares and provides an overview of leading players' market position in the waterproofing chemicals sector. Key strategic developments in the waterproofing chemicals market competitive landscape such as acquisitions & mergers, inaugurations of different products and services, partnerships & joint ventures, MoU agreements, VC & funding activities, R&D activities, and geographic expansion among other noteworthy activities by key players of the waterproofing chemicals market are appropriately highlighted in the report.

The waterproofing chemicals market research report delivers an acute valuation and taxonomy of the waterproofing chemicals industry by practically splitting the market on the basis of different types, applications, and regions. Through the analysis of the historical and projected trends, all the segments and sub-segments were evaluated through the bottom-up approach, and different market sizes have been projected for FY 2020 to FY 2026.

logoReport Scope

Report Attribute

Details

Market Size in 2019

USD 9,321.7 Million

Projected Market Size in 2026

USD 13,292.5 Billion

CAGR Growth Rate

5.2% CAGR

Base Year

2019

Forecast Years

2020-2026

Key Market Players

Thermax Limited, ExxonMobil Chemicals, The Dow Chemical Company, Eastman Chemical Company, Bostik Inc., Mitsubishi Chemical Holdings Corporation, Polygel Industries, Toray Industries, Estop Group, Sika AG , and Others

Key Segment

By Type, Application, and Region

Major Regions Covered

North America, Europe, Asia Pacific, Latin America, and the Middle East & Africa

Purchase Options

Request customized purchase options to meet your research needs.Explore purchase options

The regional segmentation of the waterproofing chemicals industry includes the complete classification of all the major continents including North America, Latin America, Europe, Asia Pacific, and Middle East & Africa. Further, country-wise data for the waterproofing chemicals industry is provided for the leading economies of the world.

Waterproofing chemicals are commonly used to shield buildings from water leakage. The water leakage may result in hazards to the electrical, metal, and safety of the building. Waterproofing chemicals improve the longevity of buildings when applied to a building's surface, as well as help to increase the shelf life of concrete construction. The waterproofing chemicals market is expected to experience rapid growth due to the increase in the global infrastructure and construction industry, favorable environmental regulation, and rapid growth in the end industries.

The waterproofing chemicals market is segmented based on type, application, and region. On the basis of type segmentation, the market is classified into bitumen, polymers, and others. Based on application, the market is segregated into tunnel liners, roofing & walls, floors & basements, waste & water management, and others.

logoSome of the leading players in the global market include

  • Thermax Limited
  • ExxonMobil Chemicals
  • The Dow Chemical Company
  • Eastman Chemical Company
  • Bostik Inc.
  • Mitsubishi Chemical Holdings Corporation
  • Polygel Industries
  • Toray Industries
  • Estop Group
  • Sika AG 

The taxonomy of the waterproofing chemicals industry by its scope and segmentation is as follows:

logo By Type Segmentation Analysis

  • Bitumen
  • Ploymers
  • Others

logo By Application Segmentation Analysis

  • Tunnel Liners
  • Roofing & Walls
  • Floors & Basements
  • Waste & Water Management
  • Others

logo By Regional Segmentation Analysis

  • North America
    • The U.S.
    • Canada
  • Europe
    • Germany
    • The UK
    • France
    • Spain
    • Italy
    • Rest of Europe
  • Asia Pacific
    • China
    • Japan
    • India
    • South Korea
    • Southeast Asia
    • Rest of Asia Pacific
  • Latin America
    • Brazil
    • Mexico
    • Rest of Latin America
  • Middle East & Africa
    • GCC
    • South Africa
    • Rest of Middle East & Africa

Table of Content

  1. CHAPTER 1. Executive Summary
  2. CHAPTER 2. Waterproofing Chemicals market – Type Analysis
    1. 2.1. Global Waterproofing Chemicals Market–TypeOverview
    2. 2.2. Global Waterproofing ChemicalsMarketShare, by Type, 2019 & 2026 (USD Million)
    3. 2.3. Global Waterproofing Chemicals Market share, by Type, 2019 & 2026 (Kilotons)
    4. 2.4. Bitumen
      1. 2.4.1. Global BitumenWaterproofing ChemicalsMarket,2016-2026 (USD Million)
      2. 2.4.2. Global BitumenWaterproofing Chemicals Market, 2016-2026 (Kilotons)
    5. 2.5. Ploymers
      1. 2.5.1. Global PloymersWaterproofing ChemicalsMarket,2016-2026 (USD Million)
      2. 2.5.2. Global PloymersWaterproofing Chemicals Market, 2016-2026 (Kilotons)
    6. 2.6. Others
      1. 2.6.1. Global OthersWaterproofing ChemicalsMarket,2016-2026 (USD Million)
      2. 2.6.2. Global OthersWaterproofing Chemicals Market, 2016-2026 (Kilotons)
  3. CHAPTER 3. Waterproofing Chemicals market – Application Analysis
    1. 3.1. Global Waterproofing Chemicals Market–ApplicationOverview
    2. 3.2. Global Waterproofing ChemicalsMarketShare, by Application, 2019 & 2026 (USD Million)
    3. 3.3. Global Waterproofing Chemicals Market share, by Application, 2019 & 2026 (Kilotons)
    4. 3.4. Tunnel Liners
      1. 3.4.1. Global Tunnel LinersWaterproofing ChemicalsMarket,2016-2026 (USD Million)
      2. 3.4.2. Global Tunnel LinersWaterproofing Chemicals Market, 2016-2026 (Kilotons)
    5. 3.5. Roofing & Walls
      1. 3.5.1. Global Roofing & WallsWaterproofing ChemicalsMarket,2016-2026 (USD Million)
      2. 3.5.2. Global Roofing & WallsWaterproofing Chemicals Market, 2016-2026 (Kilotons)
    6. 3.6. Floors & Basements
      1. 3.6.1. Global Floors & BasementsWaterproofing ChemicalsMarket,2016-2026 (USD Million)
      2. 3.6.2. Global Floors & BasementsWaterproofing Chemicals Market, 2016-2026 (Kilotons)
    7. 3.7. Waste & Water Management
      1. 3.7.1. Global Waste & Water ManagementWaterproofing ChemicalsMarket,2016-2026 (USD Million)
      2. 3.7.2. Global Waste & Water ManagementWaterproofing Chemicals Market, 2016-2026 (Kilotons)
    8. 3.8. Others
      1. 3.8.1. Global OthersWaterproofing ChemicalsMarket,2016-2026 (USD Million)
      2. 3.8.2. Global OthersWaterproofing Chemicals Market, 2016-2026 (Kilotons)
  4. CHAPTER 4. Waterproofing Chemicals market – Regional Analysis
    1. 4.1. Global Waterproofing Chemicals MarketRegionalOverview
    2. 4.2. Global Waterproofing ChemicalsMarketShare, by Region, 2019 & 2026 (Value)
    3. 4.3. Global Waterproofing Chemicals Market Share, by Region, 2019 & 2026 (Volume)
    4. 4.4. North America
      1. 4.4.1. North AmericaWaterproofing Chemicals Market size and forecast, 2016-2026
      2. 4.4.2. North AmericaWaterproofing Chemicals Market, by Country, 2019 - 2026 (USD Million)
      3. 4.4.3. North America Market size and forecast, 2016-2026 (Kilotons)
      4. 4.4.4. North AmericaWaterproofing Chemicals Market, by Country, 2019 - 2026 (Kilotons)
      5. 4.4.5. North AmericaWaterproofing Chemicals Market, by Type, 2016-2026
        1. 4.4.5.1. North AmericaWaterproofing Chemicals Market, by Type, 2016-2026 (USD Million)
        2. 4.4.5.2. North AmericaWaterproofing Chemicals Market, by Type, 2016-2026 (Kilotons)
      6. 4.4.6. North AmericaWaterproofing Chemicals Market, by Application, 2016-2026
        1. 4.4.6.1. North AmericaWaterproofing Chemicals Market, by Application, 2016-2026 (USD Million)
        2. 4.4.6.2. North AmericaWaterproofing Chemicals Market, by Application, 2016-2026 (Kilotons)
      7. 4.4.7. U.S.
        1. 4.4.7.1. U.S. Market size and forecast, 2016-2026 (USD Million)
        2. 4.4.7.2. U.S. Market size and forecast, 2016-2026 (Kilotons)
      8. 4.4.8. Canada
        1. 4.4.8.1. Canada Market size and forecast, 2016-2026 (USD Million)
        2. 4.4.8.2. Canada Market size and forecast, 2016-2026 (Kilotons)
    5. 4.5. Europe
      1. 4.5.1. EuropeWaterproofing Chemicals Market size and forecast, 2016-2026
      2. 4.5.2. EuropeWaterproofing Chemicals Market, by Country, 2019 - 2026 (USD Million)
      3. 4.5.3. Europe Market size and forecast, 2016-2026 (Kilotons)
      4. 4.5.4. EuropeWaterproofing Chemicals Market, by Country, 2019 - 2026 (Kilotons)
      5. 4.5.5. EuropeWaterproofing Chemicals Market, by Type, 2016-2026
        1. 4.5.5.1. EuropeWaterproofing Chemicals Market, by Type, 2016-2026 (USD Million)
        2. 4.5.5.2. EuropeWaterproofing Chemicals Market, by Type, 2016-2026 (Kilotons)
      6. 4.5.6. EuropeWaterproofing Chemicals Market, by Application, 2016-2026
        1. 4.5.6.1. EuropeWaterproofing Chemicals Market, by Application, 2016-2026 (USD Million)
        2. 4.5.6.2. EuropeWaterproofing Chemicals Market, by Application, 2016-2026 (Kilotons)
      7. 4.5.7. Germany
        1. 4.5.7.1. Germany Market size and forecast, 2016-2026 (USD Million)
        2. 4.5.7.2. Germany Market size and forecast, 2016-2026 (Kilotons)
      8. 4.5.8. France
        1. 4.5.8.1. France Market size and forecast, 2016-2026 (USD Million)
        2. 4.5.8.2. France Market size and forecast, 2016-2026 (Kilotons)
      9. 4.5.9. U.K.
        1. 4.5.9.1. U.K. Market size and forecast, 2016-2026 (USD Million)
        2. 4.5.9.2. U.K. Market size and forecast, 2016-2026 (Kilotons)
      10. 4.5.10. Italy
        1. 4.5.10.1. Italy Market size and forecast, 2016-2026 (USD Million)
        2. 4.5.10.2. Italy Market size and forecast, 2016-2026 (Kilotons)
      11. 4.5.11. Spain
        1. 4.5.11.1. Spain Market size and forecast, 2016-2026 (USD Million)
        2. 4.5.11.2. Spain Market size and forecast, 2016-2026 (Kilotons)
      12. 4.5.12. Rest of Europe
        1. 4.5.12.1. Rest of Europe Market size and forecast, 2016-2026 (USD Million)
        2. 4.5.12.2. Rest of Europe Market size and forecast, 2016-2026 (Kilotons)
    6. 4.6. Asia Pacific
      1. 4.6.1. Asia PacificWaterproofing Chemicals Market size and forecast, 2016-2026
      2. 4.6.2. Asia PacificWaterproofing Chemicals Market, by Country, 2019 - 2026 (USD Million)
      3. 4.6.3. Asia Pacific Market size and forecast, 2016-2026 (Kilotons)
      4. 4.6.4. Asia PacificWaterproofing Chemicals Market, by Country, 2019 - 2026 (Kilotons)
      5. 4.6.5. Asia PacificWaterproofing Chemicals Market, by Type, 2016-2026
        1. 4.6.5.1. Asia PacificWaterproofing Chemicals Market, by Type, 2016-2026 (USD Million)
        2. 4.6.5.2. Asia PacificWaterproofing Chemicals Market, by Type, 2016-2026 (Kilotons)
      6. 4.6.6. Asia PacificWaterproofing Chemicals Market, by Application, 2016-2026
        1. 4.6.6.1. Asia PacificWaterproofing Chemicals Market, by Application, 2016-2026 (USD Million)
        2. 4.6.6.2. Asia PacificWaterproofing Chemicals Market, by Application, 2016-2026 (Kilotons)
      7. 4.6.7. China
        1. 4.6.7.1. China Market size and forecast, 2016-2026 (USD Million)
        2. 4.6.7.2. China Market size and forecast, 2016-2026 (Kilotons)
      8. 4.6.8. Japan
        1. 4.6.8.1. Japan Market size and forecast, 2016-2026 (USD Million)
        2. 4.6.8.2. Japan Market size and forecast, 2016-2026 (Kilotons)
      9. 4.6.9. India
        1. 4.6.9.1. India Market size and forecast, 2016-2026 (USD Million)
        2. 4.6.9.2. India Market size and forecast, 2016-2026 (Kilotons)
      10. 4.6.10. South Korea
        1. 4.6.10.1. South Korea Market size and forecast, 2016-2026 (USD Million)
        2. 4.6.10.2. South Korea Market size and forecast, 2016-2026 (Kilotons)
      11. 4.6.11. South-East Asia
        1. 4.6.11.1. South-East Asia Market size and forecast, 2016-2026 (USD Million)
        2. 4.6.11.2. South-East Asia Market size and forecast, 2016-2026 (Kilotons)
      12. 4.6.12. Rest of Asia Pacific
        1. 4.6.12.1. Rest of Asia Pacific Market size and forecast, 2016-2026 (USD Million)
        2. 4.6.12.2. Rest of Asia Pacific Market size and forecast, 2016-2026 (Kilotons)
    7. 4.7. Latin America
      1. 4.7.1. Latin AmericaWaterproofing Chemicals Market size and forecast, 2016-2026
      2. 4.7.2. Latin AmericaWaterproofing Chemicals Market, by Country, 2019 - 2026 (USD Million)
      3. 4.7.3. Latin America Market size and forecast, 2016-2026 (Kilotons)
      4. 4.7.4. Latin AmericaWaterproofing Chemicals Market, by Country, 2019 - 2026 (Kilotons)
      5. 4.7.5. Latin AmericaWaterproofing Chemicals Market, by Type, 2016-2026
        1. 4.7.5.1. Latin AmericaWaterproofing Chemicals Market, by Type, 2016-2026 (USD Million)
        2. 4.7.5.2. Latin AmericaWaterproofing Chemicals Market, by Type, 2016-2026 (Kilotons)
      6. 4.7.6. Latin AmericaWaterproofing Chemicals Market, by Application, 2016-2026
        1. 4.7.6.1. Latin AmericaWaterproofing Chemicals Market, by Application, 2016-2026 (USD Million)
        2. 4.7.6.2. Latin AmericaWaterproofing Chemicals Market, by Application, 2016-2026 (Kilotons)
      7. 4.7.7. Brazil
        1. 4.7.7.1. Brazil Market size and forecast, 2016-2026 (USD Million)
        2. 4.7.7.2. Brazil Market size and forecast, 2016-2026 (Kilotons)
      8. 4.7.8. Mexico
        1. 4.7.8.1. Mexico Market size and forecast, 2016-2026 (USD Million)
        2. 4.7.8.2. Mexico Market size and forecast, 2016-2026 (Kilotons)
      9. 4.7.9. Rest of Latin America
        1. 4.7.9.1. Rest of Latin America Market size and forecast, 2016-2026 (USD Million)
        2. 4.7.9.2. Rest of Latin America Market size and forecast, 2016-2026 (Kilotons)
    8. 4.8. The Middle-East and Africa
      1. 4.8.1. The Middle-East and AfricaWaterproofing Chemicals Market size and forecast, 2016-2026
      2. 4.8.2. The Middle-East and AfricaWaterproofing Chemicals Market, by Country, 2019 - 2026 (USD Million)
      3. 4.8.3. The Middle-East and Africa Market size and forecast, 2016-2026 (Kilotons)
      4. 4.8.4. The Middle-East and AfricaWaterproofing Chemicals Market, by Country, 2019 - 2026 (Kilotons)
      5. 4.8.5. The Middle-East and AfricaWaterproofing Chemicals Market, by Type, 2016-2026
        1. 4.8.5.1. The Middle-East and AfricaWaterproofing Chemicals Market, by Type, 2016-2026 (USD Million)
        2. 4.8.5.2. The Middle-East and AfricaWaterproofing Chemicals Market, by Type, 2016-2026 (Kilotons)
      6. 4.8.6. The Middle-East and AfricaWaterproofing Chemicals Market, by Application, 2016-2026
        1. 4.8.6.1. The Middle-East and AfricaWaterproofing Chemicals Market, by Application, 2016-2026 (USD Million)
        2. 4.8.6.2. The Middle-East and AfricaWaterproofing Chemicals Market, by Application, 2016-2026 (Kilotons)
      7. 4.8.7. GCC Countries
        1. 4.8.7.1. GCC Countries Market size and forecast, 2016-2026 (USD Million)
        2. 4.8.7.2. GCC Countries Market size and forecast, 2016-2026 (Kilotons)
      8. 4.8.8. South Africa
        1. 4.8.8.1. South Africa Market size and forecast, 2016-2026 (USD Million)
        2. 4.8.8.2. South Africa Market size and forecast, 2016-2026 (Kilotons)
      9. 4.8.9. Rest of Middle-East Africa
        1. 4.8.9.1. Rest of Middle-East Africa Market size and forecast, 2016-2026 (USD Million)
        2. 4.8.9.2. Rest of Middle-East Africa Market size and forecast, 2016-2026 (Kilotons)
  5. CHAPTER 5. Waterproofing ChemicalsProduction, Consumption, Export, Import by Regions
    1. 5.1. Global Waterproofing Chemicals production and revenue, 2016-2026 (USD Million) (Kilotons)
    2. 5.2. Global Import and Export Analysis, by Region
  6. CHAPTER 6. Waterproofing Chemicals market – Competitive Landscape
    1. 6.1. Competitor Market Share – Revenue
    2. 6.2. Market Concentration Rate Analysis, Top 3 and Top 5 Players
    3. 6.3. Competitor Market Share – Volume
    4. 6.4. Strategic Development
      1. 6.4.1. Acquisitions and Mergers
      2. 6.4.2. New Products
      3. 6.4.3. Research & Development Activities
  7. CHAPTER 7. Company Profiles
    1. 7.1. Thermax Limited
      1. 7.1.1. Company Overview
      2. 7.1.2. Thermax Limited Sales, Revenue, Price, and Gross Margin
      3. 7.1.3. Product portfolio
      4. 7.1.4. Recent initiatives
    2. 7.2. ExxonMobil Chemicals
      1. 7.2.1. Company Overview
      2. 7.2.2. ExxonMobil Chemicals Sales, Revenue, Price, and Gross Margin
      3. 7.2.3. Product portfolio
      4. 7.2.4. Recent initiatives
    3. 7.3. The Dow Chemical Company
      1. 7.3.1. Company Overview
      2. 7.3.2. The Dow Chemical Company Sales, Revenue, Price, and Gross Margin
      3. 7.3.3. Product portfolio
      4. 7.3.4. Recent initiatives
    4. 7.4. Eastman Chemical Company
      1. 7.4.1. Company Overview
      2. 7.4.2. Eastman Chemical Company Sales, Revenue, Price, and Gross Margin
      3. 7.4.3. Product portfolio
      4. 7.4.4. Recent initiatives
    5. 7.5. Bostik Inc.
      1. 7.5.1. Company Overview
      2. 7.5.2. Bostik Inc. Sales, Revenue, Price, and Gross Margin
      3. 7.5.3. Product portfolio
      4. 7.5.4. Recent initiatives
    6. 7.6. Mitsubishi Chemical Holdings Corporation
      1. 7.6.1. Company Overview
      2. 7.6.2. Mitsubishi Chemical Holdings Corporation Sales, Revenue, Price, and Gross Margin
      3. 7.6.3. Product portfolio
      4. 7.6.4. Recent initiatives
    7. 7.7. Polygel Industries
      1. 7.7.1. Company Overview
      2. 7.7.2. Polygel Industries Sales, Revenue, Price, and Gross Margin
      3. 7.7.3. Product portfolio
      4. 7.7.4. Recent initiatives
    8. 7.8. Toray Industries
      1. 7.8.1. Company Overview
      2. 7.8.2. Toray Industries Sales, Revenue, Price, and Gross Margin
      3. 7.8.3. Product portfolio
      4. 7.8.4. Recent initiatives
    9. 7.9. Estop Group
      1. 7.9.1. Company Overview
      2. 7.9.2. Estop Group Sales, Revenue, Price, and Gross Margin
      3. 7.9.3. Product portfolio
      4. 7.9.4. Recent initiatives
    10. 7.10. Sika AG
      1. 7.10.1. Company Overview
      2. 7.10.2. Sika AG Sales, Revenue, Price, and Gross Margin
      3. 7.10.3. Product portfolio
      4. 7.10.4. Recent initiatives
  8. CHAPTER 8. Waterproofing Chemicals — Industry Analysis
    1. 8.1. Introduction and Taxonomy
    2. 8.2. Waterproofing Chemicals Market – Key Trends
      1. 8.2.1. Market Drivers
      2. 8.2.2. Market Restraints
      3. 8.2.3. Market Opportunities
    3. 8.3. Value Chain Analysis
    4. 8.4. Key Mandates and Regulations
    5. 8.5. Technology Roadmap and Timeline
    6. 8.6. Waterproofing Chemicals market – Attractiveness Analysis
      1. 8.6.1. By Type
      2. 8.6.2. By Application
      3. 8.6.3. By Region
  9. CHAPTER 9. Raw Material analysis
    1. 9.1. Waterproofing Chemicals Key Raw Material Analysis
      1. 9.1.1. Key Raw Materials
      2. 9.1.2. Price Trend of Key Raw Materials
    2. 9.2. Key Suppliers of Raw Materials
    3. 9.3. Proportion of Manufacturing Cost Structure
      1. 9.3.1. Raw Materials
      2. 9.3.2. Labor Cost
    4. 9.4. Manufacturing Expenses Analysis of Waterproofing Chemicals
  10. CHAPTER 10. Industrial Chain, Sourcing Strategy and Downstream Buyers
    1. 10.1. Waterproofing Chemicals Industrial Chain Analysis
    2. 10.2. Upstream Raw Materials Sourcing
      1. 10.2.1. Risk Mitigation:
      2. 10.2.2. Supplier Relationships:
      3. 10.2.3. Business Processes:
      4. 10.2.4. Securing the Product:
    3. 10.3. Raw Materials Sources of Waterproofing Chemicals Major Manufacturers in 2016
    4. 10.4. Downstream Buyers
    5. 10.5. Distributors/Traders List
  11. CHAPTER 11. Marketing Strategy Analysis, Distributors
    1. 11.1. Marketing Channel
    2. 11.2. Direct Marketing
    3. 11.3. Indirect Marketing
    4. 11.4. Marketing Channel Development Trend
    5. 11.5. Economic/Political Environmental Change
  12. CHAPTER 12. Report Conclusion
  13. CHAPTER 13. Research Approach & Methodology
    1. 13.1. Report Description
    2. 13.2. Research Scope
    3. 13.3. Research Methodology
      1. 13.3.1. Secondary Research
      2. 13.3.2. Primary Research
      3. 13.3.3. Models
        1. 13.3.3.1. Company Share Analysis Model
        2. 13.3.3.2. Revenue Based Modeling
        3. 13.3.3.3. Research Limitations

        List of Figures

        FIG. 1 Global Waterproofing Chemicals Market, 2016-2026(USD Million)
        FIG. 2 Global Waterproofing Chemicals MarketShare, by Type, 2019 & 2026 (USD Million)
        FIG. 3 Global Waterproofing Chemicals Market share, by Type, 2019 & 2026 (Kilotons)
        FIG. 4 Global BitumenWaterproofing ChemicalsMarket,2016-2026 (USD Million)
        FIG. 5 Global BitumenWaterproofing Chemicals  Market, 2016-2026 (Kilotons)
        FIG. 6 Global PloymersWaterproofing ChemicalsMarket,2016-2026 (USD Million)
        FIG. 7 Global PloymersWaterproofing Chemicals  Market, 2016-2026 (Kilotons)
        FIG. 8 Global OthersWaterproofing ChemicalsMarket,2016-2026 (USD Million)
        FIG. 9 Global OthersWaterproofing Chemicals  Market, 2016-2026 (Kilotons)
        FIG. 10 Global Waterproofing Chemicals MarketShare, by Application, 2019 & 2026 (USD Million)
        FIG. 11 Global Waterproofing Chemicals Market share, by Application, 2019 & 2026 (Kilotons)
        FIG. 12 Global Tunnel LinersWaterproofing ChemicalsMarket,2016-2026 (USD Million)
        FIG. 13 Global Tunnel LinersWaterproofing Chemicals  Market, 2016-2026 (Kilotons)
        FIG. 14 Global Roofing & WallsWaterproofing ChemicalsMarket,2016-2026 (USD Million)
        FIG. 15 Global Roofing & WallsWaterproofing Chemicals  Market, 2016-2026 (Kilotons)
        FIG. 16 Global Floors & BasementsWaterproofing ChemicalsMarket,2016-2026 (USD Million)
        FIG. 17 Global Floors & BasementsWaterproofing Chemicals  Market, 2016-2026 (Kilotons)
        FIG. 18 Global Waste & Water ManagementWaterproofing ChemicalsMarket,2016-2026 (USD Million)
        FIG. 19 Global Waste & Water ManagementWaterproofing Chemicals  Market, 2016-2026 (Kilotons)
        FIG. 20 Global OthersWaterproofing ChemicalsMarket,2016-2026 (USD Million)
        FIG. 21 Global OthersWaterproofing Chemicals  Market, 2016-2026 (Kilotons)
        FIG. 22 Global Waterproofing Chemicals MarketShare, by Region, 2019 & 2026
        FIG. 23 Global Waterproofing Chemicals MarketShare, by Region, 2019 & 2026
        FIG. 24 North AmericaWaterproofing Chemicals Market, 2016-2026
        FIG. 25 North AmericaWaterproofing Chemicals  Market, 2016-2026 (Kilotons)
        FIG. 26 U.S.Waterproofing Chemicals Market, 2016-2026
        FIG. 27 U.S.Waterproofing Chemicals  Market, 2016-2026 (Kilotons)
        FIG. 28 CanadaWaterproofing Chemicals Market, 2016-2026
        FIG. 29 CanadaWaterproofing Chemicals  Market, 2016-2026 (Kilotons)
        FIG. 30 EuropeWaterproofing Chemicals Market, 2016-2026
        FIG. 31 EuropeWaterproofing Chemicals  Market, 2016-2026 (Kilotons)
        FIG. 32 GermanyWaterproofing Chemicals Market, 2016-2026
        FIG. 33 GermanyWaterproofing Chemicals  Market, 2016-2026 (Kilotons)
        FIG. 34 FranceWaterproofing Chemicals Market, 2016-2026
        FIG. 35 FranceWaterproofing Chemicals  Market, 2016-2026 (Kilotons)
        FIG. 36 U.K.Waterproofing Chemicals Market, 2016-2026
        FIG. 37 U.K.Waterproofing Chemicals  Market, 2016-2026 (Kilotons)
        FIG. 38 ItalyWaterproofing Chemicals Market, 2016-2026
        FIG. 39 ItalyWaterproofing Chemicals  Market, 2016-2026 (Kilotons)
        FIG. 40 SpainWaterproofing Chemicals Market, 2016-2026
        FIG. 41 SpainWaterproofing Chemicals  Market, 2016-2026 (Kilotons)
        FIG. 42 Rest of EuropeWaterproofing Chemicals Market, 2016-2026
        FIG. 43 Rest of EuropeWaterproofing Chemicals  Market, 2016-2026 (Kilotons)
        FIG. 44 Asia PacificWaterproofing Chemicals Market, 2016-2026
        FIG. 45 Asia PacificWaterproofing Chemicals  Market, 2016-2026 (Kilotons)
        FIG. 46 ChinaWaterproofing Chemicals Market, 2016-2026
        FIG. 47 ChinaWaterproofing Chemicals  Market, 2016-2026 (Kilotons)
        FIG. 48 JapanWaterproofing Chemicals Market, 2016-2026
        FIG. 49 JapanWaterproofing Chemicals  Market, 2016-2026 (Kilotons)
        FIG. 50 IndiaWaterproofing Chemicals Market, 2016-2026
        FIG. 51 IndiaWaterproofing Chemicals  Market, 2016-2026 (Kilotons)
        FIG. 52 South  KoreaWaterproofing Chemicals Market, 2016-2026
        FIG. 53 South  KoreaWaterproofing Chemicals  Market, 2016-2026 (Kilotons)
        FIG. 54 South-East AsiaWaterproofing Chemicals Market, 2016-2026
        FIG. 55 South-East AsiaWaterproofing Chemicals  Market, 2016-2026 (Kilotons)
        FIG. 56 Rest of Asia PacificWaterproofing Chemicals Market, 2016-2026
        FIG. 57 Rest of Asia PacificWaterproofing Chemicals  Market, 2016-2026 (Kilotons)
        FIG. 58 Latin AmericaWaterproofing Chemicals Market, 2016-2026
        FIG. 59 Latin AmericaWaterproofing Chemicals  Market, 2016-2026 (Kilotons)
        FIG. 60 BrazilWaterproofing Chemicals Market, 2016-2026
        FIG. 61 BrazilWaterproofing Chemicals  Market, 2016-2026 (Kilotons)
        FIG. 62 MexicoWaterproofing Chemicals Market, 2016-2026
        FIG. 63 MexicoWaterproofing Chemicals  Market, 2016-2026 (Kilotons)
        FIG. 64 Rest of Latin AmericaWaterproofing Chemicals Market, 2016-2026
        FIG. 65 Rest of Latin AmericaWaterproofing Chemicals  Market, 2016-2026 (Kilotons)
        FIG. 66 The Middle-East and AfricaWaterproofing Chemicals Market, 2016-2026
        FIG. 67 The Middle-East and AfricaWaterproofing Chemicals  Market, 2016-2026 (Kilotons)
        FIG. 68 GCC CountriesWaterproofing Chemicals Market, 2016-2026
        FIG. 69 GCC CountriesWaterproofing Chemicals  Market, 2016-2026 (Kilotons)
        FIG. 70 South AfricaWaterproofing Chemicals Market, 2016-2026
        FIG. 71 South AfricaWaterproofing Chemicals  Market, 2016-2026 (Kilotons)
        FIG. 72 Rest of Middle-East AfricaWaterproofing Chemicals Market, 2016-2026
        FIG. 73 Rest of Middle-East AfricaWaterproofing Chemicals  Market, 2016-2026 (Kilotons)
        FIG. 74 Global Waterproofing Chemicals production and revenue, 2016-2026 (USD Million) (Kilotons)
        FIG. 75 North AmericaWaterproofing Chemicals production and revenue, 2016-2026 (USD Million) (Kilotons)
        FIG. 76 EuropeWaterproofing Chemicals production and revenue, 2016-2026 (USD Million) (Kilotons)
        FIG. 77 Asia Pacific Waterproofing Chemicals production and revenue, 2016-2026 (USD Million) (Kilotons)
        FIG. 78 Latin America Waterproofing Chemicals production and revenue, 2016-2026 (USD Million) (Kilotons)
        FIG. 79 Middle East and Africa Waterproofing Chemicals production and revenue, 2016-2026 (USD Million) (Kilotons)
        FIG. 80 Competitor Market Share – Revenue
        FIG. 81 Competitor Market Share – Volume
        FIG. 82 Thermax Limited Revenue and Growth Rate
        FIG. 83 Thermax Limited Market Share
        FIG. 84 ExxonMobil Chemicals Revenue and Growth Rate
        FIG. 85 ExxonMobil Chemicals Market Share
        FIG. 86 The Dow Chemical Company Revenue and Growth Rate
        FIG. 87 The Dow Chemical Company Market Share
        FIG. 88 Eastman Chemical Company Revenue and Growth Rate
        FIG. 89 Eastman Chemical Company Market Share
        FIG. 90 Bostik Inc. Revenue and Growth Rate
        FIG. 91 Bostik Inc. Market Share
        FIG. 92 Mitsubishi Chemical Holdings Corporation Revenue and Growth Rate
        FIG. 93 Mitsubishi Chemical Holdings Corporation Market Share
        FIG. 94 Polygel Industries Revenue and Growth Rate
        FIG. 95 Polygel Industries Market Share
        FIG. 96 Toray Industries Revenue and Growth Rate
        FIG. 97 Toray Industries Market Share
        FIG. 98 Estop Group Revenue and Growth Rate
        FIG. 99 Estop Group Market Share
        FIG. 100 Sika AG Revenue and Growth Rate
        FIG. 101 Sika AG Market Share
        FIG. 102 Market Dynamics
        FIG. 103 Global Waterproofing Chemicals – Value Chain Analysis
        FIG. 104 Key Mandates and Regulations
        FIG. 105 Technology Roadmap and Timeline
        FIG. 106 Market Attractiveness Analysis – By Type
        FIG. 107 Market Attractiveness Analysis – By Application
        FIG. 108 Market Attractiveness Analysis – By Region
        FIG. 109 Manufacturing Cost Structure of Waterproofing Chemicals
        FIG. 110 Waterproofing Chemicals Industrial Chain Analysis
        FIG. 111 Market Channel
        FIG. 112 Marketing Channel Development Trend
        FIG. 113 Growth in World Gross Product, 2008-2019

        List of Tables

        TABLE 1 Global Waterproofing Chemicals market, 2019& 2026 (USD Million)
        TABLE 2 Global Waterproofing Chemicals market, by Type, 2016-2026 (USD Million)
        TABLE 3 Global Waterproofing Chemicals market, by Type, 2016-2026 (Kilotons)
        TABLE 4 Global Waterproofing Chemicals market, by Application, 2016-2026 (USD Million)
        TABLE 5 Global Waterproofing Chemicals market, by Application, 2016-2026 (Kilotons)
        TABLE 6 Global Waterproofing Chemicals market, by region, 2016-2026 (USD Million)
        TABLE 7 Global Waterproofing Chemicals market, by region, 2016-2026 (Kilotons)
        TABLE 8 North AmericaWaterproofing Chemicals Market, by Type, 2016-2026 (USD Million)
        TABLE 9 North AmericaWaterproofing Chemicals Market, by Type, 2016-2026 (Kilotons)
        TABLE 10 North AmericaWaterproofing Chemicals Market, by Application, 2016-2026 (USD Million)
        TABLE 11 North AmericaWaterproofing Chemicals Market, by Application, 2016-2026 (Kilotons)
        TABLE 12 EuropeWaterproofing Chemicals Market, by Type, 2016-2026 (USD Million)
        TABLE 13 EuropeWaterproofing Chemicals Market, by Type, 2016-2026 (Kilotons)
        TABLE 14 EuropeWaterproofing Chemicals Market, by Application, 2016-2026 (USD Million)
        TABLE 15 EuropeWaterproofing Chemicals Market, by Application, 2016-2026 (Kilotons)
        TABLE 16 Asia PacificWaterproofing Chemicals Market, by Type, 2016-2026 (USD Million)
        TABLE 17 Asia PacificWaterproofing Chemicals Market, by Type, 2016-2026 (Kilotons)
        TABLE 18 Asia PacificWaterproofing Chemicals Market, by Application, 2016-2026 (USD Million)
        TABLE 19 Asia PacificWaterproofing Chemicals Market, by Application, 2016-2026 (Kilotons)
        TABLE 20 Latin AmericaWaterproofing Chemicals Market, by Type, 2016-2026 (USD Million)
        TABLE 21 Latin AmericaWaterproofing Chemicals Market, by Type, 2016-2026 (Kilotons)
        TABLE 22 Latin AmericaWaterproofing Chemicals Market, by Application, 2016-2026 (USD Million)
        TABLE 23 Latin AmericaWaterproofing Chemicals Market, by Application, 2016-2026 (Kilotons)
        TABLE 24 The Middle-East and AfricaWaterproofing Chemicals Market, by Type, 2016-2026 (USD Million)
        TABLE 25 The Middle-East and AfricaWaterproofing Chemicals Market, by Type, 2016-2026 (Kilotons)
        TABLE 26 The Middle-East and AfricaWaterproofing Chemicals Market, by Application, 2016-2026 (USD Million)
        TABLE 27 The Middle-East and AfricaWaterproofing Chemicals Market, by Application, 2016-2026 (Kilotons)
        TABLE 28 North America Waterproofing ChemicalsProduction, Consumption, Export, Import, 2016-2019
        TABLE 29 Europe Waterproofing ChemicalsProduction, Consumption, Export, Import, 2016-2019
        TABLE 30 Asia Pacific Waterproofing ChemicalsProduction, Consumption, Export, Import, 2016-2019
        TABLE 31 Latin America Waterproofing ChemicalsProduction, Consumption, Export, Import, 2016-2019
        TABLE 32 Middle East & Africa Waterproofing ChemicalsProduction, Consumption, Export, Import, 2016-2019
        TABLE 33 Global Waterproofing Chemicals Market - Company Revenue Analysis 2016-2019 (USD Million)
        TABLE 34 Global Waterproofing Chemicals Market - Company Revenue Share Analysis 2016-2019(%)
        TABLE 35 Global Waterproofing Chemicals Market - Company Volume Analysis 2016-2019 (Kilotons)
        TABLE 36 Global Waterproofing Chemicals Market - Company Volume Share Analysis 2016-2019(%)
        TABLE 37 Acquisitions and Mergers
        TABLE 38 New Product/Service Launch
        TABLE 39 Research & Development Activities
        TABLE 40 Market Drivers
        TABLE 41 Market Restraints
        TABLE 42 Market Opportunities
        TABLE 43 Production Base and Market Concentration Rate of Raw Material
        TABLE 44 Key Suppliers of Raw Materials
        TABLE 45 Raw Materials Sources of Waterproofing Chemicals Major Manufacturers in 2016
        TABLE 46 Major Buyers of Waterproofing Chemicals
        TABLE 47 Distributors/Traders of Waterproofing Chemicals by Region
        

Industry Major Market Players

  • Thermax Limited
  • ExxonMobil Chemicals
  • The Dow Chemical Company
  • Eastman Chemical Company
  • Bostik Inc.
  • Mitsubishi Chemical Holdings Corporation
  • Polygel Industries
  • Toray Industries
  • Estop Group
  • Sika AG