![]()
Search Market Research Report
Visual Search in Devices Market Size, Share Global Analysis Report, 2018 – 2027

Visual Search in Devices Market By Type of Devices (Drones/Unmanned Aerial Vehicles, Mobile, and Smart Cameras) and By Application (Inventory Management, Weather Monitoring, and Surveillance & Security Control): Global Industry Perspective, Comprehensive Analysis, and Forecast 2018 – 2027
Industry Insights
The report covers the forecast and analysis of the Visual Search in Devices market on a global and regional level. The study provides historical data from 2015 to 2018 along with a forecast from 2019 to 2027 based on revenue (USD Million). The study includes drivers and restraints of the Visual Search in Devices market along with the impact they have on the demand over the forecast period. Additionally, the report includes the study of opportunities available in the Visual Search in Devices market on a global level.
In order to give the users of this report a comprehensive view of the Visual Search in Devices market, we have included a competitive landscape and an analysis of Porter’s Five Forces model for the market. The study encompasses a market attractiveness analysis, wherein all the segments are benchmarked based on their market size, growth rate, and general attractiveness.
The report provides company market share analysis to give a broader overview of the key players in the market. In addition, the report also covers key strategic developments of the market including acquisitions & mergers, new products & service launches, agreements, partnerships, collaborations & joint ventures, research & development, and regional expansion of major participants involved in the market on a global and regional basis.
 Report Scope
Report Attributes |
Details |
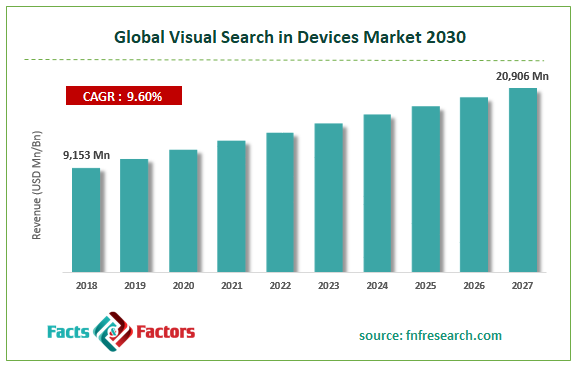
Market Size in 2018 |
USD 9,153 Million |
Projected Market Size in 2027 |
USD 20,906 Million |
CAGR Growth Rate |
9.6% CAGR |
Base Year |
2017 |
Forecast Years |
2018 – 2027 |
Key Market Players |
DJI, Face++, IntelliVision, Snap Inc., IBM Corporation, Slyce, Uncanny Vision, Google, ViSenze, Nest Labs, FLIRTEY, Samsung, Microsoft, and Skydio. |
Key Segment |
By Type of Devices, By Application, and By Region |
Major Regions Covered |
North America, Europe, Asia Pacific, Latin America, and the Middle East & Africa |
Purchase Options |
Request customized purchase options to meet your research needs. Explore purchase options |
The study provides a decisive view of the Visual Search in Devices market by segmenting the market based on type of devices, applications, and regions. All the segments have been analyzed based on present and future trends and the market is estimated from 2019 to 2027. The regional segmentation includes the current and forecast demand for North America, Europe, Asia Pacific, Latin America, and the Middle East and Africa.
The eCommerce sector has sparked new growth prospects for visual search in the devices market by making search optimization easier for end-users. Moreover, visual search like Pinterest – a social networking tool-introduced a visual discovery application that became popular among the end-users as well as the target audience. All these aforementioned factors are predicted to steer the growth of visual search in the devices industry over the forecast period.
On the basis of the type of devices, the market is divided into Drones/Unmanned Aerial Vehicles, Mobile, and Smart Cameras. Application-wise, the industry for visual search in devices is classified into Inventory Management, Weather Monitoring, and Surveillance & Security Control.
Some of the major players in the business include
- DJI
- Face++
- IntelliVision
- Snap Inc.
- IBM Corporation
- Slyce
- Uncanny Vision
- ViSenze
- Nest Labs
- FLIRTEY
- Samsung
- Microsoft
- Skydio.
Table of Content
Industry Major Market Players
- DJI
- Face++
- IntelliVision
- Snap Inc.
- IBM Corporation
- Slyce
- Uncanny Vision
- ViSenze
- Nest Labs
- FLIRTEY
- Samsung
- Microsoft
- and Skydio


Copyright © 2025 - 2026, All Rights Reserved, Facts and Factors