Search Market Research Report

Discover Our Latest Reports
Discover Our Featured Reports
Discover Top Selling Reports

Virtual Desktop Infrastructure Market Size, Share Global Analysis Report, , 2021 – 2028

report img

Virtual Desktop Infrastructure Market By Type (Non-persistent VDI and Persistent VDI), By Deployment (On-Premise and Cloud-based), By Component (Platform, Service and Hardware), and By Application (IT & Telecommunication, Media & Entertainment, Education, Healthcare, BFSI, Government, Retail, Manufacturing and Others): Global & Regional Industry Perspective, Comprehensive Analysis, and Forecast, 2021 – 2028

Industry Insights

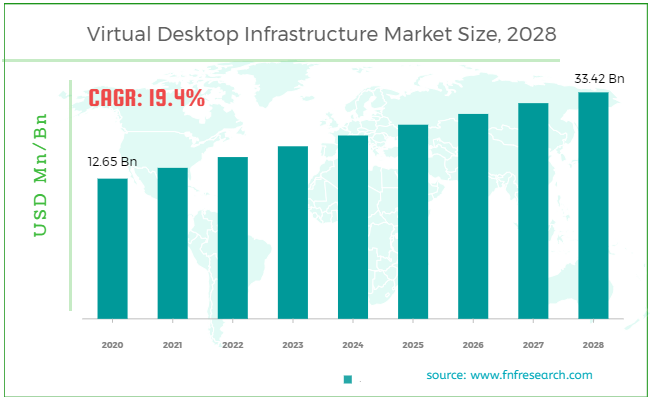
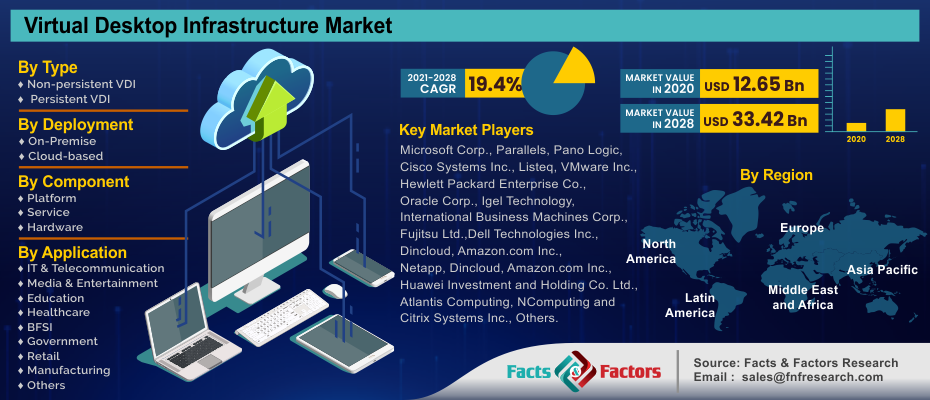
Facts & Factors published the latest report on the global virtual desktop infrastructure (VDI) market is expected to grow from USD 12.65 Billion in 2020 to USD 33.42 Billion by 2028; it is anticipated to grow at a CAGR of 19.4% during 2021 – 2028

Virtual Desktop Infrastructure Market Size

To know more about this report | Request Free Sample Copy

logoMarket Overview

Virtual desktop infrastructure is a desktop virtualization technology that allows a data center to run and maintain a desktop operating system. The virtual desktop picture is supplied to an endpoint device over the network, allowing the user to interact with the operating system and its apps as if they were running locally. A standard PC, thin client device, or mobile device can all be used as an endpoint.

Virtual Desktop Infrastructure Market

To know more about this report | Request Free Sample Copy

logoIndustry Growth Factor

Bring-your-own-device and corporate-owned personally-enabled devices are driving VDI adoption in the IT and telecom industries. In addition, the demand for VDI is increasing owing to the increase in the mobile workforce. Organizations are increasingly turning to virtual desktop infrastructure (VDI) to manage IT consumerization and cost control. Businesses are attempting to develop advanced virtualized desktop infrastructure. Consumerization of IT and BYOD, combined with mobility, are putting pressure on businesses to adopt advanced virtual technology. Desktop virtualization is gaining attraction owing to improved security, governance, and compliance.  Moving to a DaaS platform can benefit a company's security strategy in various ways, as security is one of the top objectives for enterprises.

Various DaaS vendors are now offering security software and services to ensure that businesses use newer, inherently safer devices as soon as possible. Furthermore, by switching to a DaaS service, user data is stored in the DaaS environment, where it is accessible from a wide range of client devices and from practically anywhere. Data is thus securely maintained using the DaaS environment when combined with encryption in transit and encryption at rest. Furthermore, as end-point vulnerabilities grow, enterprises are migrating to virtualized systems, which reduce the perimeter of exposure by storing data in a secure data center rather than on a hard drive on a traditional end-user device. Thus certain benefits provided by VDI are contributing to the market growth.

Despite the COVID 19 epidemic, the worldwide virtual desktop infrastructure (VDI) industry is growing steadily. The increased propensity of employees to work from home is a crucial aspect that is contributing to market growth in this pandemic circumstance. To stop the spread of the virus, the governments of most countries implemented harsh lockdowns and movement restrictions. Most firms have been obliged to establish remote working policies as a result, resulting in a surge in demand for desktop virtualization solutions around the world.

logoSegmentation Analysis

The global virtual desktop infrastructure market has been segmented into deployment, component, type, and application. On-premise and cloud-based are the deployment models of the global virtual desktop infrastructure market. Based on the component, the market has been categorized into platform, service, and hardware. In terms of type, the worldwide market is categorized into non-persistent VDI and persistent VDI. The application segment is bifurcated into IT & telecommunication, media & entertainment, education, healthcare, BFSI, government, retail, manufacturing, and others.

logoReport Scope

Report Attribute

Details

Market Size in 2020

USD 12.65 Billion

Projected Market Size in 2028

USD 33.42 Billion

CAGR Growth Rate

19.4% CAGR

Base Year

2020

Forecast Years

2021-2028

Key Market Players

Microsoft Corp., Parallels, Pano Logic, Cisco Systems Inc., Listeq, VMware Inc., Hewlett Packard Enterprise Co., Oracle Corp., Igel Technology, International Business Machines Corp., Dell Technologies Inc., Fujitsu Ltd., Netapp, Dincloud, Amazon.com Inc., Huawei Investment and Holding Co. Ltd., Atlantis Computing, NComputing and Citrix Systems Inc.

Key Segment

By Type, By Deployment, By Component, By Application, and By Region

Major Regions Covered

North America, Europe, Asia Pacific, Latin America, and the Middle East & Africa

Purchase Options

Request customized purchase options to meet your research needs. Explore purchase options

logo Regional Analysis

North America led the global virtual desktop infrastructure market in terms of revenue in 2020. Increased adoption of cloud technology in numerous industries such as IT, healthcare, education, and telecom industries in the United States is expected to offer the most lucrative revenue potential over the forecast period.

Furthermore, due to BYOD regulations and rising smartphone adoption in the United States, the industry is growing. Due to the rise of cloud computing and the rise of the mobile workforce, the market in the Asia Pacific is predicted to develop at the fastest rate throughout the forecast period. In this region, the concept of bringing your own device to work is gaining traction and cloud computing is becoming more popular.

logo Competitive Players

Some of the key players in the virtual desktop infrastructure market are

  • Microsoft Corp.
  • Parallels
  • Pano Logic
  • Cisco Systems Inc.
  • Listeq
  • VMware Inc.
  • Hewlett Packard Enterprise Co.
  • Oracle Corp.
  • Igel Technology
  • International Business Machines Corp.
  • Dell Technologies Inc.
  • Fujitsu Ltd.
  • Netapp
  • Dincloud
  • Amazon.com Inc.
  • Huawei Investment and Holding Co. Ltd.
  • Atlantis Computing
  • NComputing
  • Citrix Systems Inc.

logo By Type

  • Non-persistent VDI
  • Persistent VDI

logo By Deployment

  • On-Premise
  • Cloud-based

logo By Component

  • Platform
  • Service
  • Hardware

logo By Application

  • IT & Telecommunication
  • Media & Entertainment
  • Education
  • Healthcare
  • BFSI
  • Government
  • Retail
  • Manufacturing
  • Others

logo By Region

  • North America
    • The U.S.
    • Canada
  • Europe
    • France
    • The UK
    • Spain
    • Germany
    • Italy
    • Rest of Europe
  • Asia Pacific
    • China
    • Japan
    • India
    • South Korea
    • Southeast Asia
    • Rest of Asia Pacific
  • Latin America
    • Brazil
    • Mexico
    • Rest of Latin America
  • Middle East & Africa
    • GCC
    • South Africa
    • Rest of Middle East & Africa

Table of Content

  1. Chapter 1 Executive Summary
    1. 1.1. Introduction of Virtual Desktop Infrastructure
    2. 1.2. Global Virtual Desktop Infrastructure Market, 2021 & 2028 (USD Billion)
    3. 1.3. Global Virtual Desktop Infrastructure Market, 2017 – 2028 (USD Billion)
    4. 1.4. Global Virtual Desktop Infrastructure Market Absolute Revenue Opportunity, 2017 – 2028 (USD Billion)
    5. 1.5. Global Virtual Desktop Infrastructure Market Incremental Revenue Opportunity, 2021 – 2028 (USD Billion)
    6. 1.6. Impacts on Virtual Desktop Infrastructure Market
      1. 1.6.1. COVID-19 Impact on the Players
      2. 1.6.2. Business Strategies and Recommendations
  2. Chapter 2 Virtual Desktop Infrastructure Market – Application Analysis
    1. 2.1. Global Virtual Desktop Infrastructure Market – Application Overview
    2. 2.2. Global Virtual Desktop Infrastructure Market Share, by Application, 2021 & 2026 (USD Billion)
    3. 2.3. IT & Telecommunication
      1. 2.3.1. Global IT & Telecommunication Virtual Desktop Infrastructure Market, 2017 – 2028 (USD Billion)
    4. 2.4. Media & Entertainment
      1. 2.4.1. Global Media & Entertainment Virtual Desktop Infrastructure Market, 2017 – 2028 (USD Billion)
    5. 2.5. Education
      1. 2.5.1. Global Education Virtual Desktop Infrastructure Market, 2017 – 2028 (USD Billion)
    6. 2.6. Healthcare
      1. 2.6.1. Global Healthcare Virtual Desktop Infrastructure Market, 2017 – 2028 (USD Billion)
    7. 2.7. BFSI
      1. 2.7.1. Global BFSI Virtual Desktop Infrastructure Market, 2017 – 2028 (USD Billion)
    8. 2.8. Government
      1. 2.8.1. Global Government Virtual Desktop Infrastructure Market, 2017 – 2028 (USD Billion)
    9. 2.9. Retail
      1. 2.9.1. Global Retail Virtual Desktop Infrastructure Market, 2017 – 2028 (USD Billion)
    10. 2.10. Manufacturing
      1. 2.10.1. Global Manufacturing Virtual Desktop Infrastructure Market, 2017 – 2028 (USD Billion)
    11. 2.11. Others
      1. 2.11.1. Global Others Virtual Desktop Infrastructure Market, 2017 – 2028 (USD Billion)
  3. Chapter 3 Virtual Desktop Infrastructure Market – Deployment Analysis
    1. 3.1. Global Virtual Desktop Infrastructure Market – Deployment Overview
    2. 3.2. Global Virtual Desktop Infrastructure Market Share, by Deployment, 2021 & 2026 (USD Billion)
    3. 3.3. On-Premise
      1. 3.3.1. Global On-Premise Virtual Desktop Infrastructure Market, 2017 – 2028 (USD Billion)
    4. 3.4. Cloud-based
      1. 3.4.1. Global Cloud-based Virtual Desktop Infrastructure Market, 2017 – 2028 (USD Billion)
  4. Chapter 4 Virtual Desktop Infrastructure Market – Component Analysis
    1. 4.1. Global Virtual Desktop Infrastructure Market – Component Overview
    2. 4.2. Global Virtual Desktop Infrastructure Market Share, by Component, 2021 & 2026 (USD Billion)
    3. 4.3. Platform
      1. 4.3.1. Global Platform Virtual Desktop Infrastructure Market, 2017 – 2028 (USD Billion)
    4. 4.4. Service
      1. 4.4.1. Global Service Virtual Desktop Infrastructure Market, 2017 – 2028 (USD Billion)
    5. 4.5. Hardware
      1. 4.5.1. Global Hardware Virtual Desktop Infrastructure Market, 2017 – 2028 (USD Billion)
  5. Chapter 5 Virtual Desktop Infrastructure Market – Type Analysis
    1. 5.1. Global Virtual Desktop Infrastructure Market – Type Overview
    2. 5.2. Global Virtual Desktop Infrastructure Market Share, by Type, 2021 & 2026 (USD Billion)
    3. 5.3. Non-persistent VDI
      1. 5.3.1. Global Non-persistent VDI Virtual Desktop Infrastructure Market, 2017 – 2028 (USD Billion)
    4. 5.4. Persistent VDI
      1. 5.4.1. Global Persistent VDI Virtual Desktop Infrastructure Market, 2017 – 2028 (USD Billion)
  6. Chapter 6 Virtual Desktop Infrastructure Market – Regional Analysis
    1. 6.1. Global Virtual Desktop Infrastructure Market Regional Overview
    2. 6.2. Global Virtual Desktop Infrastructure Market Share, by Region, 2021 & 2026 (USD Billion)
    3. 6.3. North America
      1. 6.3.1. North America Virtual Desktop Infrastructure Market, 2017 – 2028 (USD Billion)
        1. 6.3.1.1. North America Virtual Desktop Infrastructure Market, by Country, 2017 - 2028 (USD Billion)
      2. 6.3.2. North America Virtual Desktop Infrastructure Market, by Application, 2017 – 2028
        1. 6.3.2.1. North America Virtual Desktop Infrastructure Market, by Application, 2017 – 2028 (USD Billion)
      3. 6.3.3. North America Virtual Desktop Infrastructure Market, by Deployment, 2017 – 2028
        1. 6.3.3.1. North America Virtual Desktop Infrastructure Market, by Deployment, 2017 – 2028 (USD Billion)
      4. 6.3.4. North America Virtual Desktop Infrastructure Market, by Component, 2017 – 2028
        1. 6.3.4.1. North America Virtual Desktop Infrastructure Market, by Component, 2017 – 2028 (USD Billion)
      5. 6.3.5. North America Virtual Desktop Infrastructure Market, by Type, 2017 – 2028
        1. 6.3.5.1. North America Virtual Desktop Infrastructure Market, by Type, 2017 – 2028 (USD Billion)
      6. 6.3.6. U.S.
        1. 6.3.6.1. U.S. Virtual Desktop Infrastructure Market, 2017 – 2028 (USD Billion)
      7. 6.3.7. Canada
        1. 6.3.7.1. Canada Virtual Desktop Infrastructure Market, 2017 – 2028 (USD Billion)
    4. 6.4. Europe
      1. 6.4.1. Europe Virtual Desktop Infrastructure Market, 2017 – 2028 (USD Billion)
        1. 6.4.1.1. Europe Virtual Desktop Infrastructure Market, by Country, 2017 - 2028 (USD Billion)
      2. 6.4.2. Europe Virtual Desktop Infrastructure Market, by Application, 2017 – 2028
        1. 6.4.2.1. Europe Virtual Desktop Infrastructure Market, by Application, 2017 – 2028 (USD Billion)
      3. 6.4.3. Europe Virtual Desktop Infrastructure Market, by Deployment, 2017 – 2028
        1. 6.4.3.1. Europe Virtual Desktop Infrastructure Market, by Deployment, 2017 – 2028 (USD Billion)
      4. 6.4.4. Europe Virtual Desktop Infrastructure Market, by Component, 2017 – 2028
        1. 6.4.4.1. Europe Virtual Desktop Infrastructure Market, by Component, 2017 – 2028 (USD Billion)
      5. 6.4.5. Europe Virtual Desktop Infrastructure Market, by Type, 2017 – 2028
        1. 6.4.5.1. Europe Virtual Desktop Infrastructure Market, by Type, 2017 – 2028 (USD Billion)
      6. 6.4.6. Germany
        1. 6.4.6.1. Germany Virtual Desktop Infrastructure Market, 2017 – 2028 (USD Billion)
      7. 6.4.7. France
        1. 6.4.7.1. France Virtual Desktop Infrastructure Market, 2017 – 2028 (USD Billion)
      8. 6.4.8. U.K.
        1. 6.4.8.1. U.K. Virtual Desktop Infrastructure Market, 2017 – 2028 (USD Billion)
      9. 6.4.9. Italy
        1. 6.4.9.1. Italy Virtual Desktop Infrastructure Market, 2017 – 2028 (USD Billion)
      10. 6.4.10. Spain
        1. 6.4.10.1. Spain Virtual Desktop Infrastructure Market, 2017 – 2028 (USD Billion)
      11. 6.4.11. Rest of Europe
        1. 6.4.11.1. Rest of Europe Virtual Desktop Infrastructure Market, 2017 – 2028 (USD Billion)
    5. 6.5. Asia Pacific
      1. 6.5.1. Asia Pacific Virtual Desktop Infrastructure Market, 2017 – 2028 (USD Billion)
        1. 6.5.1.1. Asia Pacific Virtual Desktop Infrastructure Market, by Country, 2017 - 2028 (USD Billion)
      2. 6.5.2. Asia Pacific Virtual Desktop Infrastructure Market, by Application, 2017 – 2028
        1. 6.5.2.1. Asia Pacific Virtual Desktop Infrastructure Market, by Application, 2017 – 2028 (USD Billion)
      3. 6.5.3. Asia Pacific Virtual Desktop Infrastructure Market, by Deployment, 2017 – 2028
        1. 6.5.3.1. Asia Pacific Virtual Desktop Infrastructure Market, by Deployment, 2017 – 2028 (USD Billion)
      4. 6.5.4. Asia Pacific Virtual Desktop Infrastructure Market, by Component, 2017 – 2028
        1. 6.5.4.1. Asia Pacific Virtual Desktop Infrastructure Market, by Component, 2017 – 2028 (USD Billion)
      5. 6.5.5. Asia Pacific Virtual Desktop Infrastructure Market, by Type, 2017 – 2028
        1. 6.5.5.1. Asia Pacific Virtual Desktop Infrastructure Market, by Type, 2017 – 2028 (USD Billion)
      6. 6.5.6. China
        1. 6.5.6.1. China Virtual Desktop Infrastructure Market, 2017 – 2028 (USD Billion)
      7. 6.5.7. Japan
        1. 6.5.7.1. Japan Virtual Desktop Infrastructure Market, 2017 – 2028 (USD Billion)
      8. 6.5.8. India
        1. 6.5.8.1. India Virtual Desktop Infrastructure Market, 2017 – 2028 (USD Billion)
      9. 6.5.9. South Korea
        1. 6.5.9.1. South Korea Virtual Desktop Infrastructure Market, 2017 – 2028 (USD Billion)
      10. 6.5.10. South-East Asia
        1. 6.5.10.1. South-East Asia Virtual Desktop Infrastructure Market, 2017 – 2028 (USD Billion)
      11. 6.5.11. Rest of Asia Pacific
        1. 6.5.11.1. Rest of Asia Pacific Virtual Desktop Infrastructure Market, 2017 – 2028 (USD Billion)
    6. 6.6. Latin America
      1. 6.6.1. Latin America Virtual Desktop Infrastructure Market, 2017 – 2028 (USD Billion)
        1. 6.6.1.1. Latin America Virtual Desktop Infrastructure Market, by Country, 2017 - 2028 (USD Billion)
      2. 6.6.2. Latin America Virtual Desktop Infrastructure Market, by Application, 2017 – 2028
        1. 6.6.2.1. Latin America Virtual Desktop Infrastructure Market, by Application, 2017 – 2028 (USD Billion)
      3. 6.6.3. Latin America Virtual Desktop Infrastructure Market, by Deployment, 2017 – 2028
        1. 6.6.3.1. Latin America Virtual Desktop Infrastructure Market, by Deployment, 2017 – 2028 (USD Billion)
      4. 6.6.4. Latin America Virtual Desktop Infrastructure Market, by Component, 2017 – 2028
        1. 6.6.4.1. Latin America Virtual Desktop Infrastructure Market, by Component, 2017 – 2028 (USD Billion)
      5. 6.6.5. Latin America Virtual Desktop Infrastructure Market, by Type, 2017 – 2028
        1. 6.6.5.1. Latin America Virtual Desktop Infrastructure Market, by Type, 2017 – 2028 (USD Billion)
      6. 6.6.6. Brazil
        1. 6.6.6.1. Brazil Virtual Desktop Infrastructure Market, 2017 – 2028 (USD Billion)
      7. 6.6.7. Mexico
        1. 6.6.7.1. Mexico Virtual Desktop Infrastructure Market, 2017 – 2028 (USD Billion)
      8. 6.6.8. Rest of Latin America
        1. 6.6.8.1. Rest of Latin America Virtual Desktop Infrastructure Market, 2017 – 2028 (USD Billion)
    7. 6.7. The Middle-East and Africa
      1. 6.7.1. The Middle-East and Africa Virtual Desktop Infrastructure Market, 2017 – 2028 (USD Billion)
        1. 6.7.1.1. The Middle-East and Africa Virtual Desktop Infrastructure Market, by Country, 2017 - 2028 (USD Billion)
      2. 6.7.2. The Middle-East and Africa Virtual Desktop Infrastructure Market, by Application, 2017 – 2028
        1. 6.7.2.1. The Middle-East and Africa Virtual Desktop Infrastructure Market, by Application, 2017 – 2028 (USD Billion)
      3. 6.7.3. The Middle-East and Africa Virtual Desktop Infrastructure Market, by Deployment, 2017 – 2028
        1. 6.7.3.1. The Middle-East and Africa Virtual Desktop Infrastructure Market, by Deployment, 2017 – 2028 (USD Billion)
      4. 6.7.4. The Middle-East and Africa Virtual Desktop Infrastructure Market, by Component, 2017 – 2028
        1. 6.7.4.1. The Middle-East and Africa Virtual Desktop Infrastructure Market, by Component, 2017 – 2028 (USD Billion)
      5. 6.7.5. The Middle-East and Africa Virtual Desktop Infrastructure Market, by Type, 2017 – 2028
        1. 6.7.5.1. The Middle-East and Africa Virtual Desktop Infrastructure Market, by Type, 2017 – 2028 (USD Billion)
      6. 6.7.6. GCC Countries
        1. 6.7.6.1. GCC Countries Virtual Desktop Infrastructure Market, 2017 – 2028 (USD Billion)
      7. 6.7.7. South Africa
        1. 6.7.7.1. South Africa Virtual Desktop Infrastructure Market, 2017 – 2028 (USD Billion)
      8. 6.7.8. Rest of Middle-East Africa
        1. 6.7.8.1. Rest of Middle-East Africa Virtual Desktop Infrastructure Market, 2017 – 2028 (USD Billion)
  7. Chapter 7 Virtual Desktop Infrastructure Market – Competitive Landscape
    1. 7.1. Competitor Market Share – Revenue
    2. 7.2. Market Concentration Rate Analysis, Top 3 and Top 5 Players
    3. 7.3. Strategic Developments
      1. 7.3.1. Acquisitions and Mergers
      2. 7.3.2. New Products
      3. 7.3.3. Research & Development Activities
  8. Chapter 8 Company Profiles
    1. 8.1. Atlantis Computing
      1. 8.1.1. Company Overview
      2. 8.1.2. Product/Service Portfolio
      3. 8.1.3. Atlantis Computing Sales, Revenue, and Gross Margin
      4. 8.1.4. Atlantis Computing Revenue and Growth Rate
      5. 8.1.5. Atlantis Computing Market Share
      6. 8.1.6. Recent Initiatives, Funding/VC Activities, and Technological Innovations
    2. 8.2. Igel Technology
      1. 8.2.1. Company Overview
      2. 8.2.2. Product/Service Portfolio
      3. 8.2.3. Igel Technology Sales, Revenue, and Gross Margin
      4. 8.2.4. Igel Technology Revenue and Growth Rate
      5. 8.2.5. Igel Technology Market Share
      6. 8.2.6. Recent Initiatives, Funding/VC Activities, and Technological Innovations
    3. 8.3. Oracle Corp
      1. 8.3.1. Company Overview
      2. 8.3.2. Product/Service Portfolio
      3. 8.3.3. Oracle Corp Sales, Revenue, and Gross Margin
      4. 8.3.4. Oracle Corp Revenue and Growth Rate
      5. 8.3.5. Oracle Corp Market Share
      6. 8.3.6. Recent Initiatives, Funding/VC Activities, and Technological Innovations
    4. 8.4. Microsoft Corp
      1. 8.4.1. Company Overview
      2. 8.4.2. Product/Service Portfolio
      3. 8.4.3. Microsoft Corp Sales, Revenue, and Gross Margin
      4. 8.4.4. Microsoft Corp Revenue and Growth Rate
      5. 8.4.5. Microsoft Corp Market Share
      6. 8.4.6. Recent Initiatives, Funding/VC Activities, and Technological Innovations
    5. 8.5. NComputing
      1. 8.5.1. Company Overview
      2. 8.5.2. Product/Service Portfolio
      3. 8.5.3. NComputing Sales, Revenue, and Gross Margin
      4. 8.5.4. NComputing Revenue and Growth Rate
      5. 8.5.5. NComputing Market Share
      6. 8.5.6. Recent Initiatives, Funding/VC Activities, and Technological Innovations
    6. 8.6. Citrix Systems Inc
      1. 8.6.1. Company Overview
      2. 8.6.2. Product/Service Portfolio
      3. 8.6.3. Citrix Systems Inc Sales, Revenue, and Gross Margin
      4. 8.6.4. Citrix Systems Inc Revenue and Growth Rate
      5. 8.6.5. Citrix Systems Inc Market Share
      6. 8.6.6. Recent Initiatives, Funding/VC Activities, and Technological Innovations
    7. 8.7. Cisco Systems Inc
      1. 8.7.1. Company Overview
      2. 8.7.2. Product/Service Portfolio
      3. 8.7.3. Cisco Systems Inc Sales, Revenue, and Gross Margin
      4. 8.7.4. Cisco Systems Inc Revenue and Growth Rate
      5. 8.7.5. Cisco Systems Inc Market Share
      6. 8.7.6. Recent Initiatives, Funding/VC Activities, and Technological Innovations
    8. 8.8. Parallels
      1. 8.8.1. Company Overview
      2. 8.8.2. Product/Service Portfolio
      3. 8.8.3. Parallels Sales, Revenue, and Gross Margin
      4. 8.8.4. Parallels Revenue and Growth Rate
      5. 8.8.5. Parallels Market Share
      6. 8.8.6. Recent Initiatives, Funding/VC Activities, and Technological Innovations
    9. 8.9. Hewlett Packard Enterprise Co
      1. 8.9.1. Company Overview
      2. 8.9.2. Product/Service Portfolio
      3. 8.9.3. Hewlett Packard Enterprise Co Sales, Revenue, and Gross Margin
      4. 8.9.4. Hewlett Packard Enterprise Co Revenue and Growth Rate
      5. 8.9.5. Hewlett Packard Enterprise Co Market Share
      6. 8.9.6. Recent Initiatives, Funding/VC Activities, and Technological Innovations
    10. 8.10. Listeq
      1. 8.10.1. Company Overview
      2. 8.10.2. Product/Service Portfolio
      3. 8.10.3. Listeq Sales, Revenue, and Gross Margin
      4. 8.10.4. Listeq Revenue and Growth Rate
      5. 8.10.5. Listeq Market Share
      6. 8.10.6. Recent Initiatives, Funding/VC Activities, and Technological Innovations
    11. 8.11. VMware Inc
      1. 8.11.1. Company Overview
      2. 8.11.2. Product/Service Portfolio
      3. 8.11.3. VMware Inc Sales, Revenue, and Gross Margin
      4. 8.11.4. VMware Inc Revenue and Growth Rate
      5. 8.11.5. VMware Inc Market Share
      6. 8.11.6. Recent Initiatives, Funding/VC Activities, and Technological Innovations
    12. 8.12. Pano Logic
      1. 8.12.1. Company Overview
      2. 8.12.2. Product/Service Portfolio
      3. 8.12.3. Pano Logic Sales, Revenue, and Gross Margin
      4. 8.12.4. Pano Logic Revenue and Growth Rate
      5. 8.12.5. Pano Logic Market Share
      6. 8.12.6. Recent Initiatives, Funding/VC Activities, and Technological Innovations
    13. 8.13. Dell Technologies Inc
      1. 8.13.1. Company Overview
      2. 8.13.2. Product/Service Portfolio
      3. 8.13.3. Dell Technologies Inc Sales, Revenue, and Gross Margin
      4. 8.13.4. Dell Technologies Inc Revenue and Growth Rate
      5. 8.13.5. Dell Technologies Inc Market Share
      6. 8.13.6. Recent Initiatives, Funding/VC Activities, and Technological Innovations
    14. 8.14. International Business Machines Corp
      1. 8.14.1. Company Overview
      2. 8.14.2. Product/Service Portfolio
      3. 8.14.3. International Business Machines Corp Sales, Revenue, and Gross Margin
      4. 8.14.4. International Business Machines Corp Revenue and Growth Rate
      5. 8.14.5. International Business Machines Corp Market Share
      6. 8.14.6. Recent Initiatives, Funding/VC Activities, and Technological Innovations
    15. 8.15. Huawei Investment and Holding Co. Ltd
      1. 8.15.1. Company Overview
      2. 8.15.2. Product/Service Portfolio
      3. 8.15.3. Huawei Investment and Holding Co. Ltd Sales, Revenue, and Gross Margin
      4. 8.15.4. Huawei Investment and Holding Co. Ltd Revenue and Growth Rate
      5. 8.15.5. Huawei Investment and Holding Co. Ltd Market Share
      6. 8.15.6. Recent Initiatives, Funding/VC Activities, and Technological Innovations
    16. 8.16. Fujitsu Ltd
      1. 8.16.1. Company Overview
      2. 8.16.2. Product/Service Portfolio
      3. 8.16.3. Fujitsu Ltd Sales, Revenue, and Gross Margin
      4. 8.16.4. Fujitsu Ltd Revenue and Growth Rate
      5. 8.16.5. Fujitsu Ltd Market Share
      6. 8.16.6. Recent Initiatives, Funding/VC Activities, and Technological Innovations
    17. 8.17. Netapp
      1. 8.17.1. Company Overview
      2. 8.17.2. Product/Service Portfolio
      3. 8.17.3. Netapp Sales, Revenue, and Gross Margin
      4. 8.17.4. Netapp Revenue and Growth Rate
      5. 8.17.5. Netapp Market Share
      6. 8.17.6. Recent Initiatives, Funding/VC Activities, and Technological Innovations
    18. 8.18. Dincloud
      1. 8.18.1. Company Overview
      2. 8.18.2. Product/Service Portfolio
      3. 8.18.3. Dincloud Sales, Revenue, and Gross Margin
      4. 8.18.4. Dincloud Revenue and Growth Rate
      5. 8.18.5. Dincloud Market Share
      6. 8.18.6. Recent Initiatives, Funding/VC Activities, and Technological Innovations
    19. 8.19. Amazon.com Inc
      1. 8.19.1. Company Overview
      2. 8.19.2. Product/Service Portfolio
      3. 8.19.3. Amazon.com Inc Sales, Revenue, and Gross Margin
      4. 8.19.4. Amazon.com Inc Revenue and Growth Rate
      5. 8.19.5. Amazon.com Inc Market Share
      6. 8.19.6. Recent Initiatives, Funding/VC Activities, and Technological Innovations
  9. Chapter 9 Virtual Desktop Infrastructure — Industry Analysis
    1. 9.1. Introduction and Taxonomy
    2. 9.2. Virtual Desktop Infrastructure Market – Key Trends
      1. 9.2.1. Market Drivers
      2. 9.2.2. Market Restraints
      3. 9.2.3. Market Opportunities
    3. 9.3. Porter’s Five Forces Model
      1. 9.3.1. Bargaining Power of Buyers
      2. 9.3.2. Bargaining Power of Suppliers
      3. 9.3.3. Threat of Substitute
      4. 9.3.4. Threat of New Entrants
      5. 9.3.5. Rivalry among Existing Competitors
    4. 9.4. PESTEL Analysis
    5. 9.5. Key Mandates and Regulations
    6. 9.6. Technology Roadmap and Timeline
    7. 9.7. Virtual Desktop Infrastructure Market – Attractiveness Analysis
      1. 9.7.1. By Application
      2. 9.7.2. By Deployment
      3. 9.7.3. By Component
      4. 9.7.4. By Type
      5. 9.7.5. By Region
  10. Chapter 10 Report Conclusion & Key Insights
    1. 10.1. Key Insights from Primary Interviews & Surveys Respondents
    2. 10.2. Key Takeaways from Analysts, Consultants, and Industry Leaders
  11. Chapter 11 Research Approach & Methodology
    1. 11.1. Report Description
    2. 11.2. Research Scope
    3. 11.3. Research Methodology
      1. 11.3.1. Secondary Research
      2. 11.3.2. Primary Research
      3. 11.3.3. Statistical Models
        1. 11.3.3.1. Company Share Analysis Model
        2. 11.3.3.2. Revenue Based Modeling
      4. 11.3.4. Research Limitations

      List of Figures

      Fig.1 Product Picture of Virtual Desktop Infrastructure
      Fig.2 Global Virtual Desktop Infrastructure Market, 2017 – 2028 (USD Billion)
      Fig.3 Global Virtual Desktop Infrastructure Market Absolute Revenue Opportunity, 2017 – 2028 (USD Billion)
      Fig.4 Global Virtual Desktop Infrastructure Market Incremental Revenue Opportunity, 2021 – 2028 (USD Billion)
      Fig.5 COVID-19 Impacts on Virtual Desktop Infrastructure
      Fig.6 COVID-19 Impact on the Players
      Fig.7 Business Strategies and Recommendations
      Fig.8 Global Virtual Desktop Infrastructure Market Share, by Application, 2021 & 2028 (USD Billion)
      Fig.9 Global IT & Telecommunication Virtual Desktop Infrastructure Market, 2021 – 2028 (USD Billion)
      Fig.10 Global Media & Entertainment Virtual Desktop Infrastructure Market, 2021 – 2028 (USD Billion)
      Fig.11 Global Education Virtual Desktop Infrastructure Market, 2021 – 2028 (USD Billion)
      Fig.12 Global Healthcare Virtual Desktop Infrastructure Market, 2021 – 2028 (USD Billion)
      Fig.13 Global BFSI Virtual Desktop Infrastructure Market, 2021 – 2028 (USD Billion)
      Fig.14 Global Government Virtual Desktop Infrastructure Market, 2021 – 2028 (USD Billion)
      Fig.15 Global Retail Virtual Desktop Infrastructure Market, 2021 – 2028 (USD Billion)
      Fig.16 Global Manufacturing Virtual Desktop Infrastructure Market, 2021 – 2028 (USD Billion)
      Fig.17 Global Others Virtual Desktop Infrastructure Market, 2021 – 2028 (USD Billion)
      Fig.18 Global Virtual Desktop Infrastructure Market Share, by Deployment, 2020& 2026 (USD Billion)
      Fig.19 Global On-Premise Virtual Desktop Infrastructure Market, 2021 – 2028 (USD Billion)
      Fig.20 Global Cloud-based Virtual Desktop Infrastructure Market, 2021 – 2028 (USD Billion)
      Fig.21 Global Virtual Desktop Infrastructure Market Share, by Component, 2020& 2026 (USD Billion)
      Fig.22 Global Platform Virtual Desktop Infrastructure Market, 2021 – 2028 (USD Billion)
      Fig.23 Global Service Virtual Desktop Infrastructure Market, 2021 – 2028 (USD Billion)
      Fig.24 Global Hardware Virtual Desktop Infrastructure Market, 2021 – 2028 (USD Billion)
      Fig.25 Global Virtual Desktop Infrastructure Market Share, by Type, 2020& 2026 (USD Billion)
      Fig.26 Global Non-persistent VDI Virtual Desktop Infrastructure Market, 2021 – 2028 (USD Billion)
      Fig.27 Global Persistent VDI Virtual Desktop Infrastructure Market, 2021 – 2028 (USD Billion)
      Fig.28 Global Virtual Desktop Infrastructure Market Share, by Region, 2020& 2026 (USD Billion)
      Fig.29 North America Virtual Desktop Infrastructure Market, 2021 – 2028 (USD Billion)
      Fig.30 U.S. Virtual Desktop Infrastructure Market, 2021 – 2028 (USD Billion)
      Fig.31 Canada Virtual Desktop Infrastructure Market, 2021 – 2028 (USD Billion)
      Fig.32 Europe Virtual Desktop Infrastructure Market, 2021 – 2028 (USD Billion)
      Fig.33 Germany Virtual Desktop Infrastructure Market, 2021 – 2028 (USD Billion)
      Fig.34 France Virtual Desktop Infrastructure Market, 2021 – 2028 (USD Billion)
      Fig.35 U.K. Virtual Desktop Infrastructure Market, 2021 – 2028 (USD Billion)
      Fig.36 Italy Virtual Desktop Infrastructure Market, 2021 – 2028 (USD Billion)
      Fig.37 Spain Virtual Desktop Infrastructure Market, 2021 – 2028 (USD Billion)
      Fig.38 Rest of Europe Virtual Desktop Infrastructure Market, 2021 – 2028 (USD Billion)
      Fig.39 Asia Pacific Virtual Desktop Infrastructure Market, 2021 – 2028 (USD Billion)
      Fig.40 China Virtual Desktop Infrastructure Market, 2021 – 2028 (USD Billion)
      Fig.41 Japan Virtual Desktop Infrastructure Market, 2021 – 2028 (USD Billion)
      Fig.42 India Virtual Desktop Infrastructure Market, 2021 – 2028 (USD Billion)
      Fig.43 South  Korea Virtual Desktop Infrastructure Market, 2021 – 2028 (USD Billion)
      Fig.44 South-East Asia Virtual Desktop Infrastructure Market, 2021 – 2028 (USD Billion)
      Fig.45 Rest of Asia Pacific Virtual Desktop Infrastructure Market, 2021 – 2028 (USD Billion)
      Fig.46 Latin America Virtual Desktop Infrastructure Market, 2021 – 2028 (USD Billion)
      Fig.47 Brazil Virtual Desktop Infrastructure Market, 2021 – 2028 (USD Billion)
      Fig.48 Mexico Virtual Desktop Infrastructure Market, 2021 – 2028 (USD Billion)
      Fig.49 Rest of Latin America Virtual Desktop Infrastructure Market, 2021 – 2028 (USD Billion)
      Fig.50 The Middle-East and Africa Virtual Desktop Infrastructure Market, 2021 – 2028 (USD Billion)
      Fig.51 GCC Countries Virtual Desktop Infrastructure Market, 2021 – 2028 (USD Billion)
      Fig.52 South Africa Virtual Desktop Infrastructure Market, 2021 – 2028 (USD Billion)
      Fig.53 Rest of Middle-East Africa Virtual Desktop Infrastructure Market, 2021 – 2028 (USD Billion)
      Fig.54 Competitor Market Share – Revenue
      Fig.55 Atlantis Computing Revenue and Growth Rate
      Fig.56 Atlantis Computing Market Share
      Fig.57 Igel Technology Revenue and Growth Rate
      Fig.58 Igel Technology Market Share
      Fig.59 Oracle Corp Revenue and Growth Rate
      Fig.60 Oracle Corp Market Share
      Fig.61 Microsoft Corp Revenue and Growth Rate
      Fig.62 Microsoft Corp Market Share
      Fig.63 NComputing Revenue and Growth Rate
      Fig.64 NComputing Market Share
      Fig.65 Citrix Systems Inc Revenue and Growth Rate
      Fig.66 Citrix Systems Inc Market Share
      Fig.67 Cisco Systems Inc Revenue and Growth Rate
      Fig.68 Cisco Systems Inc Market Share
      Fig.69 Parallels Revenue and Growth Rate
      Fig.70 Parallels Market Share
      Fig.71 Hewlett Packard Enterprise Co Revenue and Growth Rate
      Fig.72 Hewlett Packard Enterprise Co Market Share
      Fig.73 Listeq Revenue and Growth Rate
      Fig.74 Listeq Market Share
      Fig.75 VMware Inc Revenue and Growth Rate
      Fig.76 VMware Inc Market Share
      Fig.77 Pano Logic Revenue and Growth Rate
      Fig.78 Pano Logic Market Share
      Fig.79 Dell Technologies Inc Revenue and Growth Rate
      Fig.80 Dell Technologies Inc Market Share
      Fig.81 International Business Machines Corp Revenue and Growth Rate
      Fig.82 International Business Machines Corp Market Share
      Fig.83 Huawei Investment and Holding Co. Ltd Revenue and Growth Rate
      Fig.84 Huawei Investment and Holding Co. Ltd Market Share
      Fig.85 Fujitsu Ltd Revenue and Growth Rate
      Fig.86 Fujitsu Ltd Market Share
      Fig.87 Netapp Revenue and Growth Rate
      Fig.88 Netapp Market Share
      Fig.89 Dincloud Revenue and Growth Rate
      Fig.90 Dincloud Market Share
      Fig.91 Amazon.com Inc Revenue and Growth Rate
      Fig.92 Amazon.com Inc Market Share
      Fig.93 Market Dynamics
      Fig.94 PESTEL Analysis
      Fig.95 Key Mandates and Regulations
      Fig.96 Technology Roadmap and Timeline
      Fig.97 Market Attractiveness Analysis – By Application
      Fig.98 Market Attractiveness Analysis – By Deployment
      Fig.99 Market Attractiveness Analysis – By Component
      Fig.100 Market Attractiveness Analysis – By Type
      Fig.101 Market Attractiveness Analysis – By Region
      

      List of Tables

      Table 1 Global Virtual Desktop Infrastructure Market, 2021& 2028 (USD Billion)
      Table 2 Global Virtual Desktop Infrastructure Market, by Application, 2017 – 2028 (USD Billion)
      Table 3 Global Virtual Desktop Infrastructure Market, by Deployment, 2017 – 2028 (USD Billion)
      Table 4 Global Virtual Desktop Infrastructure Market, by Component, 2017 – 2028 (USD Billion)
      Table 5 Global Virtual Desktop Infrastructure Market, by Type, 2017 – 2028 (USD Billion)
      Table 6 Global Virtual Desktop Infrastructure Market, by Region, 2017 – 2028 (USD Billion)
      Table 7 North America Virtual Desktop Infrastructure Market, by Country, 2017 – 2028 (USD Billion)
      Table 8 North America Virtual Desktop Infrastructure Market, by Application, 2017 – 2028 (USD Billion)
      Table 9 North America Virtual Desktop Infrastructure Market, by Deployment, 2017 – 2028 (USD Billion)
      Table 10 North America Virtual Desktop Infrastructure Market, by Component, 2017 – 2028 (USD Billion)
      Table 11 North America Virtual Desktop Infrastructure Market, by Type, 2017 – 2028 (USD Billion)
      Table 12 Europe Virtual Desktop Infrastructure Market, by Country, 2017 – 2028 (USD Billion)
      Table 13 Europe Virtual Desktop Infrastructure Market, by Application, 2017 – 2028 (USD Billion)
      Table 14 Europe Virtual Desktop Infrastructure Market, by Deployment, 2017 – 2028 (USD Billion)
      Table 15 Europe Virtual Desktop Infrastructure Market, by Component, 2017 – 2028 (USD Billion)
      Table 16 Europe Virtual Desktop Infrastructure Market, by Type, 2017 – 2028 (USD Billion)
      Table 17 Asia Pacific Virtual Desktop Infrastructure Market, by Country, 2017 – 2028 (USD Billion)
      Table 18 Asia Pacific Virtual Desktop Infrastructure Market, by Application, 2017 – 2028 (USD Billion)
      Table 19 Asia Pacific Virtual Desktop Infrastructure Market, by Deployment, 2017 – 2028 (USD Billion)
      Table 20 Asia Pacific Virtual Desktop Infrastructure Market, by Component, 2017 – 2028 (USD Billion)
      Table 21 Asia Pacific Virtual Desktop Infrastructure Market, by Type, 2017 – 2028 (USD Billion)
      Table 22 Latin America Virtual Desktop Infrastructure Market, by Country, 2017 – 2028 (USD Billion)
      Table 23 Latin America Virtual Desktop Infrastructure Market, by Application, 2017 – 2028 (USD Billion)
      Table 24 Latin America Virtual Desktop Infrastructure Market, by Deployment, 2017 – 2028 (USD Billion)
      Table 25 Latin America Virtual Desktop Infrastructure Market, by Component, 2017 – 2028 (USD Billion)
      Table 26 Latin America Virtual Desktop Infrastructure Market, by Type, 2017 – 2028 (USD Billion)
      Table 27 The Middle-East and Africa Virtual Desktop Infrastructure Market, by Country, 2017 – 2028 (USD Billion)
      Table 28 The Middle-East and Africa Virtual Desktop Infrastructure Market, by Application, 2017 – 2028 (USD Billion)
      Table 29 The Middle-East and Africa Virtual Desktop Infrastructure Market, by Deployment, 2017 – 2028 (USD Billion)
      Table 30 The Middle-East and Africa Virtual Desktop Infrastructure Market, by Component, 2017 – 2028 (USD Billion)
      Table 31 The Middle-East and Africa Virtual Desktop Infrastructure Market, by Type, 2017 – 2028 (USD Billion)
      Table 32 Global Virtual Desktop Infrastructure Market - Company Revenue Analysis, 2017 – 2020 (USD Billion)
      Table 33 Global Virtual Desktop Infrastructure Market - Company Revenue Share Analysis, 2017 – 2020 (%)
      Table 34 Acquisitions and Mergers
      Table 35 Market Drivers – Impact Analysis
      Table 36 Market Restraints
      Table 37 Market Opportunities
      

Industry Major Market Players

  • Microsoft Corp.
  • Parallels
  • Pano Logic
  • Cisco Systems Inc.
  • Listeq
  • VMware Inc.
  • Hewlett Packard Enterprise Co.
  • Oracle Corp.
  • Igel Technology
  • International Business Machines Corp.
  • Dell Technologies Inc.
  • Fujitsu Ltd.
  • Netapp
  • Dincloud
  • Amazon.com Inc.
  • Huawei Investment and Holding Co. Ltd.
  • Atlantis Computing
  • NComputing
  • Citrix Systems Inc.