Search Market Research Report

Discover Our Latest Reports
Discover Our Featured Reports
Discover Top Selling Reports

Viral Vectors And Plasmid DNA Manufacturing Market Size, Share Global Analysis Report, , 2021 – 2026

report img

Viral Vectors And Plasmid DNA Manufacturing Market By Product Type (Viral Vectors, Plasma DNA, and Non-Viral DNA Vectors), By Application (Cancer, Inherited Disorder, Infectious Diseases, and Others), and By End-User (DNA Vaccines, Gene Therapy, Immunotherapy, and Others): Global Industry Perspective, Comprehensive Analysis, and Forecast, 2021 – 2026

Industry Insights

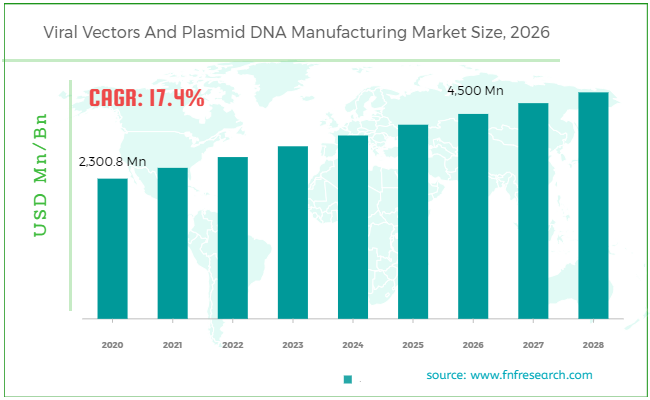
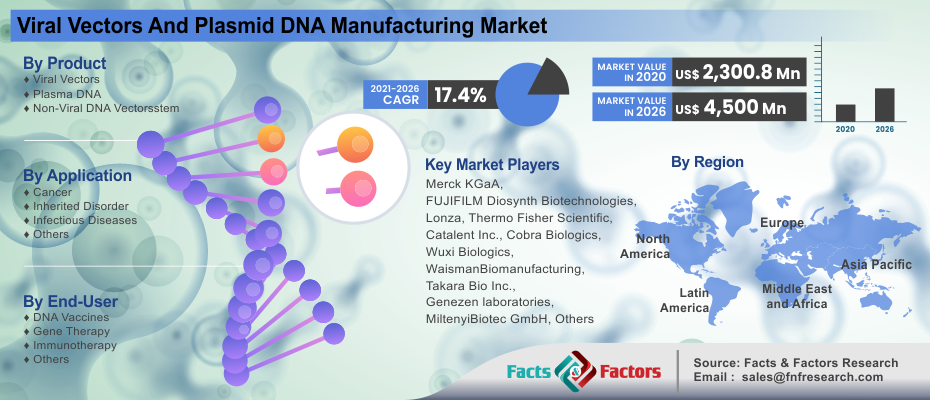
[196+ Pages Report] According to a Facts & Factors report, the global viral vectors and plasmid DNA manufacturing market was estimated at approximately USD 2,300.8 Million in 2020 and is projected to produce revenue worth approximately USD 4,500 Million by the end of 2026, growing at a CAGR of approximately 17.4% between 2021 and 2026.

Viral Vectors And Plasmid DNA Manufacturing Market Size

To know more about this report | Request Free Sample Copy

logoGlobal Viral Vectors & Plasmid DNA Manufacturing Market: Overview

A viral vector is a molecular biologist's instrument for transporting genetic material into cells. Viruses have evolved specific ways to transport their DNA into the cells they infect. Retrovirus, lentivirus, adenovirus, herpes simplex virus, and adeno-adenovirus are all examples of viral vectors that may be employed to transfer nucleic acids into the genetic composition of cells. The plasma DNA is a lump of DNA materials gained from different tissues and cells, and it is a microbial circular, smaller, and extrachromosomal DNA duplicate self-reliantly utilized in recombinant DNA technology and genetic engineering. The plasma DNA is categorized into GMP Grade Plasmid DNA, Non-GMP grade plasmid DNA, and high-quality plasmid DNA. The high-quality plasmid DNA is utilized in the GMP-compliant making of recombinant viruses, RNA, antibodies.

Viral Vectors And Plasmid DNA Manufacturing Market

To know more about this report | Request Free Sample Copy

logoGlobal Viral Vectors & Plasmid DNA Manufacturing Market: Growth Factor

The viral vectors and plasmid DNA manufacturing market size is expected to enlarge at a significant growth rate during the forecast period. The increasing demand for viral vector-based vaccines for infectious diseases and the constant change in the treatment model of numerous life-threatening diseases using advanced therapies are some key factors that are driving the growth of the market across the globe. The rising employment of viral vectors and plasmid DNA for the research and development of highly developed therapies is likely to fuel the global viral vectors and plasmid DNA manufacturing market. Furthermore, the competition in the arena is projected to strengthen over the analysis period due to the resultant boost in manufacturing potential and escalating gene therapy approvals.

However, the major factors restraining the growth of the market are ethical, regulatory, and scientific challenges regarding gene therapy, the manufacturing capacity restrictions, and production challenges concerning to large-scale manufacturing of vectors. Conversely, the surge in healthcare infrastructure will generate several opportunities in the sector, where the demand for viral vectors and plasmid DNA will boost across the world. Also, the COVID-19 pandemic is offering lucrative opportunities for the top players in the market.

logoGlobal Viral Vectors & Plasmid DNA Manufacturing Market: Segmentation

The global viral vectors & plasmid DNA manufacturing market has been classified into product type, application, and end-user. The global market of viral vectors & plasmid DNA manufacturing based on the product type has been segmented into viral vectors, plasma DNA, and non-viral DNA vectors. Based on the application, the market has been divided into cancer, inherited disorder, infectious diseases, and others. In terms of the end-user, the market has been separated into DNA vaccines, gene therapy, immunotherapy, and others.

logoReport Scope

Report Attributes

Details

Market Size in 2020

USD 2,300.8 Million

Projected Market Size in 2026

USD 4,500 Million

CAGR Growth Rate

17.4% CAGR

Base Year

2020

Forecast Years

2021 - 2026

Key Market Players

Merck KGaA, FUJIFILM Diosynth Biotechnologies, Lonza, Thermo Fisher Scientific, Catalent Inc., Cobra Biologics, Wuxi Biologics, WaismanBiomanufacturing, Takara Bio Inc., Genezen laboratories, MiltenyiBiotec GmbH, Batavia Biosciences, SIRION Biotech GmbH, BioNTech IMFS GmbH, Virovek Incorporation, Audentes Therapeutics, RegenxBio Inc., BioMarin Pharmaceutical, YPOSKESI, and Advanced BioScience

Key Segment

By Product Type, By Application, By End-User, and By Region

Major Regions Covered

North America, Europe, Asia Pacific, Latin America, and the Middle East & Africa

Purchase Options

Request customized purchase options to meet your research needs. Explore purchase options

logoGlobal Viral Vectors & Plasmid DNA Manufacturing Market: Regional Analysis

North America is leading the global market of viral vectors and plasmid DNA manufacturing market and is contributing to the largest CAGR. The factors contributing to the market growth in this region are the occurrence of the numerous institutes and centers engaged in the research and development of superior therapies. As a result of the growing regulatory approvals for superior therapies, the United States contributed extensively to regional income production. Also, companies based in the United States are investing a major amount to develop their production potential.

logoGlobal Viral Vectors & Plasmid DNA Manufacturing Market: Competitive Players

  • Merck KGaA
  • FUJIFILM Diosynth Biotechnologies
  • Lonza
  • Thermo Fisher Scientific
  • Catalent Inc.
  • Cobra Biologics
  • Wuxi Biologics
  • WaismanBiomanufacturing
  • Takara Bio Inc.
  • Genezen laboratories
  • MiltenyiBiotec GmbH
  • Batavia Biosciences
  • SIRION Biotech GmbH
  • BioNTech IMFS GmbH
  • Virovek Incorporation
  • Audentes Therapeutics
  • RegenxBio Inc.
  • BioMarin Pharmaceutical
  • YPOSKESI
  • Advanced BioScience 

are some market companies operating in the market of vectors & plasmid DNA manufacturing worldwide. Furthermore, these market players are working in partnership with major operating stakeholders as well as regulatory bodies, non-industry, and industry players, and others to deal with the challenges efficiently in viral vector production.

logoGlobal Viral Vectors & Plasmid DNA Manufacturing Market: By Product Type

  • Viral Vectors
  • Plasma DNA
  • Non-Viral DNA Vectors

logoGlobal Viral Vectors & Plasmid DNA Manufacturing Market: By Application

  • Cancer
  • Inherited Disorder
  • Infectious Diseases
  • Others

logoGlobal Viral Vectors & Plasmid DNA Manufacturing Market: By End-User

  • DNA Vaccines
  • Gene Therapy
  • Immunotherapy
  • Others

logoGlobal Viral Vectors & Plasmid DNA Manufacturing Market: Regional Segmentation Analysis

  • North America
    • The U.S.
    • Canada
  • Europe
    • France
    • The UK
    • Spain
    • Germany
    • Italy
    • Rest of Europe
  • Asia Pacific
    • China
    • Japan
    • India
    • South Korea
    • Southeast Asia
    • Rest of Asia Pacific
  • Latin America
    • Brazil
    • Mexico
    • Rest of Latin America
  • Middle East & Africa
    • GCC
    • South Africa
    • Rest of Middle East & Africa

Table of Content

  1. Chapter 1 Executive Summary
    1. 1.1. Introduction of Viral Vectors & Plasmid DNA Manufacturing
    2. 1.2. Global Viral Vectors & Plasmid DNA Manufacturing Market, 2020 & 2026 (USD Million)
    3. 1.3. Global Viral Vectors & Plasmid DNA Manufacturing Market, 2016 – 2026(USD Million)
    4. 1.4. Global Viral Vectors & Plasmid DNA Manufacturing MarketAbsolute Revenue Opportunity, 2016 – 2026(USD Million)
    5. 1.5. Global Viral Vectors & Plasmid DNA Manufacturing MarketIncremental Revenue Opportunity, 2020 – 2026(USD Million)
  2. Chapter 2 Viral Vectors & Plasmid DNA Manufacturing Market – Product Type Analysis
    1. 2.1. Global Viral Vectors & Plasmid DNA Manufacturing Market – Product Type Overview
    2. 2.2. Global Viral Vectors & Plasmid DNA Manufacturing Market Share, by Product Type, 2020 & 2026(USD Million)
    3. 2.3. Viral Vectors
      1. 2.3.1. Global Viral Vectors Viral Vectors & Plasmid DNA Manufacturing Market, 2016 – 2026(USD Million)
    4. 2.4. Plasma DNA
      1. 2.4.1. Global Plasma DNA Viral Vectors & Plasmid DNA Manufacturing Market, 2016 – 2026(USD Million)
    5. 2.5. Non-Viral DNA Vectors
      1. 2.5.1. Global Non-Viral DNA Vectors Viral Vectors & Plasmid DNA Manufacturing Market, 2016 – 2026(USD Million)
  3. Chapter 3 Viral Vectors & Plasmid DNA Manufacturing Market – Application Analysis
    1. 3.1. Global Viral Vectors & Plasmid DNA Manufacturing Market – Application Overview
    2. 3.2. Global Viral Vectors & Plasmid DNA Manufacturing Market Share, by Application, 2020 & 2026(USD Million)
    3. 3.3. Cancer
      1. 3.3.1. Global Cancer Viral Vectors & Plasmid DNA Manufacturing Market, 2016 – 2026(USD Million)
    4. 3.4. Inherited Disorder
      1. 3.4.1. Global Inherited Disorder Viral Vectors & Plasmid DNA Manufacturing Market, 2016 – 2026(USD Million)
    5. 3.5. Infectious Diseases
      1. 3.5.1. Global Infectious Diseases Viral Vectors & Plasmid DNA Manufacturing Market, 2016 – 2026(USD Million)
    6. 3.6. Others
      1. 3.6.1. Global Others Viral Vectors & Plasmid DNA Manufacturing Market, 2016 – 2026(USD Million)
  4. Chapter 4 Viral Vectors & Plasmid DNA Manufacturing Market – End-User Analysis
    1. 4.1. Global Viral Vectors & Plasmid DNA Manufacturing Market – End-User Overview
    2. 4.2. Global Viral Vectors & Plasmid DNA Manufacturing Market Share, by End-User, 2020 & 2026(USD Million)
    3. 4.3. DNA Vaccines
      1. 4.3.1. Global DNA Vaccines Viral Vectors & Plasmid DNA Manufacturing Market, 2016 – 2026(USD Million)
    4. 4.4. Gene Therapy
      1. 4.4.1. Global Gene Therapy Viral Vectors & Plasmid DNA Manufacturing Market, 2016 – 2026(USD Million)
    5. 4.5. Immunotherapy
      1. 4.5.1. Global Immunotherapy Viral Vectors & Plasmid DNA Manufacturing Market, 2016 – 2026(USD Million)
    6. 4.6. Others
      1. 4.6.1. Global Others Viral Vectors & Plasmid DNA Manufacturing Market, 2016 – 2026(USD Million)
  5. Chapter 5 Viral Vectors & Plasmid DNA Manufacturing Market – Regional Analysis
    1. 5.1. Global Viral Vectors & Plasmid DNA Manufacturing Market Regional Overview
    2. 5.2. Global Viral Vectors & Plasmid DNA Manufacturing Market Share, by Region, 2020 & 2026(USD Million)
    3. 5.3. North America
      1. 5.3.1. North America Viral Vectors & Plasmid DNA Manufacturing Market, 2016 – 2026(USD Million)
        1. 5.3.1.1. North America Viral Vectors & Plasmid DNA Manufacturing Market, by Country, 2016 - 2026(USD Million)
      2. 5.3.2. North America Viral Vectors & Plasmid DNA Manufacturing Market, by Product Type, 2016 – 2026
        1. 5.3.2.1. North America Viral Vectors & Plasmid DNA Manufacturing Market, by Product Type, 2016 – 2026(USD Million)
      3. 5.3.3. North America Viral Vectors & Plasmid DNA Manufacturing Market, by Application, 2016 – 2026
        1. 5.3.3.1. North America Viral Vectors & Plasmid DNA Manufacturing Market, by Application, 2016 – 2026(USD Million)
      4. 5.3.4. North America Viral Vectors & Plasmid DNA Manufacturing Market, by End-User, 2016 – 2026
        1. 5.3.4.1. North America Viral Vectors & Plasmid DNA Manufacturing Market, by End-User, 2016 – 2026(USD Million)
      5. 5.3.5. U.S.
        1. 5.3.5.1. U.S. Viral Vectors & Plasmid DNA Manufacturing Market, 2016 – 2026(USD Million)
      6. 5.3.6. Canada
        1. 5.3.6.1. Canada Viral Vectors & Plasmid DNA Manufacturing Market, 2016 – 2026(USD Million)
    4. 5.4. Europe
      1. 5.4.1. Europe Viral Vectors & Plasmid DNA Manufacturing Market, 2016 – 2026(USD Million)
        1. 5.4.1.1. Europe Viral Vectors & Plasmid DNA Manufacturing Market, by Country, 2016 - 2026(USD Million)
      2. 5.4.2. Europe Viral Vectors & Plasmid DNA Manufacturing Market, by Product Type, 2016 – 2026
        1. 5.4.2.1. Europe Viral Vectors & Plasmid DNA Manufacturing Market, by Product Type, 2016 – 2026(USD Million)
      3. 5.4.3. Europe Viral Vectors & Plasmid DNA Manufacturing Market, by Application, 2016 – 2026
        1. 5.4.3.1. Europe Viral Vectors & Plasmid DNA Manufacturing Market, by Application, 2016 – 2026(USD Million)
      4. 5.4.4. Europe Viral Vectors & Plasmid DNA Manufacturing Market, by End-User, 2016 – 2026
        1. 5.4.4.1. Europe Viral Vectors & Plasmid DNA Manufacturing Market, by End-User, 2016 – 2026(USD Million)
      5. 5.4.5. Germany
        1. 5.4.5.1. Germany Viral Vectors & Plasmid DNA Manufacturing Market, 2016 – 2026(USD Million)
      6. 5.4.6. France
        1. 5.4.6.1. France Viral Vectors & Plasmid DNA Manufacturing Market, 2016 – 2026(USD Million)
      7. 5.4.7. U.K.
        1. 5.4.7.1. U.K. Viral Vectors & Plasmid DNA Manufacturing Market, 2016 – 2026(USD Million)
      8. 5.4.8. Italy
        1. 5.4.8.1. Italy Viral Vectors & Plasmid DNA Manufacturing Market, 2016 – 2026(USD Million)
      9. 5.4.9. Spain
        1. 5.4.9.1. Spain Viral Vectors & Plasmid DNA Manufacturing Market, 2016 – 2026(USD Million)
      10. 5.4.10. Rest of Europe
        1. 5.4.10.1. Rest of Europe Viral Vectors & Plasmid DNA Manufacturing Market, 2016 – 2026(USD Million)
    5. 5.5. Asia Pacific
      1. 5.5.1. Asia Pacific Viral Vectors & Plasmid DNA Manufacturing Market, 2016 – 2026(USD Million)
        1. 5.5.1.1. Asia Pacific Viral Vectors & Plasmid DNA Manufacturing Market, by Country, 2016 - 2026(USD Million)
      2. 5.5.2. Asia Pacific Viral Vectors & Plasmid DNA Manufacturing Market, by Product Type, 2016 – 2026
        1. 5.5.2.1. Asia Pacific Viral Vectors & Plasmid DNA Manufacturing Market, by Product Type, 2016 – 2026(USD Million)
      3. 5.5.3. Asia Pacific Viral Vectors & Plasmid DNA Manufacturing Market, by Application, 2016 – 2026
        1. 5.5.3.1. Asia Pacific Viral Vectors & Plasmid DNA Manufacturing Market, by Application, 2016 – 2026(USD Million)
      4. 5.5.4. Asia Pacific Viral Vectors & Plasmid DNA Manufacturing Market, by End-User, 2016 – 2026
        1. 5.5.4.1. Asia Pacific Viral Vectors & Plasmid DNA Manufacturing Market, by End-User, 2016 – 2026(USD Million)
      5. 5.5.5. China
        1. 5.5.5.1. China Viral Vectors & Plasmid DNA Manufacturing Market, 2016 – 2026(USD Million)
      6. 5.5.6. Japan
        1. 5.5.6.1. Japan Viral Vectors & Plasmid DNA Manufacturing Market, 2016 – 2026(USD Million)
      7. 5.5.7. India
        1. 5.5.7.1. India Viral Vectors & Plasmid DNA Manufacturing Market, 2016 – 2026(USD Million)
      8. 5.5.8. South Korea
        1. 5.5.8.1. South Korea Viral Vectors & Plasmid DNA Manufacturing Market, 2016 – 2026(USD Million)
      9. 5.5.9. South-East Asia
        1. 5.5.9.1. South-East Asia Viral Vectors & Plasmid DNA Manufacturing Market, 2016 – 2026(USD Million)
      10. 5.5.10. Rest of Asia Pacific
        1. 5.5.10.1. Rest of Asia Pacific Viral Vectors & Plasmid DNA Manufacturing Market, 2016 – 2026(USD Million)
    6. 5.6. Latin America
      1. 5.6.1. Latin America Viral Vectors & Plasmid DNA Manufacturing Market, 2016 – 2026(USD Million)
        1. 5.6.1.1. Latin America Viral Vectors & Plasmid DNA Manufacturing Market, by Country, 2016 - 2026(USD Million)
      2. 5.6.2. Latin America Viral Vectors & Plasmid DNA Manufacturing Market, by Product Type, 2016 – 2026
        1. 5.6.2.1. Latin America Viral Vectors & Plasmid DNA Manufacturing Market, by Product Type, 2016 – 2026(USD Million)
      3. 5.6.3. Latin America Viral Vectors & Plasmid DNA Manufacturing Market, by Application, 2016 – 2026
        1. 5.6.3.1. Latin America Viral Vectors & Plasmid DNA Manufacturing Market, by Application, 2016 – 2026(USD Million)
      4. 5.6.4. Latin America Viral Vectors & Plasmid DNA Manufacturing Market, by End-User, 2016 – 2026
        1. 5.6.4.1. Latin America Viral Vectors & Plasmid DNA Manufacturing Market, by End-User, 2016 – 2026(USD Million)
      5. 5.6.5. Brazil
        1. 5.6.5.1. Brazil Viral Vectors & Plasmid DNA Manufacturing Market, 2016 – 2026(USD Million)
      6. 5.6.6. Mexico
        1. 5.6.6.1. Mexico Viral Vectors & Plasmid DNA Manufacturing Market, 2016 – 2026(USD Million)
      7. 5.6.7. Rest of Latin America
        1. 5.6.7.1. Rest of Latin America Viral Vectors & Plasmid DNA Manufacturing Market, 2016 – 2026(USD Million)
    7. 5.7. The Middle-East and Africa
      1. 5.7.1. The Middle-East and Africa Viral Vectors & Plasmid DNA Manufacturing Market, 2016 – 2026(USD Million)
        1. 5.7.1.1. The Middle-East and Africa Viral Vectors & Plasmid DNA Manufacturing Market, by Country, 2016 - 2026(USD Million)
      2. 5.7.2. The Middle-East and Africa Viral Vectors & Plasmid DNA Manufacturing Market, by Product Type, 2016 – 2026
        1. 5.7.2.1. The Middle-East and Africa Viral Vectors & Plasmid DNA Manufacturing Market, by Product Type, 2016 – 2026(USD Million)
      3. 5.7.3. The Middle-East and Africa Viral Vectors & Plasmid DNA Manufacturing Market, by Application, 2016 – 2026
        1. 5.7.3.1. The Middle-East and Africa Viral Vectors & Plasmid DNA Manufacturing Market, by Application, 2016 – 2026(USD Million)
      4. 5.7.4. The Middle-East and Africa Viral Vectors & Plasmid DNA Manufacturing Market, by End-User, 2016 – 2026
        1. 5.7.4.1. The Middle-East and Africa Viral Vectors & Plasmid DNA Manufacturing Market, by End-User, 2016 – 2026(USD Million)
      5. 5.7.5. GCC Countries
        1. 5.7.5.1. GCC Countries Viral Vectors & Plasmid DNA Manufacturing Market, 2016 – 2026(USD Million)
      6. 5.7.6. South Africa
        1. 5.7.6.1. South Africa Viral Vectors & Plasmid DNA Manufacturing Market, 2016 – 2026(USD Million)
      7. 5.7.7. Rest of Middle-East Africa
        1. 5.7.7.1. Rest of Middle-East Africa Viral Vectors & Plasmid DNA Manufacturing Market, 2016 – 2026(USD Million)
  6. Chapter 6 Viral Vectors & Plasmid DNA Manufacturing Market – Competitive Landscape
    1. 6.1. Competitor Market Share – Revenue
    2. 6.2. Market Concentration Rate Analysis, Top 3 and Top 5 Players
    3. 6.3. Strategic Developments
      1. 6.3.1. Acquisitions and Mergers
      2. 6.3.2. New Products
      3. 6.3.3. Research & Development Activities
  7. Chapter 7 Company Profiles
    1. 7.1. Merck KGaA
      1. 7.1.1. Company Overview
      2. 7.1.2. Product/ServicePortfolio
      3. 7.1.3. Merck KGaA Sales, Revenue, and Gross Margin
      4. 7.1.4. Merck KGaA Revenue and Growth Rate
      5. 7.1.5. Merck KGaA Market Share
      6. 7.1.6. Recent Initiatives, Funding/VC Activities, and Technological Innovations
    2. 7.2. FUJIFILM Diosynth Biotechnologies
      1. 7.2.1. Company Overview
      2. 7.2.2. Product/ServicePortfolio
      3. 7.2.3. FUJIFILM Diosynth Biotechnologies Sales, Revenue, and Gross Margin
      4. 7.2.4. FUJIFILM Diosynth Biotechnologies Revenue and Growth Rate
      5. 7.2.5. FUJIFILM Diosynth Biotechnologies Market Share
      6. 7.2.6. Recent Initiatives, Funding/VC Activities, and Technological Innovations
    3. 7.3. Lonza
      1. 7.3.1. Company Overview
      2. 7.3.2. Product/ServicePortfolio
      3. 7.3.3. Lonza Sales, Revenue, and Gross Margin
      4. 7.3.4. Lonza Revenue and Growth Rate
      5. 7.3.5. Lonza Market Share
      6. 7.3.6. Recent Initiatives, Funding/VC Activities, and Technological Innovations
    4. 7.4. Thermo Fisher Scientific
      1. 7.4.1. Company Overview
      2. 7.4.2. Product/ServicePortfolio
      3. 7.4.3. Thermo Fisher Scientific Sales, Revenue, and Gross Margin
      4. 7.4.4. Thermo Fisher Scientific Revenue and Growth Rate
      5. 7.4.5. Thermo Fisher Scientific Market Share
      6. 7.4.6. Recent Initiatives, Funding/VC Activities, and Technological Innovations
    5. 7.5. Catalent Inc.
      1. 7.5.1. Company Overview
      2. 7.5.2. Product/ServicePortfolio
      3. 7.5.3. Catalent Inc. Sales, Revenue, and Gross Margin
      4. 7.5.4. Catalent Inc. Revenue and Growth Rate
      5. 7.5.5. Catalent Inc. Market Share
      6. 7.5.6. Recent Initiatives, Funding/VC Activities, and Technological Innovations
    6. 7.6. Cobra Biologics
      1. 7.6.1. Company Overview
      2. 7.6.2. Product/ServicePortfolio
      3. 7.6.3. Cobra Biologics Sales, Revenue, and Gross Margin
      4. 7.6.4. Cobra Biologics Revenue and Growth Rate
      5. 7.6.5. Cobra Biologics Market Share
      6. 7.6.6. Recent Initiatives, Funding/VC Activities, and Technological Innovations
    7. 7.7. Wuxi Biologics
      1. 7.7.1. Company Overview
      2. 7.7.2. Product/ServicePortfolio
      3. 7.7.3. Wuxi Biologics Sales, Revenue, and Gross Margin
      4. 7.7.4. Wuxi Biologics Revenue and Growth Rate
      5. 7.7.5. Wuxi Biologics Market Share
      6. 7.7.6. Recent Initiatives, Funding/VC Activities, and Technological Innovations
    8. 7.8. Waisman Biomanufacturing
      1. 7.8.1. Company Overview
      2. 7.8.2. Product/ServicePortfolio
      3. 7.8.3. Waisman Biomanufacturing Sales, Revenue, and Gross Margin
      4. 7.8.4. Waisman Biomanufacturing Revenue and Growth Rate
      5. 7.8.5. Waisman Biomanufacturing Market Share
      6. 7.8.6. Recent Initiatives, Funding/VC Activities, and Technological Innovations
    9. 7.9. Takara Bio Inc.
      1. 7.9.1. Company Overview
      2. 7.9.2. Product/ServicePortfolio
      3. 7.9.3. Takara Bio Inc. Sales, Revenue, and Gross Margin
      4. 7.9.4. Takara Bio Inc. Revenue and Growth Rate
      5. 7.9.5. Takara Bio Inc. Market Share
      6. 7.9.6. Recent Initiatives, Funding/VC Activities, and Technological Innovations
    10. 7.10. Genezen laboratories
      1. 7.10.1. Company Overview
      2. 7.10.2. Product/ServicePortfolio
      3. 7.10.3. Genezen laboratories Sales, Revenue, and Gross Margin
      4. 7.10.4. Genezen laboratories Revenue and Growth Rate
      5. 7.10.5. Genezen laboratories Market Share
      6. 7.10.6. Recent Initiatives, Funding/VC Activities, and Technological Innovations
    11. 7.11. Miltenyi Biotec GmbH
      1. 7.11.1. Company Overview
      2. 7.11.2. Product/ServicePortfolio
      3. 7.11.3. Miltenyi Biotec GmbH Sales, Revenue, and Gross Margin
      4. 7.11.4. Miltenyi Biotec GmbH Revenue and Growth Rate
      5. 7.11.5. Miltenyi Biotec GmbH Market Share
      6. 7.11.6. Recent Initiatives, Funding/VC Activities, and Technological Innovations
    12. 7.12. Batavia Biosciences
      1. 7.12.1. Company Overview
      2. 7.12.2. Product/ServicePortfolio
      3. 7.12.3. Batavia Biosciences Sales, Revenue, and Gross Margin
      4. 7.12.4. Batavia Biosciences Revenue and Growth Rate
      5. 7.12.5. Batavia Biosciences Market Share
      6. 7.12.6. Recent Initiatives, Funding/VC Activities, and Technological Innovations
    13. 7.13. SIRION Biotech GmbH
      1. 7.13.1. Company Overview
      2. 7.13.2. Product/ServicePortfolio
      3. 7.13.3. SIRION Biotech GmbH Sales, Revenue, and Gross Margin
      4. 7.13.4. SIRION Biotech GmbH Revenue and Growth Rate
      5. 7.13.5. SIRION Biotech GmbH Market Share
      6. 7.13.6. Recent Initiatives, Funding/VC Activities, and Technological Innovations
    14. 7.14. BioNTech IMFS GmbH
      1. 7.14.1. Company Overview
      2. 7.14.2. Product/ServicePortfolio
      3. 7.14.3. BioNTech IMFS GmbH Sales, Revenue, and Gross Margin
      4. 7.14.4. BioNTech IMFS GmbH Revenue and Growth Rate
      5. 7.14.5. BioNTech IMFS GmbH Market Share
      6. 7.14.6. Recent Initiatives, Funding/VC Activities, and Technological Innovations
    15. 7.15. Virovek Incorporation
      1. 7.15.1. Company Overview
      2. 7.15.2. Product/ServicePortfolio
      3. 7.15.3. Virovek Incorporation Sales, Revenue, and Gross Margin
      4. 7.15.4. Virovek Incorporation Revenue and Growth Rate
      5. 7.15.5. Virovek Incorporation Market Share
      6. 7.15.6. Recent Initiatives, Funding/VC Activities, and Technological Innovations
    16. 7.16. Audentes Therapeutics
      1. 7.16.1. Company Overview
      2. 7.16.2. Product/ServicePortfolio
      3. 7.16.3. Audentes Therapeutics Sales, Revenue, and Gross Margin
      4. 7.16.4. Audentes Therapeutics Revenue and Growth Rate
      5. 7.16.5. Audentes Therapeutics Market Share
      6. 7.16.6. Recent Initiatives, Funding/VC Activities, and Technological Innovations
    17. 7.17. RegenxBio Inc.
      1. 7.17.1. Company Overview
      2. 7.17.2. Product/ServicePortfolio
      3. 7.17.3. RegenxBio Inc. Sales, Revenue, and Gross Margin
      4. 7.17.4. RegenxBio Inc. Revenue and Growth Rate
      5. 7.17.5. RegenxBio Inc. Market Share
      6. 7.17.6. Recent Initiatives, Funding/VC Activities, and Technological Innovations
    18. 7.18. BioMarin Pharmaceutical
      1. 7.18.1. Company Overview
      2. 7.18.2. Product/ServicePortfolio
      3. 7.18.3. BioMarin Pharmaceutical Sales, Revenue, and Gross Margin
      4. 7.18.4. BioMarin Pharmaceutical Revenue and Growth Rate
      5. 7.18.5. BioMarin Pharmaceutical Market Share
      6. 7.18.6. Recent Initiatives, Funding/VC Activities, and Technological Innovations
    19. 7.19. YPOSKESI
      1. 7.19.1. Company Overview
      2. 7.19.2. Product/ServicePortfolio
      3. 7.19.3. YPOSKESI Sales, Revenue, and Gross Margin
      4. 7.19.4. YPOSKESI Revenue and Growth Rate
      5. 7.19.5. YPOSKESI Market Share
      6. 7.19.6. Recent Initiatives, Funding/VC Activities, and Technological Innovations
    20. 7.20. Advanced BioScience
      1. 7.20.1. Company Overview
      2. 7.20.2. Product/ServicePortfolio
      3. 7.20.3. Advanced BioScience Sales, Revenue, and Gross Margin
      4. 7.20.4. Advanced BioScience Revenue and Growth Rate
      5. 7.20.5. Advanced BioScience Market Share
      6. 7.20.6. Recent Initiatives, Funding/VC Activities, and Technological Innovations
  8. Chapter 8 Viral Vectors & Plasmid DNA Manufacturing — Industry Analysis
    1. 8.1. Introduction and Taxonomy
    2. 8.2. Viral Vectors & Plasmid DNA Manufacturing Market – Key Trends
      1. 8.2.1. Market Drivers
      2. 8.2.2. Market Restraints
      3. 8.2.3. Market Opportunities
    3. 8.3. Value Chain Analysis
    4. 8.4. Key Mandates and Regulations
    5. 8.5. Technology Roadmap and Timeline
    6. 8.6. Viral Vectors & Plasmid DNA Manufacturing Market – Attractiveness Analysis
      1. 8.6.1. By Product Type
      2. 8.6.2. By Application
      3. 8.6.3. By End-User
      4. 8.6.4. By Region
  9. Chapter 9 Industrial Chain, Sourcing Strategy, and Downstream Buyers
    1. 9.1. Viral Vectors & Plasmid DNA Manufacturing Industrial Chain Analysis
    2. 9.2. Downstream Buyers
    3. 9.3. Distributors/Traders List
  10. Chapter 10 Marketing Strategy Analysis
    1. 10.1. Marketing Channel
    2. 10.2. Direct Marketing
    3. 10.3. Indirect Marketing
    4. 10.4. Marketing Channel Development Trends
    5. 10.5. Economic/Political Environmental Change
  11. Chapter 11 Report Conclusion& Key Insights
    1. 11.1. Key Insights from Primary Interviews & Surveys Respondents
    2. 11.2. Key Takeaways from Analysts, Consultants, and Industry Leaders
  12. Chapter 12 Research Approach & Methodology
    1. 12.1. Report Description
    2. 12.2. Research Scope
    3. 12.3. Research Methodology
      1. 12.3.1. Secondary Research
      2. 12.3.2. Primary Research
      3. 12.3.3. Statistical Models
        1. 12.3.3.1. Company Share Analysis Model
        2. 12.3.3.2. Revenue Based Modeling
      4. 12.3.4. Research Limitations

      List of Figures

      Fig.1	Product Picture of  Viral Vectors & Plasmid DNA Manufacturing
      Fig.2	Global  Viral Vectors & Plasmid DNA Manufacturing  Market, 2016 – 2026(USD Million)
      Fig.3	Global  Viral Vectors & Plasmid DNA Manufacturing  MarketAbsolute Revenue Opportunity, 2016 – 2026(USD Million)
      Fig.4	Global  Viral Vectors & Plasmid DNA Manufacturing  MarketIncremental Revenue Opportunity, 2020 – 2026(USD Million)
      Fig.5	Global  Viral Vectors & Plasmid DNA Manufacturing  Market Share, by Product Type, 2020 & 2026(USD Million)
      Fig.6	Global Viral Vectors Viral Vectors & Plasmid DNA Manufacturing  Market, 2016 – 2026(USD Million)
      Fig.7	Global Plasma DNA Viral Vectors & Plasmid DNA Manufacturing  Market, 2016 – 2026(USD Million)
      Fig.8	Global Non-Viral DNA Vectors Viral Vectors & Plasmid DNA Manufacturing  Market, 2016 – 2026(USD Million)
      Fig.9	Global  Viral Vectors & Plasmid DNA Manufacturing  Market Share, by Application, 2020 & 2026(USD Million)
      Fig.10	Global Cancer Viral Vectors & Plasmid DNA Manufacturing  Market, 2016 – 2026(USD Million)
      Fig.11	Global Inherited Disorder Viral Vectors & Plasmid DNA Manufacturing  Market, 2016 – 2026(USD Million)
      Fig.12	Global Infectious Diseases Viral Vectors & Plasmid DNA Manufacturing  Market, 2016 – 2026(USD Million)
      Fig.13	Global Others Viral Vectors & Plasmid DNA Manufacturing  Market, 2016 – 2026(USD Million)
      Fig.14	Global  Viral Vectors & Plasmid DNA Manufacturing  Market Share, by End-User, 2020 & 2026(USD Million)
      Fig.15	Global DNA Vaccines Viral Vectors & Plasmid DNA Manufacturing  Market, 2016 – 2026(USD Million)
      Fig.16	Global Gene Therapy Viral Vectors & Plasmid DNA Manufacturing  Market, 2016 – 2026(USD Million)
      Fig.17	Global Immunotherapy Viral Vectors & Plasmid DNA Manufacturing  Market, 2016 – 2026(USD Million)
      Fig.18	Global Others Viral Vectors & Plasmid DNA Manufacturing  Market, 2016 – 2026(USD Million)
      Fig.19	Global  Viral Vectors & Plasmid DNA Manufacturing  MarketShare, by Region, 2020 & 2026(USD Million)
      Fig.20	North America Viral Vectors & Plasmid DNA Manufacturing  Market, 2016 – 2026(USD Million)
      Fig.21	U.S. Viral Vectors & Plasmid DNA Manufacturing  Market, 2016 – 2026(USD Million)
      Fig.22	Canada Viral Vectors & Plasmid DNA Manufacturing  Market, 2016 – 2026(USD Million)
      Fig.23	Europe Viral Vectors & Plasmid DNA Manufacturing  Market, 2016 – 2026(USD Million)
      Fig.24	Germany Viral Vectors & Plasmid DNA Manufacturing  Market, 2016 – 2026(USD Million)
      Fig.25	France Viral Vectors & Plasmid DNA Manufacturing  Market, 2016 – 2026(USD Million)
      Fig.26	U.K. Viral Vectors & Plasmid DNA Manufacturing  Market, 2016 – 2026(USD Million)
      Fig.27	Italy Viral Vectors & Plasmid DNA Manufacturing  Market, 2016 – 2026(USD Million)
      Fig.28	Spain Viral Vectors & Plasmid DNA Manufacturing  Market, 2016 – 2026(USD Million)
      Fig.29	Rest of Europe Viral Vectors & Plasmid DNA Manufacturing  Market, 2016 – 2026(USD Million)
      Fig.30	Asia Pacific Viral Vectors & Plasmid DNA Manufacturing  Market, 2016 – 2026(USD Million)
      Fig.31	China Viral Vectors & Plasmid DNA Manufacturing  Market, 2016 – 2026(USD Million)
      Fig.32	Japan Viral Vectors & Plasmid DNA Manufacturing  Market, 2016 – 2026(USD Million)
      Fig.33	India Viral Vectors & Plasmid DNA Manufacturing  Market, 2016 – 2026(USD Million)
      Fig.34	South  Korea Viral Vectors & Plasmid DNA Manufacturing  Market, 2016 – 2026(USD Million)
      Fig.35	South-East Asia Viral Vectors & Plasmid DNA Manufacturing  Market, 2016 – 2026(USD Million)
      Fig.36	Rest of Asia Pacific Viral Vectors & Plasmid DNA Manufacturing  Market, 2016 – 2026(USD Million)
      Fig.37	Latin America Viral Vectors & Plasmid DNA Manufacturing  Market, 2016 – 2026(USD Million)
      Fig.38	Brazil Viral Vectors & Plasmid DNA Manufacturing  Market, 2016 – 2026(USD Million)
      Fig.39	Mexico Viral Vectors & Plasmid DNA Manufacturing  Market, 2016 – 2026(USD Million)
      Fig.40	Rest of Latin America Viral Vectors & Plasmid DNA Manufacturing  Market, 2016 – 2026(USD Million)
      Fig.41	The Middle-East and Africa Viral Vectors & Plasmid DNA Manufacturing  Market, 2016 – 2026(USD Million)
      Fig.42	GCC Countries Viral Vectors & Plasmid DNA Manufacturing  Market, 2016 – 2026(USD Million)
      Fig.43	South Africa Viral Vectors & Plasmid DNA Manufacturing  Market, 2016 – 2026(USD Million)
      Fig.44	Rest of Middle-East Africa Viral Vectors & Plasmid DNA Manufacturing  Market, 2016 – 2026(USD Million)
      Fig.45	Competitor Market Share – Revenue
      Fig.46	Merck KGaA Revenue and Growth Rate
      Fig.47	Merck KGaA Market Share
      Fig.48	FUJIFILM Diosynth Biotechnologies Revenue and Growth Rate
      Fig.49	FUJIFILM Diosynth Biotechnologies Market Share
      Fig.50	Lonza Revenue and Growth Rate
      Fig.51	Lonza Market Share
      Fig.52	Thermo Fisher Scientific Revenue and Growth Rate
      Fig.53	Thermo Fisher Scientific Market Share
      Fig.54	Catalent Inc. Revenue and Growth Rate
      Fig.55	Catalent Inc. Market Share
      Fig.56	Cobra Biologics Revenue and Growth Rate
      Fig.57	Cobra Biologics Market Share
      Fig.58	Wuxi Biologics Revenue and Growth Rate
      Fig.59	Wuxi Biologics Market Share
      Fig.60	Waisman Biomanufacturing Revenue and Growth Rate
      Fig.61	Waisman Biomanufacturing Market Share
      Fig.62	Takara Bio Inc. Revenue and Growth Rate
      Fig.63	Takara Bio Inc. Market Share
      Fig.64	Genezen laboratories Revenue and Growth Rate
      Fig.65	Genezen laboratories Market Share
      Fig.66	Miltenyi Biotec GmbH Revenue and Growth Rate
      Fig.67	Miltenyi Biotec GmbH Market Share
      Fig.68	Batavia Biosciences Revenue and Growth Rate
      Fig.69	Batavia Biosciences Market Share
      Fig.70	SIRION Biotech GmbH Revenue and Growth Rate
      Fig.71	SIRION Biotech GmbH Market Share
      Fig.72	BioNTech IMFS GmbH Revenue and Growth Rate
      Fig.73	BioNTech IMFS GmbH Market Share
      Fig.74	Virovek Incorporation Revenue and Growth Rate
      Fig.75	Virovek Incorporation Market Share
      Fig.76	Audentes Therapeutics Revenue and Growth Rate
      Fig.77	Audentes Therapeutics Market Share
      Fig.78	RegenxBio Inc. Revenue and Growth Rate
      Fig.79	RegenxBio Inc. Market Share
      Fig.80	BioMarin Pharmaceutical Revenue and Growth Rate
      Fig.81	BioMarin Pharmaceutical Market Share
      Fig.82	YPOSKESI Revenue and Growth Rate
      Fig.83	YPOSKESI Market Share
      Fig.84	Advanced BioScience Revenue and Growth Rate
      Fig.85	Advanced BioScience Market Share
      Fig.86	Market Dynamics
      Fig.87	Global  Viral Vectors & Plasmid DNA Manufacturing  – Value Chain Analysis
      Fig.88	Key Mandates and Regulations
      Fig.89	Technology Roadmap and Timeline
      Fig.90	Market Attractiveness Analysis – By Product Type
      Fig.91	Market Attractiveness Analysis – By Application
      Fig.92	Market Attractiveness Analysis – By End-User
      Fig.93	Market Attractiveness Analysis – By Region
      Fig.94	Viral Vectors & Plasmid DNA Manufacturing  Industrial Chain Analysis
      Fig.95	Market Channels
      Fig.96	Marketing Channel Development Trend
      Fig.97	Growth in World Gross Product, 2008-2018
      

      List of Tables

      Table 1	Global  Viral Vectors & Plasmid DNA Manufacturing Market, 2020 & 2026(USD Million)
      Table 2	Global  Viral Vectors & Plasmid DNA Manufacturing Market, by Product Type, 2016 – 2026(USD Million)
      Table 3	Global  Viral Vectors & Plasmid DNA Manufacturing Market, by Application, 2016 – 2026(USD Million)
      Table 4	Global  Viral Vectors & Plasmid DNA Manufacturing Market, by End-User, 2016 – 2026(USD Million)
      Table 5	Global  Viral Vectors & Plasmid DNA Manufacturing Market, by Region, 2016 – 2026(USD Million)
      Table 6	North America Viral Vectors & Plasmid DNA Manufacturing  Market, by Country, 2016 – 2026(USD Million)
      Table 7	North America Viral Vectors & Plasmid DNA Manufacturing  Market, by Product Type, 2016 – 2026(USD Million)
      Table 8	North America Viral Vectors & Plasmid DNA Manufacturing  Market, by Application, 2016 – 2026(USD Million)
      Table 9	North America Viral Vectors & Plasmid DNA Manufacturing  Market, by End-User, 2016 – 2026(USD Million)
      Table 10 Europe Viral Vectors & Plasmid DNA Manufacturing  Market, by Country, 2016 – 2026(USD Million)
      Table 11 Europe Viral Vectors & Plasmid DNA Manufacturing  Market, by Product Type, 2016 – 2026(USD Million)
      Table 12 Europe Viral Vectors & Plasmid DNA Manufacturing  Market, by Application, 2016 – 2026(USD Million)
      Table 13 Europe Viral Vectors & Plasmid DNA Manufacturing  Market, by End-User, 2016 – 2026(USD Million)
      Table 14 Asia Pacific Viral Vectors & Plasmid DNA Manufacturing  Market, by Country, 2016 – 2026(USD Million)
      Table 15 Asia Pacific Viral Vectors & Plasmid DNA Manufacturing  Market, by Product Type, 2016 – 2026(USD Million)
      Table 16 Asia Pacific Viral Vectors & Plasmid DNA Manufacturing  Market, by Application, 2016 – 2026(USD Million)
      Table 17 Asia Pacific Viral Vectors & Plasmid DNA Manufacturing  Market, by End-User, 2016 – 2026(USD Million)
      Table 18 Latin America Viral Vectors & Plasmid DNA Manufacturing  Market, by Country, 2016 – 2026(USD Million)
      Table 19 Latin America Viral Vectors & Plasmid DNA Manufacturing  Market, by Product Type, 2016 – 2026(USD Million)
      Table 20 Latin America Viral Vectors & Plasmid DNA Manufacturing  Market, by Application, 2016 – 2026(USD Million)
      Table 21 Latin America Viral Vectors & Plasmid DNA Manufacturing  Market, by End-User, 2016 – 2026(USD Million)
      Table 22 The Middle-East and Africa Viral Vectors & Plasmid DNA Manufacturing  Market, by Country, 2016 – 2026(USD Million)
      Table 23 The Middle-East and Africa Viral Vectors & Plasmid DNA Manufacturing  Market, by Product Type, 2016 – 2026(USD Million)
      Table 24 The Middle-East and Africa Viral Vectors & Plasmid DNA Manufacturing  Market, by Application, 2016 – 2026(USD Million)
      Table 25 The Middle-East and Africa Viral Vectors & Plasmid DNA Manufacturing  Market, by End-User, 2016 – 2026(USD Million)
      Table 26 Global  Viral Vectors & Plasmid DNA Manufacturing  Market - Company Revenue Analysis, 2016 – 2019(USD Million)
      Table 27 Global  Viral Vectors & Plasmid DNA Manufacturing  Market - Company Revenue Share Analysis, 2016 – 2019(%)
      Table 28 Acquisitions and Mergers
      Table 29 Market Drivers – Impact Analysis
      Table 30 Market Restraints
      Table 31 Market Opportunities
      Table 32 Major Buyers of  Viral Vectors & Plasmid DNA Manufacturing
      Table 33 Distributors/Traders of  Viral Vectors & Plasmid DNA Manufacturing  by Region
      

Industry Major Market Players

  • Merck KGaA
  • FUJIFILM Diosynth Biotechnologies
  • Lonza
  • Thermo Fisher Scientific
  • Catalent Inc.
  • Cobra Biologics
  • Wuxi Biologics
  • WaismanBiomanufacturing
  • Takara Bio Inc.
  • Genezen laboratories
  • MiltenyiBiotec GmbH
  • Batavia Biosciences
  • SIRION Biotech GmbH
  • BioNTech IMFS GmbH
  • Virovek Incorporation
  • Audentes Therapeutics
  • RegenxBio Inc.
  • BioMarin Pharmaceutical
  • YPOSKESI
  • Advanced BioScience