Search Market Research Report

Discover Our Latest Reports
Discover Our Featured Reports
Discover Top Selling Reports

Video Conferencing Market Size, Share Global Analysis Report, 2020–2026

report img

Video Conferencing Market By Component (Hardware (Camera, Microphone & Headphone, Others), Software, Services (Professional, Managed)), By Deployment (On-Premise, Cloud-Based), By Enterprise (Large Enterprise, Small and Medium Enterprises) and By End User (Corporate, Education, Healthcare, Government & Defense, BFSI, Media & Entertainment, Others): Global Industry Outlook, Market Size, Business Intelligence, Consumer Preferences, Statistical Surveys, Comprehensive Analysis, Historical Developments, Current Trends, and Forecast 2020–2026

Industry Insights

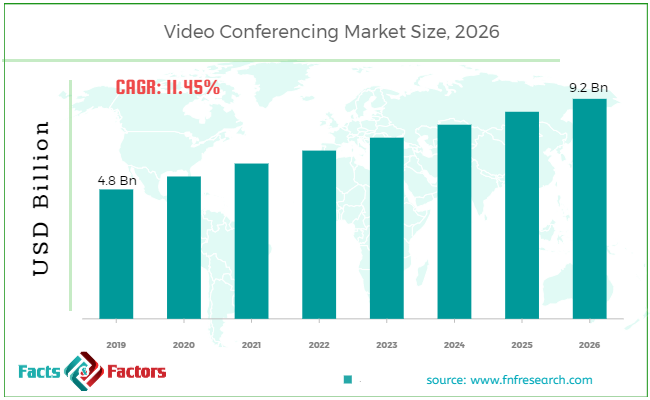
[225+ Pages Report] Global Video Conferencing Market in 2019 was approximately USD 4.8 Billion and is anticipated to reach over USD 9.2 Billion by 2026 and is expected to grow at a CAGR of 11.45% during the forecast period.

This specialized and expertise-oriented industry research report scrutinizes the technical and commercial business outlook of the Video Conferencing industry. The report analyzes and declares the historical and current trends analysis of the Video Conferencing industry and subsequently recommends the projected trends anticipated to be observed in the Video Conferencing market during the upcoming years.

Video Conferencing Market

To know more about this report | Request Free Sample Copy


logoKey Insights from Primary Research

  • Wide-ranging interviews with CXO’s of the major companies operating in the global video conferencing market, the analysis of the primary research concludes that the global video conferencing market to undergo an impressive growth of nearly 11.45% over the forecast period.
  • In the year 2019, the market was valued at approximately USD 4.8 Billion, in 2019 and is expected to be valued over USD 9.2 Billion by 2026.
  • On the basis of the component segmentation, the hardware segment is expected to dominate the global market share. SMEs are expected to create a major market pull in the coming years. The corporate sector is expected to generate significant revenue during the forecast period.
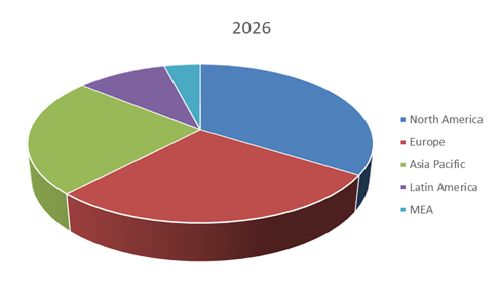
  • Asia Pacific region is expected to be the fastest-growing region for video conferencing over the forecast period. The North America region is expected to generate maximum revenue throughout the studied period.?

logoKey Recommendations from Analysts

  • Our analysts recommend increased focus towards the Asia Pacific region as it is expected to have a significant rise in demand for video conferencing solutions in the near future. The presence of rising economies and expanding IT, BFSI, and telecommunication sectors provide the immense potential for market growth in the region.
  • The strategic developments such as acquisitions and mergers, collaborations, and regional expansion by the major companies are likely to provide greater market opportunities for the global video conferencing manufacturers in up-coming years.
  • Our analysts recommend that the Asia Pacific region is predicted to witness a significant growth attributed to the growing demand for video conferencing from China, Japan, and India.
  • North America and the European region are expected to remain significant sources of revenue during the studied period. Regional dominance in these regions is expected to provide additional capital capabilities for expansion beyond the borders.

logoMarket Share Analysis by Region

Video Conferencing Market

To know more about this report | Request Free Sample Copy


The Video Conferencing market report analyzes and notifies the industry statistics at the global as well as regional and country levels in order to acquire a thorough perspective of the entire Video Conferencing market. The historical and past insights are provided for FY 2016 to FY 2019 whereas projected trends are delivered for FY 2020 to FY 2026. The quantitative and numerical data is represented in terms of value (USD Billion) from FY 2016 – 2026.

logoAccording to the research report, the global video conferencing market in 2019 was approximately USD 4.8Billion. The market is expected to grow above a CAGR of 11.45% and is anticipated to reach over USD 9.2 Billion by 2026.

The quantitative data is further underlined and reinforced by comprehensive qualitative data which comprises various across-the-board market dynamics. The rationales which directly or indirectly impact the Video Conferencing industry are exemplified through parameters such as growth drivers, restraints, challenges, and opportunities among other impacting factors.

Throughout our research report, we have encompassed all the proven models and tools of industry analysis and extensively illustrated all the key business strategies and business models adopted in the Video Conferencing industry. The report provides an all-inclusive and detailed competitive landscape prevalent in the Video Conferencing market.

The report utilizes established industry analysis tools and models such as Porter’s Five Forces framework to analyze and recognize critical business strategies adopted by various stakeholders involved in the entire value chain of the Video Conferencing industry. The Video Conferencing market report additionally employs SWOT analysis and PESTLE analysis models for further in-depth analysis.

The report study further includes an in-depth analysis of industry players' market shares and provides an overview of leading players' market position in the Video Conferencing sector. Key strategic developments in the Video Conferencing market competitive landscape such as acquisitions & mergers, inaugurations of different products and services, partnerships & joint ventures, MoU agreements, VC & funding activities, R&D activities, and geographic expansion among other noteworthy activities by key players of the Video Conferencing market are appropriately highlighted in the report.

The growing demand for video communication in line with the globalization of businesses is the primary driving factor for the global video conferencing market. Business units at a different location and workforce management are additional factors driving the demand for the video conferencing market.

The growing application of video conferencing in multiple aspects of corporates is expected to create future opportunities for the global video conferencing market.

The Video Conferencing market research report delivers an acute valuation and taxonomy of the Video Conferencing industry by practically splitting the market based on component, deployment type, enterprise, end-user and regions. Through the analysis of the historical and projected trends, all the segments and sub-segments were evaluated through the bottom-up approach, and different market sizes have been projected for FY 2020 to FY 2026. The regional segmentation of the Video Conferencing industry includes the complete classification of all the major continents including North America, Latin America, Europe, Asia Pacific, and the Middle East & Africa. Further, country-wise data for the Video Conferencing industry is provided for the leading economies of the world.

The Video Conferencing market is segmented based on component, deployment type, enterprise, end-user and region. On the basis of component segmentation, the market is classified into hardware (camera, microphone & headphone, others), software, serivces (professional, managed).On the basis of deployment segmentation, the market is segregated into on-premise and cloud-based. On the basis of enterprise segmentation, the market is segmented into large enterprise and small &medium enterprises. On the basis of end-user segmentation, the market is bifurcated into corporate, education, healthcare, government & defense, BFSI, media & entertainment, and others.

logoReport Scope

Report Attribute

Details

Market Size in 2019

USD 4.8 Billion

Projected Market Size in 2026

USD 9.2 Billion

CAGR Growth Rate

11.45% CAGR

Base Year

2019

Forecast Years

2020-2026

Key Market Players

8X8 Inc., Adobe Systems Inc., Arkadin, AT&T, Avaya Inc., BlueJeans Network, Cenero, Cisco Corporation, Citrix Systems Inc., Facebook, Fuze Inc., Google Inc., Highfive, Huawei Technologies Co. Ltd., KOLLECTIVE, Lifesize Inc., LogiTech, LogMeIn Inc., MediaPlatform, Microsoft Corporation, Panasonic, Pexip, Polycom (Plantronics), Premiere Global Services Inc., ReadyTalk, uStudio Inc., Vbrick, Vidyo Inc., Zoom Video Communication Inc., ZTE, and Others

Key Segment

By Component, Deployment, Enterprise, End User, and Region

Major Regions Covered

North America, Europe, Asia Pacific, Latin America, and the Middle East & Africa

Purchase Options

Request customized purchase options to meet your research needs.Explore purchase options

logoThe taxonomy of the Video Conferencing industry by its scope and segmentation is as follows:

logoTop Companies in the Industry:

  • 8X8 Inc.
  • Adobe Systems Inc.
  • Arkadin
  • AT&T
  • Avaya Inc.
  • BlueJeans Network
  • Cenero
  • Cisco Corporation
  • Citrix Systems Inc.
  • Facebook
  • Fuze Inc.
  • Google Inc.
  • Highfive
  • Huawei Technologies Co. Ltd.
  • KOLLECTIVE
  • Lifesize Inc.
  • LogiTech
  • LogMeIn Inc.
  • MediaPlatform
  • Microsoft Corporation
  • Panasonic
  • Pexip
  • Polycom (Plantronics)
  • Premiere Global Services Inc.
  • ReadyTalk
  • uStudio Inc.
  • Vbrick
  • Vidyo Inc.
  • Zoom Video Communication Inc.
  • ZTE


logo By Component Segmentation Analysis

  • Hardware
    • Camera
    • Microphone & Headphone
    • Others
  • Software
  • Services
    • Professional
    • Managed

logo By Deployment Segmentation Analysis

  • On-Premise
  • Cloud-Based

logo By Enterprise Segmentation Analysis

  • Large Enterprise
  • Small and Medium Enterprises

logo By End User Segmentation Analysis

  • Corporate
  • Education
  • Healthcare
  • Government &Defense
  • BFSI
  • Media & Entertainment
  • Others

logo Regional Segmentation Analysis

  • North America
    • The U.S.
    • Canada
  • Europe
    • Germany
    • The UK
    • France
    • Spain
    • Italy
    • Rest of Europe
  • Asia Pacific
    • China
    • Japan
    • India
    • South Korea
    • Southeast Asia
    • Rest of Asia Pacific
  • Latin America
    • Brazil
    • Mexico
    • Rest of Latin America
  • Middle East & Africa
    • GCC
    • South Africa
    • Rest of Middle East & Africa

Table of Content

  1. Chapter 1 Executive Summary
    1. 1.1. Introduction of Video Conferencing
    2. 1.2. Global Video Conferencing Market, 2019 & 2026 (USD Billion)
    3. 1.3. Global Video Conferencing Market, 2016 – 2026 (USD Billion)
    4. 1.4. Global Video Conferencing Market Absolute Revenue Opportunity, 2016 – 2026 (USD Billion)
    5. 1.5. Global Video Conferencing Market Incremental Revenue Opportunity, 2020 – 2026 (USD Billion)
  2. Chapter 2 Video Conferencing Market – Component Analysis
    1. 2.1. Global Video Conferencing Market – Component Overview
    2. 2.2. Global Video Conferencing Market Share, by Component , 2019 & 2026 (USD Billion)
    3. 2.3. Hardware
      1. 2.3.1. Global Hardware Video Conferencing Market, 2016 – 2026 (USD Billion)
    4. 2.4. Software
      1. 2.4.1. Global Software Video Conferencing Market, 2016 – 2026 (USD Billion)
    5. 2.5. Serivces
      1. 2.5.1. Global Serivces Video Conferencing Market, 2016 – 2026 (USD Billion)
  3. Chapter 3 Video Conferencing Market – Deployment Analysis
    1. 3.1. Global Video Conferencing Market – Deployment Overview
    2. 3.2. Global Video Conferencing Market Share, by Deployment, 2019 & 2026 (USD Billion)
    3. 3.3. On-Premise
      1. 3.3.1. Global On-Premise Video Conferencing Market, 2016 – 2026 (USD Billion)
    4. 3.4. Cloud-Based
      1. 3.4.1. Global Cloud-Based Video Conferencing Market, 2016 – 2026 (USD Billion)
  4. Chapter 4 Video Conferencing Market – Enterprise Analysis
    1. 4.1. Global Video Conferencing Market – Enterprise Overview
    2. 4.2. Global Video Conferencing Market Share, by Enterprise, 2019 & 2026 (USD Billion)
    3. 4.3. Large Enterprise
      1. 4.3.1. Global Large Enterprise Video Conferencing Market, 2016 – 2026 (USD Billion)
    4. 4.4. Small and Medium Enterprises),
      1. 4.4.1. Global Small and Medium Enterprises), Video Conferencing Market, 2016 – 2026 (USD Billion)
  5. Chapter 5 Video Conferencing Market – End User Analysis
    1. 5.1. Global Video Conferencing Market – End User Overview
    2. 5.2. Global Video Conferencing Market Share, by End User, 2019 & 2026 (USD Billion)
    3. 5.3. Corporate
      1. 5.3.1. Global Corporate Video Conferencing Market, 2016 – 2026 (USD Billion)
    4. 5.4. Education
      1. 5.4.1. Global Education Video Conferencing Market, 2016 – 2026 (USD Billion)
    5. 5.5. Healthcare
      1. 5.5.1. Global Healthcare Video Conferencing Market, 2016 – 2026 (USD Billion)
    6. 5.6. Government & Defense
      1. 5.6.1. Global Government & Defense Video Conferencing Market, 2016 – 2026 (USD Billion)
    7. 5.7. BFSI
      1. 5.7.1. Global BFSI Video Conferencing Market, 2016 – 2026 (USD Billion)
    8. 5.8. Media & Entertainment
      1. 5.8.1. Global Media & Entertainment Video Conferencing Market, 2016 – 2026 (USD Billion)
    9. 5.9. Others
      1. 5.9.1. Global Others Video Conferencing Market, 2016 – 2026 (USD Billion)
  6. Chapter 6 Video Conferencing Market – Regional Analysis
    1. 6.1. Global Video Conferencing Market Regional Overview
    2. 6.2. Global Video Conferencing Market Share, by Region, 2019 & 2026 (USD Billion)
    3. 6.3. North America
      1. 6.3.1. North America Video Conferencing Market, 2016 – 2026 (USD Billion)
        1. 6.3.1.1. North America Video Conferencing Market, by Country, 2016 - 2026 (USD Billion)
      2. 6.3.2. North America Video Conferencing Market, by Component , 2016 – 2026
        1. 6.3.2.1. North America Video Conferencing Market, by Component , 2016 – 2026 (USD Billion)
      3. 6.3.3. North America Video Conferencing Market, by Deployment, 2016 – 2026
        1. 6.3.3.1. North America Video Conferencing Market, by Deployment, 2016 – 2026 (USD Billion)
      4. 6.3.4. North America Video Conferencing Market, by Enterprise, 2016 – 2026
        1. 6.3.4.1. North America Video Conferencing Market, by Enterprise, 2016 – 2026 (USD Billion)
      5. 6.3.5. North America Video Conferencing Market, by End User, 2016 – 2026
        1. 6.3.5.1. North America Video Conferencing Market, by End User, 2016 – 2026 (USD Billion)
          1. 6.3.6. U.S.
            1. 6.3.6.1. U.S. Video Conferencing Market, 2016 – 2026 (USD Billion)
      6. 6.3.7. Canada
        1. 6.3.7.1. Canada Video Conferencing Market, 2016 – 2026 (USD Billion)
    4. 6.4. Europe
      1. 6.4.1. Europe Video Conferencing Market, 2016 – 2026 (USD Billion)
        1. 6.4.1.1. Europe Video Conferencing Market, by Country, 2016 - 2026 (USD Billion)
      2. 6.4.2. Europe Video Conferencing Market, by Component , 2016 – 2026
        1. 6.4.2.1. Europe Video Conferencing Market, by Component , 2016 – 2026 (USD Billion)
      3. 6.4.3. Europe Video Conferencing Market, by Deployment, 2016 – 2026
        1. 6.4.3.1. Europe Video Conferencing Market, by Deployment, 2016 – 2026 (USD Billion)
      4. 6.4.4. Europe Video Conferencing Market, by Enterprise, 2016 – 2026
        1. 6.4.4.1. Europe Video Conferencing Market, by Enterprise, 2016 – 2026 (USD Billion)
      5. 6.4.5. Europe Video Conferencing Market, by End User, 2016 – 2026
        1. 6.4.5.1. Europe Video Conferencing Market, by End User, 2016 – 2026 (USD Billion)
      6. 6.4.6. Germany
        1. 6.4.6.1. Germany Video Conferencing Market, 2016 – 2026 (USD Billion)
      7. 6.4.7. France
        1. 6.4.7.1. France Video Conferencing Market, 2016 – 2026 (USD Billion)
          1. 6.4.8. U.K.
            1. 6.4.8.1. U.K. Video Conferencing Market, 2016 – 2026 (USD Billion)
      8. 6.4.9. Italy
        1. 6.4.9.1. Italy Video Conferencing Market, 2016 – 2026 (USD Billion)
      9. 6.4.10. Spain
        1. 6.4.10.1. Spain Video Conferencing Market, 2016 – 2026 (USD Billion)
      10. 6.4.11. Rest of Europe
        1. 6.4.11.1. Rest of Europe Video Conferencing Market, 2016 – 2026 (USD Billion)
    5. 6.5. Asia Pacific
      1. 6.5.1. Asia Pacific Video Conferencing Market, 2016 – 2026 (USD Billion)
        1. 6.5.1.1. Asia Pacific Video Conferencing Market, by Country, 2016 - 2026 (USD Billion)
      2. 6.5.2. Asia Pacific Video Conferencing Market, by Component , 2016 – 2026
        1. 6.5.2.1. Asia Pacific Video Conferencing Market, by Component , 2016 – 2026 (USD Billion)
      3. 6.5.3. Asia Pacific Video Conferencing Market, by Deployment, 2016 – 2026
        1. 6.5.3.1. Asia Pacific Video Conferencing Market, by Deployment, 2016 – 2026 (USD Billion)
      4. 6.5.4. Asia Pacific Video Conferencing Market, by Enterprise, 2016 – 2026
        1. 6.5.4.1. Asia Pacific Video Conferencing Market, by Enterprise, 2016 – 2026 (USD Billion)
      5. 6.5.5. Asia Pacific Video Conferencing Market, by End User, 2016 – 2026
        1. 6.5.5.1. Asia Pacific Video Conferencing Market, by End User, 2016 – 2026 (USD Billion)
      6. 6.5.6. China
        1. 6.5.6.1. China Video Conferencing Market, 2016 – 2026 (USD Billion)
      7. 6.5.7. Japan
        1. 6.5.7.1. Japan Video Conferencing Market, 2016 – 2026 (USD Billion)
      8. 6.5.8. India
        1. 6.5.8.1. India Video Conferencing Market, 2016 – 2026 (USD Billion)
      9. 6.5.9. South Korea
        1. 6.5.9.1. South Korea Video Conferencing Market, 2016 – 2026 (USD Billion)
      10. 6.5.10. South-East Asia
        1. 6.5.10.1. South-East Asia Video Conferencing Market, 2016 – 2026 (USD Billion)
      11. 6.5.11. Rest of Asia Pacific
        1. 6.5.11.1. Rest of Asia Pacific Video Conferencing Market, 2016 – 2026 (USD Billion)
    6. 6.6. Latin America
      1. 6.6.1. Latin America Video Conferencing Market, 2016 – 2026 (USD Billion)
        1. 6.6.1.1. Latin America Video Conferencing Market, by Country, 2016 - 2026 (USD Billion)
      2. 6.6.2. Latin America Video Conferencing Market, by Component , 2016 – 2026
        1. 6.6.2.1. Latin America Video Conferencing Market, by Component , 2016 – 2026 (USD Billion)
      3. 6.6.3. Latin America Video Conferencing Market, by Deployment, 2016 – 2026
        1. 6.6.3.1. Latin America Video Conferencing Market, by Deployment, 2016 – 2026 (USD Billion)
      4. 6.6.4. Latin America Video Conferencing Market, by Enterprise, 2016 – 2026
        1. 6.6.4.1. Latin America Video Conferencing Market, by Enterprise, 2016 – 2026 (USD Billion)
      5. 6.6.5. Latin America Video Conferencing Market, by End User, 2016 – 2026
        1. 6.6.5.1. Latin America Video Conferencing Market, by End User, 2016 – 2026 (USD Billion)
      6. 6.6.6. Brazil
        1. 6.6.6.1. Brazil Video Conferencing Market, 2016 – 2026 (USD Billion)
      7. 6.6.7. Mexico
        1. 6.6.7.1. Mexico Video Conferencing Market, 2016 – 2026 (USD Billion)
      8. 6.6.8. Rest of Latin America
        1. 6.6.8.1. Rest of Latin America Video Conferencing Market, 2016 – 2026 (USD Billion)
    7. 6.7. The Middle-East and Africa
      1. 6.7.1. The Middle-East and Africa Video Conferencing Market, 2016 – 2026 (USD Billion)
        1. 6.7.1.1. The Middle-East and Africa Video Conferencing Market, by Country, 2016 - 2026 (USD Billion)
      2. 6.7.2. The Middle-East and Africa Video Conferencing Market, by Component , 2016 – 2026
        1. 6.7.2.1. The Middle-East and Africa Video Conferencing Market, by Component , 2016 – 2026 (USD Billion)
      3. 6.7.3. The Middle-East and Africa Video Conferencing Market, by Deployment, 2016 – 2026
        1. 6.7.3.1. The Middle-East and Africa Video Conferencing Market, by Deployment, 2016 – 2026 (USD Billion)
      4. 6.7.4. The Middle-East and Africa Video Conferencing Market, by Enterprise, 2016 – 2026
        1. 6.7.4.1. The Middle-East and Africa Video Conferencing Market, by Enterprise, 2016 – 2026 (USD Billion)
      5. 6.7.5. The Middle-East and Africa Video Conferencing Market, by End User, 2016 – 2026
        1. 6.7.5.1. The Middle-East and Africa Video Conferencing Market, by End User, 2016 – 2026 (USD Billion)
      6. 6.7.6. GCC Countries
        1. 6.7.6.1. GCC Countries Video Conferencing Market, 2016 – 2026 (USD Billion)
      7. 6.7.7. South Africa
        1. 6.7.7.1. South Africa Video Conferencing Market, 2016 – 2026 (USD Billion)
      8. 6.7.8. Rest of Middle-East Africa
        1. 6.7.8.1. Rest of Middle-East Africa Video Conferencing Market, 2016 – 2026 (USD Billion)
  7. Chapter 7 Video Conferencing Market – Competitive Landscape
    1. 7.1. Competitor Market Share – Revenue
    2. 7.2. Market Concentration Rate Analysis, Top 3 and Top 5 Players
    3. 7.3. Strategic Developments
      1. 7.3.1. Acquisitions and Mergers
      2. 7.3.2. New Products
      3. 7.3.3. Research & Development Activities
  8. Chapter 8 Company Profiles
    1. 8.1. Cisco Systems, Inc.
      1. 8.1.1. Company Overview
      2. 8.1.2. Product/Service Portfolio
      3. 8.1.3. Cisco Systems, Inc. Sales, Revenue, and Gross Margin
      4. 8.1.4. Cisco Systems, Inc. Revenue and Growth Rate
      5. 8.1.5. Cisco Systems, Inc. Market Share
      6. 8.1.6. Recent Initiatives, Funding/VC Activities, and Technological Innovations
    2. 8.2. Array Telepresence Inc.
      1. 8.2.1. Company Overview
      2. 8.2.2. Product/Service Portfolio
      3. 8.2.3. Array Telepresence Inc. Sales, Revenue, and Gross Margin
      4. 8.2.4. Array Telepresence Inc. Revenue and Growth Rate
      5. 8.2.5. Array Telepresence Inc. Market Share
      6. 8.2.6. Recent Initiatives, Funding/VC Activities, and Technological Innovations
    3. 8.3. Huawei Technologies Co., Ltd.
      1. 8.3.1. Company Overview
      2. 8.3.2. Product/Service Portfolio
      3. 8.3.3. Huawei Technologies Co., Ltd. Sales, Revenue, and Gross Margin
      4. 8.3.4. Huawei Technologies Co., Ltd. Revenue and Growth Rate
      5. 8.3.5. Huawei Technologies Co., Ltd. Market Share
      6. 8.3.6. Recent Initiatives, Funding/VC Activities, and Technological Innovations
    4. 8.4. Avaya Inc.
      1. 8.4.1. Company Overview
      2. 8.4.2. Product/Service Portfolio
      3. 8.4.3. Avaya Inc. Sales, Revenue, and Gross Margin
      4. 8.4.4. Avaya Inc. Revenue and Growth Rate
      5. 8.4.5. Avaya Inc. Market Share
      6. 8.4.6. Recent Initiatives, Funding/VC Activities, and Technological Innovations
    5. 8.5. Logitech International S.A.
      1. 8.5.1. Company Overview
      2. 8.5.2. Product/Service Portfolio
      3. 8.5.3. Logitech International S.A. Sales, Revenue, and Gross Margin
      4. 8.5.4. Logitech International S.A. Revenue and Growth Rate
      5. 8.5.5. Logitech International S.A. Market Share
      6. 8.5.6. Recent Initiatives, Funding/VC Activities, and Technological Innovations
    6. 8.6. Adobe Inc.
      1. 8.6.1. Company Overview
      2. 8.6.2. Product/Service Portfolio
      3. 8.6.3. Adobe Inc. Sales, Revenue, and Gross Margin
      4. 8.6.4. Adobe Inc. Revenue and Growth Rate
      5. 8.6.5. Adobe Inc. Market Share
      6. 8.6.6. Recent Initiatives, Funding/VC Activities, and Technological Innovations
    7. 8.7. Microsoft Corporation
      1. 8.7.1. Company Overview
      2. 8.7.2. Product/Service Portfolio
      3. 8.7.3. Microsoft Corporation Sales, Revenue, and Gross Margin
      4. 8.7.4. Microsoft Corporation Revenue and Growth Rate
      5. 8.7.5. Microsoft Corporation Market Share
      6. 8.7.6. Recent Initiatives, Funding/VC Activities, and Technological Innovations
    8. 8.8. Vidyo Inc.
      1. 8.8.1. Company Overview
      2. 8.8.2. Product/Service Portfolio
      3. 8.8.3. Vidyo Inc. Sales, Revenue, and Gross Margin
      4. 8.8.4. Vidyo Inc. Revenue and Growth Rate
      5. 8.8.5. Vidyo Inc. Market Share
      6. 8.8.6. Recent Initiatives, Funding/VC Activities, and Technological Innovations
    9. 8.9. Plantronics, Inc.
      1. 8.9.1. Company Overview
      2. 8.9.2. Product/Service Portfolio
      3. 8.9.3. Plantronics, Inc. Sales, Revenue, and Gross Margin
      4. 8.9.4. Plantronics, Inc. Revenue and Growth Rate
      5. 8.9.5. Plantronics, Inc. Market Share
      6. 8.9.6. Recent Initiatives, Funding/VC Activities, and Technological Innovations
    10. 8.10. West Corporation
      1. 8.10.1. Company Overview
      2. 8.10.2. Product/Service Portfolio
      3. 8.10.3. West Corporation Sales, Revenue, and Gross Margin
      4. 8.10.4. West Corporation Revenue and Growth Rate
      5. 8.10.5. West Corporation Market Share
      6. 8.10.6. Recent Initiatives, Funding/VC Activities, and Technological Innovations
  9. Chapter 9 Video Conferencing — Industry Analysis
    1. 9.1. Introduction and Taxonomy
    2. 9.2. Video Conferencing Market – Key Trends
      1. 9.2.1. Market Drivers
      2. 9.2.2. Market Restraints
      3. 9.2.3. Market Opportunities
    3. 9.3. Value Chain Analysis
    4. 9.4. Key Mandates and Regulations
    5. 9.5. Technology Roadmap and Timeline
    6. 9.6. Video Conferencing Market – Attractiveness Analysis
      1. 9.6.1. By Component
      2. 9.6.2. By Deployment
      3. 9.6.3. By Enterprise
      4. 9.6.4. By End User
      5. 9.6.5. By Region
  10. Chapter 10 Industrial Chain, Sourcing Strategy, and Downstream Buyers
    1. 10.1. Video Conferencing Industrial Chain Analysis
    2. 10.2. Downstream Buyers
    3. 10.3. Distributors/Traders List
  11. Chapter 11 Marketing Strategy Analysis
    1. 11.1. Marketing Channel
    2. 11.2. Direct Marketing
    3. 11.3. Indirect Marketing
    4. 11.4. Marketing Channel Development Trends
    5. 11.5. Economic/Political Environmental Change
  12. Chapter 12 Report Conclusion & Key Insights
    1. 12.1. Key Insights from Primary Interviews & Surveys Respondents
    2. 12.2. Key Takeaways from Analysts, Consultants, and Industry Leaders
  13. Chapter 13 Research Approach & Methodology
    1. 13.1. Report Description
    2. 13.2. Research Scope
    3. 13.3. Research Methodology
      1. 13.3.1. Secondary Research
      2. 13.3.2. Primary Research
      3. 13.3.3. Statistical Models
        1. 13.3.3.1. Company Share Analysis Model
        2. 13.3.3.2. Revenue Based Modeling
      4. 13.3.4. Research Limitations

      List of Figures

      Fig.1 Product Picture of Video Conferencing
      Fig.2 Global Video Conferencing Market, 2016 – 2026 (USD Billion)
      Fig.3 Global Video Conferencing Market Absolute Revenue Opportunity, 2016 – 2026 (USD Billion)
      Fig.4 Global Video Conferencing Market Incremental Revenue Opportunity, 2020 – 2026 (USD Billion)
      Fig.5 Global Video Conferencing Market Share, by Component , 2019 & 2026 (USD Billion)
      Fig.6 Global Hardware Video Conferencing Market, 2016 – 2026 (USD Billion)
      Fig.7 Global Software Video Conferencing Market, 2016 – 2026 (USD Billion)
      Fig.8 Global Serivces Video Conferencing Market, 2016 – 2026 (USD Billion)
      Fig.9 Global Video Conferencing Market Share, by Deployment, 2019 & 2026 (USD Billion)
      Fig.10 Global On-Premise  Video Conferencing Market, 2016 – 2026 (USD Billion)
      Fig.11 Global Cloud-Based Video Conferencing Market, 2016 – 2026 (USD Billion)
      Fig.12 Global Video Conferencing Market Share, by Enterprise, 2019 & 2026 (USD Billion)
      Fig.13 Global Large Enterprise Video Conferencing Market, 2016 – 2026 (USD Billion)
      Fig.14 Global Small and Medium Enterprises),  Video Conferencing Market, 2016 – 2026 (USD Billion)
      Fig.15 Global Video Conferencing Market Share, by End User, 2019 & 2026 (USD Billion)
      Fig.16 Global Corporate Video Conferencing Market, 2016 – 2026 (USD Billion)
      Fig.17 Global Education Video Conferencing Market, 2016 – 2026 (USD Billion)
      Fig.18 Global Healthcare Video Conferencing Market, 2016 – 2026 (USD Billion)
      Fig.19 Global Government & Defense Video Conferencing Market, 2016 – 2026 (USD Billion)
      Fig.20 Global BFSI Video Conferencing Market, 2016 – 2026 (USD Billion)
      Fig.21 Global Media & Entertainment Video Conferencing Market, 2016 – 2026 (USD Billion)
      Fig.22 Global Others Video Conferencing Market, 2016 – 2026 (USD Billion)
      Fig.23 Global Video Conferencing Market Share, by Region, 2019 & 2026 (USD Billion)
      Fig.24 North America Video Conferencing Market, 2016 – 2026 (USD Billion)
      Fig.25 U.S. Video Conferencing Market, 2016 – 2026 (USD Billion)
      Fig.26 Canada Video Conferencing Market, 2016 – 2026 (USD Billion)
      Fig.27 Europe Video Conferencing Market, 2016 – 2026 (USD Billion)
      Fig.28 Germany Video Conferencing Market, 2016 – 2026 (USD Billion)
      Fig.29 France Video Conferencing Market, 2016 – 2026 (USD Billion)
      Fig.30 U.K. Video Conferencing Market, 2016 – 2026 (USD Billion)
      Fig.31 Italy Video Conferencing Market, 2016 – 2026 (USD Billion)
      Fig.32 Spain Video Conferencing Market, 2016 – 2026 (USD Billion)
      Fig.33 Rest of Europe Video Conferencing Market, 2016 – 2026 (USD Billion)
      Fig.34 Asia Pacific Video Conferencing Market, 2016 – 2026 (USD Billion)
      Fig.35 China Video Conferencing Market, 2016 – 2026 (USD Billion)
      Fig.36 Japan Video Conferencing Market, 2016 – 2026 (USD Billion)
      Fig.37 India Video Conferencing Market, 2016 – 2026 (USD Billion)
      Fig.38 South  Korea Video Conferencing Market, 2016 – 2026 (USD Billion)
      Fig.39 South-East Asia Video Conferencing Market, 2016 – 2026 (USD Billion)
      Fig.40 Rest of Asia Pacific Video Conferencing Market, 2016 – 2026 (USD Billion)
      Fig.41 Latin America Video Conferencing Market, 2016 – 2026 (USD Billion)
      Fig.42 Brazil Video Conferencing Market, 2016 – 2026 (USD Billion)
      Fig.43 Mexico Video Conferencing Market, 2016 – 2026 (USD Billion)
      Fig.44 Rest of Latin America Video Conferencing Market, 2016 – 2026 (USD Billion)
      Fig.45 The Middle-East and Africa Video Conferencing Market, 2016 – 2026 (USD Billion)
      Fig.46 GCC Countries Video Conferencing Market, 2016 – 2026 (USD Billion)
      Fig.47 South Africa Video Conferencing Market, 2016 – 2026 (USD Billion)
      Fig.48 Rest of Middle-East Africa Video Conferencing Market, 2016 – 2026 (USD Billion)
      Fig.49 Competitor Market Share – Revenue
      Fig.50 Cisco Systems, Inc. Revenue and Growth Rate
      Fig.51 Cisco Systems, Inc. Market Share
      Fig.52 Array Telepresence Inc. Revenue and Growth Rate
      Fig.53 Array Telepresence Inc. Market Share
      Fig.54 Huawei Technologies Co., Ltd. Revenue and Growth Rate
      Fig.55 Huawei Technologies Co., Ltd. Market Share
      Fig.56 Avaya Inc. Revenue and Growth Rate
      Fig.57 Avaya Inc. Market Share
      Fig.58 Logitech International S.A. Revenue and Growth Rate
      Fig.59 Logitech International S.A. Market Share
      Fig.60 Adobe Inc. Revenue and Growth Rate
      Fig.61 Adobe Inc. Market Share
      Fig.62 Microsoft Corporation Revenue and Growth Rate
      Fig.63 Microsoft Corporation Market Share
      Fig.64 Vidyo Inc. Revenue and Growth Rate
      Fig.65 Vidyo Inc. Market Share
      Fig.66 Plantronics, Inc. Revenue and Growth Rate
      Fig.67 Plantronics, Inc. Market Share
      Fig.68 West Corporation Revenue and Growth Rate
      Fig.69 West Corporation Market Share
      Fig.70 Market Dynamics
      Fig.71 Global Video Conferencing – Value Chain Analysis
      Fig.72 Key Mandates and Regulations
      Fig.73 Technology Roadmap and Timeline
      Fig.74 Market Attractiveness Analysis – By Component
      Fig.75 Market Attractiveness Analysis – By Deployment
      Fig.76 Market Attractiveness Analysis – By Enterprise
      Fig.77 Market Attractiveness Analysis – By End User
      Fig.78 Market Attractiveness Analysis – By Region
      Fig.79 Video Conferencing Industrial Chain Analysis
      Fig.80 Market Channels
      Fig.81 Marketing Channel Development Trend
      Fig.82 Growth in World Gross Product, 2008-2018
      

      List of Tables

      Table 1 Global Video Conferencing Market, 2019 & 2026 (USD Billion)
      Table 2 Global Video Conferencing Market, by Component , 2016 – 2026 (USD Billion)
      Table 3 Global Video Conferencing Market, by Deployment, 2016 – 2026 (USD Billion)
      Table 4 Global Video Conferencing Market, by Enterprise, 2016 – 2026 (USD Billion)
      Table 5 Global Video Conferencing Market, by End User, 2016 – 2026 (USD Billion)
      Table 6 Global Video Conferencing Market, by Region, 2016 – 2026 (USD Billion)
      Table 7 North America Video Conferencing Market, by Country, 2016 – 2026 (USD Billion)
      Table 8 North America Video Conferencing Market, by Component , 2016 – 2026 (USD Billion)
      Table 9 North America Video Conferencing Market, by Deployment, 2016 – 2026 (USD Billion)
      Table 10 North America Video Conferencing Market, by Enterprise, 2016 – 2026 (USD Billion)
      Table 11 North America Video Conferencing Market, by End User, 2016 – 2026 (USD Billion)
      Table 12 Europe Video Conferencing Market, by Country, 2016 – 2026 (USD Billion)
      Table 13 Europe Video Conferencing Market, by Component , 2016 – 2026 (USD Billion)
      Table 14 Europe Video Conferencing Market, by Deployment, 2016 – 2026 (USD Billion)
      Table 15 Europe Video Conferencing Market, by Enterprise, 2016 – 2026 (USD Billion)
      Table 16 Europe Video Conferencing Market, by End User, 2016 – 2026 (USD Billion)
      Table 17 Asia Pacific Video Conferencing Market, by Country, 2016 – 2026 (USD Billion)
      Table 18 Asia Pacific Video Conferencing Market, by Component , 2016 – 2026 (USD Billion)
      Table 19 Asia Pacific Video Conferencing Market, by Deployment, 2016 – 2026 (USD Billion)
      Table 20 Asia Pacific Video Conferencing Market, by Enterprise, 2016 – 2026 (USD Billion)
      Table 21 Asia Pacific Video Conferencing Market, by End User, 2016 – 2026 (USD Billion)
      Table 22 Latin America Video Conferencing Market, by Country, 2016 – 2026 (USD Billion)
      Table 23 Latin America Video Conferencing Market, by Component , 2016 – 2026 (USD Billion)
      Table 24 Latin America Video Conferencing Market, by Deployment, 2016 – 2026 (USD Billion)
      Table 25 Latin America Video Conferencing Market, by Enterprise, 2016 – 2026 (USD Billion)
      Table 26 Latin America Video Conferencing Market, by End User, 2016 – 2026 (USD Billion)
      Table 27 The Middle-East and Africa Video Conferencing Market, by Country, 2016 – 2026 (USD Billion)
      Table 28 The Middle-East and Africa Video Conferencing Market, by Component , 2016 – 2026 (USD Billion)
      Table 29 The Middle-East and Africa Video Conferencing Market, by Deployment, 2016 – 2026 (USD Billion)
      Table 30 The Middle-East and Africa Video Conferencing Market, by Enterprise, 2016 – 2026 (USD Billion)
      Table 31 The Middle-East and Africa Video Conferencing Market, by End User, 2016 – 2026 (USD Billion)
      Table 32 Global Video Conferencing Market - Company Revenue Analysis, 2016 – 2019 (USD Billion)
      Table 33 Global Video Conferencing Market - Company Revenue Share Analysis, 2016 – 2019 (%)
      Table 34 Acquisitions and Mergers
      Table 35 Market Drivers – Impact Analysis
      Table 36 Market Restraints
      Table 37 Market Opportunities
      Table 38 Major Buyers of Video Conferencing
      Table 39 Distributors/Traders of Video Conferencing by Region
      

Industry Major Market Players

  • 8X8 Inc.
  • Adobe Systems Inc.
  • Arkadin
  • AT&T
  • Avaya Inc.
  • BlueJeans Network
  • Cenero
  • Cisco Corporation
  • Citrix Systems Inc.
  • Facebook
  • Fuze Inc.
  • Google Inc.
  • Highfive
  • Huawei Technologies Co. Ltd.
  • KOLLECTIVE
  • Lifesize Inc.
  • LogiTech
  • LogMeIn Inc.
  • MediaPlatform
  • Microsoft Corporation
  • Panasonic
  • Pexip
  • Polycom (Plantronics)
  • Premiere Global Services Inc.
  • ReadyTalk
  • uStudio Inc.
  • Vbrick
  • Vidyo Inc.
  • Zoom Video Communication Inc.
  • ZTE