![]()
Search Market Research Report
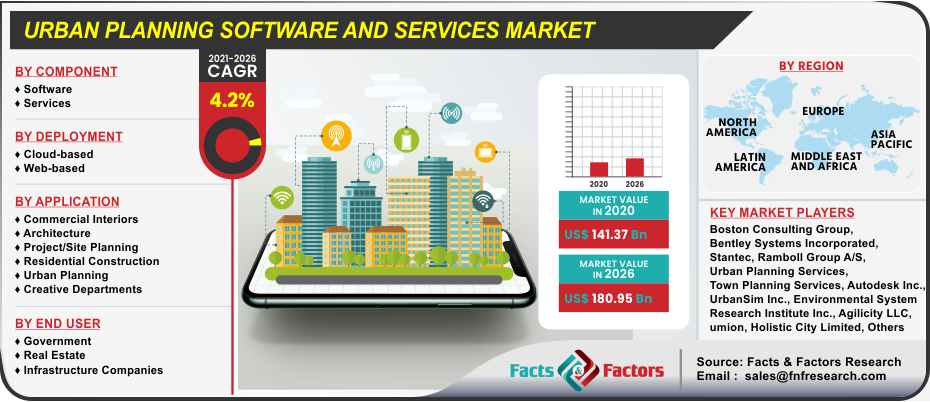
Urban Planning Software and Services Market Size, Share Global Analysis Report, ning Software and Services Market by Component (Software, and Services), By Deployment (Cloud-based, and Web-based), By Application (Commercial Interiors, Architecture, Project/Site Planning, Residential Construction, Urban Planning, and Creative Departments), By End User (Government, Real Estate, and Infrastructure Companies): Global Industry Perspective, Comprehensive Analysis, and Forecast, 2020 – 2026

Urban Planning Software and Services Market by Component (Software, and Services), By Deployment (Cloud-based, and Web-based), By Application (Commercial Interiors, Architecture, Project/Site Planning, Residential Construction, Urban Planning, and Creative Departments), By End User (Government, Real Estate, and Infrastructure Companies): Global Industry Perspective, Comprehensive Analysis, and Forecast, 2020 – 2026
Industry Insights
As per the report published by Facts and Factors, the global demand for the urban planning software and services market was valued at approximately USD 141.37 billion in 2020 and is expected to grow around USD 180.95 billion by 2026 to register a CAGR growth of around 4.2% between 2021 and 2026.
 Market Overview
To plan urban layouts and create 3D models of urban surroundings, urban planning, and design software are required. To visualize how their urban plans might seem in the actual world, city planners and architects employ urban planning and design software. Urban planners can improve their urban planning and design urban layouts by creating 3D visualizations. City planners, architects, and creative departments among others involved in developing the layout of an urban environment frequently employ urban planning and design software. Users can use GIS software to automatically import structures that already exist in the real world into their urban planning program. This saves users time and helps urban planners to design around an urban environment's current infrastructure.
Industry Growth Factors
Companies in the urban planning software & services market are focusing more on smart city efforts in healthcare, waste management, and intelligent mobility to improve quality of life. Urban planners with strong problem-solving skills are pursuing opportunities as independent contractors and in government organizations and private businesses.
Smart city services are evolving as a result of digitization. However, it has been discovered that the majority of digital transformation projects fail. To offer innovations in smart city services, enterprises should experiment with new technology and challenge traditional business models, such as eliminating necessary paper forms and non-digital interactions.
Segmentation Analysis
The urban planning software and services market is segmented into component, deployment, application, and end user. Based on the Component, the market has been sub-segmented into software, and services. In terms of Deployment, the market is segmented into cloud-based, and web-based. The application has been classified into commercial interiors, architecture, project/site planning, residential construction, urban planning, and creative departments. The end user is bifurcated into government, real estate, and infrastructure companies.
Report Scope
Report Attribute |
Details |
Market Size in 2020 |
USD 141.37 Billion |
Projected Market Size in 2026 |
USD 180.95 Billion |
CAGR Growth Rate |
4.2% CAGR |
Base Year |
2020 |
Forecast Years |
2021-2026 |
Key Market Players |
Boston Consulting Group, Bentley Systems Incorporated, Stantec, Ramboll Group A/S, Urban Planning Services, Town Planning Services, Autodesk Inc., UrbanSim Inc., Environmental System Research Institute Inc., Agilicity LLC, Lumion, Holistic City Limited, and Others |
Key Segment |
By Component, By Deployment, By Application, By End User, and By Region |
Major Regions Covered |
North America, Europe, Asia Pacific, Latin America, and the Middle East & Africa |
Purchase Options |
Request customized purchase options to meet your research needs. Explore purchase options |
Regional Analysis
The market was dominated by the Asia Pacific, which is expected to grow at the fastest CAGR over the forecast period. Market expansion in the region is being driven by factors such as ongoing smart city initiatives and expanding industrialization. For example, the Association of Southeast Asian Nations (ASEAN) is actively working on over 26 smart city projects. India and Japan announced their collaboration on smart city development in January 2017. Japan will aid India in the building of three smart cities, namely Chennai, Ahmedabad, and Varanasi, as part of this partnership. Furthermore, India's entire "Smart City Mission" investment allocation has been increased to USD 28.3 billion by 2020.
Competitive Players
Some main participants of the global urban planning software and services market are
- Boston Consulting Group
- Bentley Systems Incorporated
- Stantec
- Ramboll Group A/S
- Urban Planning Services
- Town Planning Services
- Autodesk Inc.
- UrbanSim Inc.
- Environmental System Research Institute Inc.
- Agilicity LLC
- Lumion
- Holistic City Limited
- SketchUp
- SimWalk
- Urban Footprint
By Component Segment Analysis
- Software
- Services
By Deployment Segment Analysis
- Cloud-based
- Web-based
By Application Segment Analysis
- Commercial Interiors
- Architecture
- Project/Site Planning
- Residential Construction
- Urban Planning
- Creative Departments
By End User Segment Analysis
- Government
- Real Estate
- Infrastructure Companies
Regional Segment Analysis
- North America
- U.S.
- Canada
- Europe
- UK
- France
- Germany
- Italy
- Spain
- Rest of Europe
- Asia Pacific
- China
- Japan
- India
- South Korea
- Southeast Asia
- Rest of Asia Pacific
- Latin America
- Brazil
- Mexico
- Rest of Latin America
- Middle East and Africa
- GCC Countries
- South Africa
- Rest of MEA
Table of Content
Industry Major Market Players
- Boston Consulting Group
- Bentley Systems Incorporated
- Stantec
- Ramboll Group A/S
- Urban Planning Services
- Town Planning Services
- Autodesk Inc.
- UrbanSim Inc.
- Environmental System Research Institute Inc.
- Agilicity LLC
- Lumion
- Holistic City Limited
- SketchUp
- SimWalk
- Urban Footprint


Copyright © 2025 - 2026, All Rights Reserved, Facts and Factors