Search Market Research Report

Discover Our Latest Reports
Discover Our Featured Reports
Discover Top Selling Reports

Upstream Bioprocessing Market Size, Share Global Analysis Report, 2020–2026

report img

Upstream Bioprocessing Market By Product (Cell Culture Products, Bioreactors/Fermenters, Filters, Bags & Containers, Bioreactors Accessories and Others); by Workflow (Cell Culture, Media Preparation, and Cell Separation); by Mode (Outsourced and In-house) and Regionsand Regions: Global Industry Outlook, Market Size, Business Intelligence, Consumer Preferences, Statistical Surveys, Comprehensive Analysis, Historical Developments, Current Trends, and Forecast 2020–2026

Industry Insights

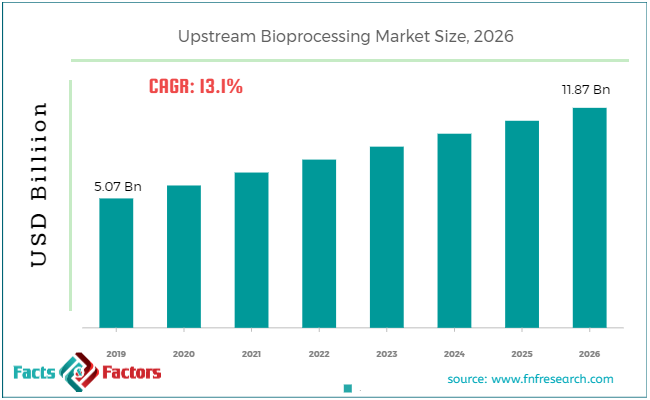
According to the report published by Facts & Factors, the global Upstream Bioprocessing market size was worth around USD 5.07 million in 2019 and is predicted to grow around USD 11.87 billion by 2026 with a compound annual growth rate (CAGR) of roughly 13.1% between 2020 and 2026. The report analyzes the global Upstream Bioprocessing market drivers, restraints/challenges, and the effect they have on the demands during the projection period. In addition, the report explores emerging opportunities in the Upstream Bioprocessing market.

The upstream bioprocessing market report analyzes and notifies the industry statistics at the global as well as regional and country levels in order to acquire a thorough perspective of the entire upstream bioprocessing market. The historical and past insights are provided for FY 2016 to FY 2019 whereas projected trends are delivered for FY 2020 to FY 2026. The quantitative and numerical data is represented in terms of both volume (Units) and value (USD Million) from FY 2016 – 2026.

This specialized and expertise-oriented industry research report scrutinizes the technical and commercial business outlook of the upstream bioprocessing industry. The report analyzes and declares the historical and current trends analysis of the upstream bioprocessing industry and subsequently recommends the projected trends anticipated to be observed in the upstream bioprocessing market during the upcoming years.

Upstream Bioprocessing Market Size

To know more about this report | Request Free Sample Copy

logoKey Insights from Primary Research

  • As per our primary respondents, the global upstream bioprocessing market is set to grow annually at a rate of around 13.1%
  • It was established through primary research that the global upstream bioprocessing  market was valued at around 5 USD billion in 2019
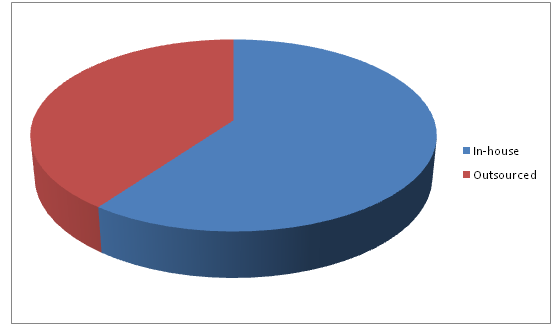
  • The “In-house” category, on the basis of mode segmentation, is expected to dominate in terms of revenue, over the forecast period
  • Based on the region, North America is expected to account for the revenue share in 2019 in the target market

logoKey Recommendations from Analysts

  • As per our analysts, global upstream bioprocessing is growing at a high CAGR and various end-use industries are aware of this potential market and applications of upstream bioprocessing
  • Growing at a CAGR of around 13.1%, the global upstream bioprocessing market provides numerous opportunities for all of the involved stakeholders across the entire value chain
  • Our analysts have identified-house are dominating segment for the global upstream bioprocessing market in terms of mode segmentation

logoMarket Share – By Mode

Upstream Bioprocessing Market

To know more about this report | Request Free Sample Copy


The quantitative data is further underlined and reinforced by comprehensive qualitative data which comprises various across-the-board market dynamics. The rationales which directly or indirectly impact the upstream bioprocessing industry are exemplified through parameters such as growth drivers, restraints, challenges, and opportunities among other impacting factors.

Throughout our research report, we have encompassed all the proven models and tools of industry analysis and extensively illustrated all the key business strategies and business models adopted in the upstream bioprocessing industry. The report provides an all-inclusive and detailed competitive landscape prevalent in the upstream bioprocessing market.

The report utilizes established industry analysis tools and models such as Porter’s Five Forces framework to analyze and recognize critical business strategies adopted by various stakeholders the upstream bioprocessing involved in the entire value chain of the upstream bioprocessing industry. The market report additionally employs SWOT analysis and PESTLE analysis models for further in-depth analysis.

The report study further includes an in-depth analysis of industry players' market shares and provides an overview of leading players' market position in the upstream bioprocessing sector. Key strategic developments in the upstream bioprocessing market competitive landscape such as acquisitions & mergers, inaugurations of different products and services, partnerships & joint ventures, MoU agreements, VC & funding activities, R&D activities, and geographic expansion among other noteworthy activities by key players of the upstream bioprocessing market are appropriately highlighted in the report.

The upstream bioprocessing market research report delivers an acute valuation and taxonomy of the upstream bioprocessing industry by practically splitting the market on the basis of different products, workflow, modes, and regions. Through the analysis of the historical and projected trends, all the segments and sub-segments were evaluated through the bottom-up approach, and different market sizes have been projected for FY 2020 to FY 2026.

The regional segmentation of the upstream bioprocessing industry includes the complete classification of all the major continents including North America, Latin America, Europe, Asia Pacific, and the Middle East & Africa. Further, country-wise data for the upstream bioprocessing industry is provided for the leading economies of the world.

Increasing research and development in the field of biosimilars and biomolecules is a major factor to drive the growth of the global market. The prevalence of chronic diseases is increasing across the globe which is expected to propel the growth of the global market in the near future.

However, high costs associated with the processing are expected to hamper target market growth in the near future. The global upstream bioprocessing market has been segmented on the basis of product, workflow, and mode.

logoReport Scope

Report Attribute

Details

Market Size in 2019

USD 5.07 Billion

Projected Market Size in 2026

USD 11.87 Billion

CAGR Growth Rate

13.1% CAGR

Base Year

2019

Forecast Years

2020-2026

Key Market Players

Thermo Fisher Scientific, Samsung BioLogics, PBS Biotech Inc., GE Healthcare, Merck KGaA, Sartorius AG, Eppendorf AG, Applikon Biotechnology, JM BIOCONNECT, Corning Inc., BoehringerIngelheim, CellGenix GmbH, Lonza, Patheon, CMC Biologics, and Danaher Corporation. and others.

Key Segment

By Product, Workflow, Mode, and Region

Major Regions Covered

North America, Europe, Asia Pacific, Latin America, and the Middle East &, Africa

Purchase Options

Request customized purchase options to meet your research needs. Explore purchase options

Based on the product the target market is classified as Bioreactors Accessories, Cell Culture Products, Bioreactors/Fermenters, Bags & Containers, Filters, and Others. Based on the workflow segment the global market can be bifurcated into Cell Culture, Media Preparation, and Cell Separation. The mode segment is classified as outsourced and In-house. The In-house mode segment is expected to account for the largest market share in terms of revenue over the forecast period. Which outsourced segment is expected to grow at a significant rate during the forecasted year in the upstream bioprocessing industry?

The taxonomy of the Upstream Bioprocessing Market by its scope and segmentation is as follows:

logoCompetitive Players

  • Thermo Fisher Scientific
  •  Samsung BioLogics
  •  PBS Biotech Inc.
  •  GE Healthcare
  •  Merck KGaA
  •  Sartorius AG
  •  Eppendorf AG
  • Applikon Biotechnology
  • JM BIOCONNECT
  • Corning Inc.,
  • BoehringerIngelheim
  • CellGenix GmbH
  • Lonza
  • Patheon
  • CMC Biologics
  • Danaher Corporation

logoGlobal Upstream Bioprocessing Market: By Product Segmentation Analysis (Customizable)

  • Bioreactors/Fermenters
  • Cell Culture Products
  • Filters
  • Bioreactors Accessories
  • Bags & Containers
  • Others

logoGlobal Upstream Bioprocessing Market: By Workflow Segmentation Analysis (Customizable)

  • Media Preparation
  • Cell Culture
  • Cell Separation

logoGlobal Upstream Bioprocessing Market: By Mode Segmentation Analysis (Customizable)

  • In-house
  • Outsourced

logo Regional Segmentation Analysis (Customizable)

  • North America
    • The U.S.
    • Canada
  • Europe
    • Germany
    • The UK
    • France
    • Spain
    • Italy
    • Rest of Europe
  • Asia Pacific
    • China
    • Japan
    • India
    • South Korea
    • Southeast Asia
    • Rest of Asia Pacific
  • Latin America
    • Brazil
    • Mexico
    • Rest of Latin America
  • Middle East & Africa
    • GCC
    • South Africa
    • Rest of the Middle East & Africa

Table of Content

  1. CHAPTER 1. Executive Summary
  2. CHAPTER 2. Upstream Bioprocessing market – Product Analysis
    1. 2.1. Global Upstream Bioprocessing Market – Product Overview
    2. 2.2. Global Upstream Bioprocessing Market Share, by Product , 2018 & 2025 (USD Million)
    3. 2.3. Bioreactors/Fermenters
      1. 2.3.1. Global Bioreactors/Fermenters Upstream Bioprocessing Market, 2016-2026 (USD Million)
    4. 2.4. Cell Culture Products
      1. 2.4.1. Global Cell Culture Products Upstream Bioprocessing Market, 2016-2026 (USD Million)
    5. 2.5. Filters
      1. 2.5.1. Global Filters Upstream Bioprocessing Market, 2016-2026 (USD Million)
    6. 2.6. Bioreactors Accessories
      1. 2.6.1. Global Bioreactors Accessories Upstream Bioprocessing Market, 2016-2026 (USD Million)
    7. 2.7. Bags & Containers
      1. 2.7.1. Global Bags & Containers Upstream Bioprocessing Market, 2016-2026 (USD Million)
    8. 2.8. Others
      1. 2.8.1. Global Others Upstream Bioprocessing Market, 2016-2026 (USD Million)
  3. CHAPTER 3. Upstream Bioprocessing market – Workflow Analysis
    1. 3.1. Global Upstream Bioprocessing Market – Workflow Overview
    2. 3.2. Global Upstream Bioprocessing Market Share, by Workflow , 2018 & 2025 (USD Million)
    3. 3.3. Media Preparation
      1. 3.3.1. Global Media Preparation Upstream Bioprocessing Market, 2016-2026 (USD Million)
    4. 3.4. Cell Culture
      1. 3.4.1. Global Cell Culture Upstream Bioprocessing Market, 2016-2026 (USD Million)
    5. 3.5. Cell Separation
      1. 3.5.1. Global Cell Separation Upstream Bioprocessing Market, 2016-2026 (USD Million)
  4. CHAPTER 4. Upstream Bioprocessing market – Mode Analysis
    1. 4.1. Global Upstream Bioprocessing Market – Mode Overview
    2. 4.2. Global Upstream Bioprocessing Market Share, by Mode , 2018 & 2025 (USD Million)
    3. 4.3. In-house
      1. 4.3.1. Global In-house Upstream Bioprocessing Market, 2016-2026 (USD Million)
    4. 4.4. Outsourced
      1. 4.4.1. Global Outsourced Upstream Bioprocessing Market, 2016-2026 (USD Million)
  5. CHAPTER 5. Upstream Bioprocessing market – Regional Analysis
    1. 5.1. Global Upstream Bioprocessing Market Regional Overview
    2. 5.2. Global Upstream Bioprocessing Market Share, by Region, 2018 & 2025 (Value)
    3. 5.3. North America
      1. 5.3.1. North America Upstream Bioprocessing Market size and forecast, 2016-2026
      2. 5.3.2. North America Upstream Bioprocessing Market, by Country, 2018 & 2025 (USD Million)
      3. 5.3.3. North America Upstream Bioprocessing Market, by Product , 2016-2026
        1. 5.3.3.1. North America Upstream Bioprocessing Market, by Product , 2016-2026 (USD Million)
      4. 5.3.4. North America Upstream Bioprocessing Market, by Workflow , 2016-2026
        1. 5.3.4.1. North America Upstream Bioprocessing Market, by Workflow , 2016-2026 (USD Million)
      5. 5.3.5. North America Upstream Bioprocessing Market, by Mode , 2016-2026
        1. 5.3.5.1. North America Upstream Bioprocessing Market, by Mode , 2016-2026 (USD Million)
      6. 5.3.6. U.S.
        1. 5.3.6.1. U.S. Market size and forecast, 2016-2026 (USD Million)
      7. 5.3.7. Canada
        1. 5.3.7.1. Canada Market size and forecast, 2016-2026 (USD Million)
    4. 5.4. Europe
      1. 5.4.1. Europe Upstream Bioprocessing Market size and forecast, 2016-2026
      2. 5.4.2. Europe Upstream Bioprocessing Market, by Country, 2018 & 2025 (USD Million)
      3. 5.4.3. Europe Upstream Bioprocessing Market, by Product , 2016-2026
        1. 5.4.3.1. Europe Upstream Bioprocessing Market, by Product , 2016-2026 (USD Million)
      4. 5.4.4. Europe Upstream Bioprocessing Market, by Workflow , 2016-2026
        1. 5.4.4.1. Europe Upstream Bioprocessing Market, by Workflow , 2016-2026 (USD Million)
      5. 5.4.5. Europe Upstream Bioprocessing Market, by Mode , 2016-2026
        1. 5.4.5.1. Europe Upstream Bioprocessing Market, by Mode , 2016-2026 (USD Million)
      6. 5.4.6. Germany
        1. 5.4.6.1. Germany Market size and forecast, 2016-2026 (USD Million)
      7. 5.4.7. France
        1. 5.4.7.1. France Market size and forecast, 2016-2026 (USD Million)
      8. 5.4.8. U.K.
        1. 5.4.8.1. U.K. Market size and forecast, 2016-2026 (USD Million)
      9. 5.4.9. Italy
        1. 5.4.9.1. Italy Market size and forecast, 2016-2026 (USD Million)
      10. 5.4.10. Spain
        1. 5.4.10.1. Spain Market size and forecast, 2016-2026 (USD Million)
      11. 5.4.11. Rest of Europe
        1. 5.4.11.1. Rest of Europe Market size and forecast, 2016-2026 (USD Million)
    5. 5.5. Asia Pacific
      1. 5.5.1. Asia Pacific Upstream Bioprocessing Market size and forecast, 2016-2026
      2. 5.5.2. Asia Pacific Upstream Bioprocessing Market, by Country, 2018 & 2025 (USD Million)
      3. 5.5.3. Asia Pacific Upstream Bioprocessing Market, by Product , 2016-2026
        1. 5.5.3.1. Asia Pacific Upstream Bioprocessing Market, by Product , 2016-2026 (USD Million)
      4. 5.5.4. Asia Pacific Upstream Bioprocessing Market, by Workflow , 2016-2026
        1. 5.5.4.1. Asia Pacific Upstream Bioprocessing Market, by Workflow , 2016-2026 (USD Million)
      5. 5.5.5. Asia Pacific Upstream Bioprocessing Market, by Mode , 2016-2026
        1. 5.5.5.1. Asia Pacific Upstream Bioprocessing Market, by Mode , 2016-2026 (USD Million)
      6. 5.5.6. China
        1. 5.5.6.1. China Market size and forecast, 2016-2026 (USD Million)
      7. 5.5.7. Japan
        1. 5.5.7.1. Japan Market size and forecast, 2016-2026 (USD Million)
      8. 5.5.8. India
        1. 5.5.8.1. India Market size and forecast, 2016-2026 (USD Million)
      9. 5.5.9. South Korea
        1. 5.5.9.1. South Korea Market size and forecast, 2016-2026 (USD Million)
      10. 5.5.10. South-East Asia
        1. 5.5.10.1. South-East Asia Market size and forecast, 2016-2026 (USD Million)
      11. 5.5.11. Rest of Asia Pacific
        1. 5.5.11.1. Rest of Asia Pacific Market size and forecast, 2016-2026 (USD Million)
    6. 5.6. Latin America
      1. 5.6.1. Latin America Upstream Bioprocessing Market size and forecast, 2016-2026
      2. 5.6.2. Latin America Upstream Bioprocessing Market, by Country, 2018 & 2025 (USD Million)
      3. 5.6.3. Latin America Upstream Bioprocessing Market, by Product , 2016-2026
        1. 5.6.3.1. Latin America Upstream Bioprocessing Market, by Product , 2016-2026 (USD Million)
      4. 5.6.4. Latin America Upstream Bioprocessing Market, by Workflow , 2016-2026
        1. 5.6.4.1. Latin America Upstream Bioprocessing Market, by Workflow , 2016-2026 (USD Million)
      5. 5.6.5. Latin America Upstream Bioprocessing Market, by Mode , 2016-2026
        1. 5.6.5.1. Latin America Upstream Bioprocessing Market, by Mode , 2016-2026 (USD Million)
      6. 5.6.6. Brazil
        1. 5.6.6.1. Brazil Market size and forecast, 2016-2026 (USD Million)
      7. 5.6.7. Mexico
        1. 5.6.7.1. Mexico Market size and forecast, 2016-2026 (USD Million)
      8. 5.6.8. Rest of Latin America
        1. 5.6.8.1. Rest of Latin America Market size and forecast, 2016-2026 (USD Million)
    7. 5.7. The Middle-East and Africa
      1. 5.7.1. The Middle-East and Africa Upstream Bioprocessing Market size and forecast, 2016-2026
      2. 5.7.2. The Middle-East and Africa Upstream Bioprocessing Market, by Country, 2018 & 2025 (USD Million)
      3. 5.7.3. The Middle-East and Africa Upstream Bioprocessing Market, by Product , 2016-2026
        1. 5.7.3.1. The Middle-East and Africa Upstream Bioprocessing Market, by Product , 2016-2026 (USD Million)
      4. 5.7.4. The Middle-East and Africa Upstream Bioprocessing Market, by Workflow , 2016-2026
        1. 5.7.4.1. The Middle-East and Africa Upstream Bioprocessing Market, by Workflow , 2016-2026 (USD Million)
      5. 5.7.5. The Middle-East and Africa Upstream Bioprocessing Market, by Mode , 2016-2026
        1. 5.7.5.1. The Middle-East and Africa Upstream Bioprocessing Market, by Mode , 2016-2026 (USD Million)
      6. 5.7.6. GCC Countries
        1. 5.7.6.1. GCC Countries Market size and forecast, 2016-2026 (USD Million)
      7. 5.7.7. South Africa
        1. 5.7.7.1. South Africa Market size and forecast, 2016-2026 (USD Million)
      8. 5.7.8. Rest of Middle-East Africa
        1. 5.7.8.1. Rest of Middle-East Africa Market size and forecast, 2016-2026 (USD Million)
  6. CHAPTER 6. Upstream Bioprocessing market – Competitive Landscape
    1. 6.1. Competitor Market Share – Revenue
    2. 6.2. Market Concentration Rate Analysis, Top 3 and Top 5 Players
    3. 6.3. Strategic Development
      1. 6.3.1. Acquisitions and Mergers
      2. 6.3.2. New Products
      3. 6.3.3. Research & Development Activities
  7. CHAPTER 7. Company Profiles
    1. 7.1. Thermo Fisher Scientific
      1. 7.1.1. Company Overview
      2. 7.1.2. Thermo Fisher Scientific Revenue and Gross Margin
      3. 7.1.3. Product portfolio
      4. 7.1.4. Recent initiatives
    2. 7.2. Samsung BioLogics
      1. 7.2.1. Company Overview
      2. 7.2.2. Samsung BioLogics Revenue and Gross Margin
      3. 7.2.3. Product portfolio
      4. 7.2.4. Recent initiatives
    3. 7.3. PBS Biotech, Inc.
      1. 7.3.1. Company Overview
      2. 7.3.2. PBS Biotech, Inc. Revenue and Gross Margin
      3. 7.3.3. Product portfolio
      4. 7.3.4. Recent initiatives
    4. 7.4. GE Healthcare
      1. 7.4.1. Company Overview
      2. 7.4.2. GE Healthcare Revenue and Gross Margin
      3. 7.4.3. Product portfolio
      4. 7.4.4. Recent initiatives
    5. 7.5. Merck KGaA
      1. 7.5.1. Company Overview
      2. 7.5.2. Merck KGaA Revenue and Gross Margin
      3. 7.5.3. Product portfolio
      4. 7.5.4. Recent initiatives
    6. 7.6. Sartorius AG
      1. 7.6.1. Company Overview
      2. 7.6.2. Sartorius AG Revenue and Gross Margin
      3. 7.6.3. Product portfolio
      4. 7.6.4. Recent initiatives
    7. 7.7. Eppendorf AG
      1. 7.7.1. Company Overview
      2. 7.7.2. Eppendorf AG Revenue and Gross Margin
      3. 7.7.3. Product portfolio
      4. 7.7.4. Recent initiatives
    8. 7.8. Applikon Biotechnology
      1. 7.8.1. Company Overview
      2. 7.8.2. Applikon Biotechnology Revenue and Gross Margin
      3. 7.8.3. Product portfolio
      4. 7.8.4. Recent initiatives
    9. 7.9. JM BIOCONNECT
      1. 7.9.1. Company Overview
      2. 7.9.2. JM BIOCONNECT Revenue and Gross Margin
      3. 7.9.3. Product portfolio
      4. 7.9.4. Recent initiatives
    10. 7.10. Corning, Inc.
      1. 7.10.1. Company Overview
      2. 7.10.2. Corning, Inc. Revenue and Gross Margin
      3. 7.10.3. Product portfolio
      4. 7.10.4. Recent initiatives
    11. 7.11. Boehringer Ingelheim
      1. 7.11.1. Company Overview
      2. 7.11.2. Boehringer Ingelheim Revenue and Gross Margin
      3. 7.11.3. Product portfolio
      4. 7.11.4. Recent initiatives
    12. 7.12. CellGenix GmbH
      1. 7.12.1. Company Overview
      2. 7.12.2. CellGenix GmbH Revenue and Gross Margin
      3. 7.12.3. Product portfolio
      4. 7.12.4. Recent initiatives
    13. 7.13. Lonza
      1. 7.13.1. Company Overview
      2. 7.13.2. Lonza Revenue and Gross Margin
      3. 7.13.3. Product portfolio
      4. 7.13.4. Recent initiatives
    14. 7.14. Patheon
      1. 7.14.1. Company Overview
      2. 7.14.2. Patheon Revenue and Gross Margin
      3. 7.14.3. Product portfolio
      4. 7.14.4. Recent initiatives
    15. 7.15. CMC Biologics
      1. 7.15.1. Company Overview
      2. 7.15.2. CMC Biologics Revenue and Gross Margin
      3. 7.15.3. Product portfolio
      4. 7.15.4. Recent initiatives
    16. 7.16. Danaher Corporation
      1. 7.16.1. Company Overview
      2. 7.16.2. Danaher Corporation Revenue and Gross Margin
      3. 7.16.3. Product portfolio
      4. 7.16.4. Recent initiatives
  8. CHAPTER 8. Upstream Bioprocessing — Industry Analysis
    1. 8.1. Upstream Bioprocessing Market – Key Trends
      1. 8.1.1. Market Drivers
      2. 8.1.2. Market Restraints
      3. 8.1.3. Market Opportunities
    2. 8.2. Value Chain Analysis
    3. 8.3. Technology Roadmap and Timeline
    4. 8.4. Upstream Bioprocessing Market – Attractiveness Analysis
      1. 8.4.1. By Product
      2. 8.4.2. By Workflow
      3. 8.4.3. By Mode
      4. 8.4.4. By Region
  9. CHAPTER 9. Marketing Strategy Analysis, Distributors
    1. 9.1. Marketing Channel
    2. 9.2. Direct Marketing
    3. 9.3. Indirect Marketing
    4. 9.4. Marketing Channel Development Trend
    5. 9.5. Economic/Political Environmental Change
  10. CHAPTER 10. Report Conclusion
  11. CHAPTER 11. Research Approach & Methodology
    1. 11.1. Report Description
    2. 11.2. Research Scope
    3. 11.3. Research Methodology
      1. 11.3.1. Secondary Research
      2. 11.3.2. Primary Research
      3. 11.3.3. Models
        1. 11.3.3.1. Company Share Analysis Model
        2. 11.3.3.2. Revenue Based Modeling
        3. 11.3.3.3. Research Limitations

        List of Figures

        FIG. 1 Global Upstream Bioprocessing Market, 2016-2026 (USD Million)
        FIG. 2 Global Upstream Bioprocessing Market Share, by Product , 2018 & 2025 (USD Million)
        FIG. 3 Global Bioreactors/Fermenters Upstream Bioprocessing Market, 2016-2026 (USD Million)
        FIG. 4 Global Cell Culture Products Upstream Bioprocessing Market, 2016-2026 (USD Million)
        FIG. 5 Global Filters Upstream Bioprocessing Market, 2016-2026 (USD Million)
        FIG. 6 Global Bioreactors Accessories Upstream Bioprocessing Market, 2016-2026 (USD Million)
        FIG. 7 Global Bags & Containers Upstream Bioprocessing Market, 2016-2026 (USD Million)
        FIG. 8 Global Others Upstream Bioprocessing Market, 2016-2026 (USD Million)
        FIG. 9 Global Upstream Bioprocessing Market Share, by Workflow , 2018 & 2025 (USD Million)
        FIG. 10 Global Media Preparation Upstream Bioprocessing Market, 2016-2026 (USD Million)
        FIG. 11 Global Cell Culture Upstream Bioprocessing Market, 2016-2026 (USD Million)
        FIG. 12 Global Cell Separation Upstream Bioprocessing Market, 2016-2026 (USD Million)
        FIG. 13 Global Upstream Bioprocessing Market Share, by Mode , 2018 & 2025 (USD Million)
        FIG. 14 Global In-house Upstream Bioprocessing Market, 2016-2026 (USD Million)
        FIG. 15 Global Outsourced Upstream Bioprocessing Market, 2016-2026 (USD Million)
        FIG. 16 Global Upstream Bioprocessing Market Share, by Region, 2018 & 2025
        FIG. 17 North America Upstream Bioprocessing Market, 2016-2026
        FIG. 18 U.S. Upstream Bioprocessing Market, 2016-2026
        FIG. 19 Canada Upstream Bioprocessing Market, 2016-2026
        FIG. 20 Europe Upstream Bioprocessing Market, 2016-2026
        FIG. 21 Germany Upstream Bioprocessing Market, 2016-2026
        FIG. 22 France Upstream Bioprocessing Market, 2016-2026
        FIG. 23 U.K. Upstream Bioprocessing Market, 2016-2026
        FIG. 24 Italy Upstream Bioprocessing Market, 2016-2026
        FIG. 25 Spain Upstream Bioprocessing Market, 2016-2026
        FIG. 26 Rest of Europe Upstream Bioprocessing Market, 2016-2026
        FIG. 27 Asia Pacific Upstream Bioprocessing Market, 2016-2026
        FIG. 28 China Upstream Bioprocessing Market, 2016-2026
        FIG. 29 Japan Upstream Bioprocessing Market, 2016-2026
        FIG. 30 India Upstream Bioprocessing Market, 2016-2026
        FIG. 31 South  Korea Upstream Bioprocessing Market, 2016-2026
        FIG. 32 South-East Asia Upstream Bioprocessing Market, 2016-2026
        FIG. 33 Rest of Asia Pacific Upstream Bioprocessing Market, 2016-2026
        FIG. 34 Latin America Upstream Bioprocessing Market, 2016-2026
        FIG. 35 Brazil Upstream Bioprocessing Market, 2016-2026
        FIG. 36 Mexico Upstream Bioprocessing Market, 2016-2026
        FIG. 37 Rest of Latin America Upstream Bioprocessing Market, 2016-2026
        FIG. 38 The Middle-East and Africa Upstream Bioprocessing Market, 2016-2026
        FIG. 39 GCC Countries Upstream Bioprocessing Market, 2016-2026
        FIG. 40 South Africa Upstream Bioprocessing Market, 2016-2026
        FIG. 41 Rest of Middle-East Africa Upstream Bioprocessing Market, 2016-2026
        FIG. 42 Competitor Market Share – Revenue
        FIG. 43 Thermo Fisher Scientific Revenue and Growth Rate
        FIG. 44 Thermo Fisher Scientific Market Share
        FIG. 45 Samsung BioLogics Revenue and Growth Rate
        FIG. 46 Samsung BioLogics Market Share
        FIG. 47 PBS Biotech, Inc. Revenue and Growth Rate
        FIG. 48 PBS Biotech, Inc. Market Share
        FIG. 49 GE Healthcare Revenue and Growth Rate
        FIG. 50 GE Healthcare Market Share
        FIG. 51 Merck KGaA Revenue and Growth Rate
        FIG. 52 Merck KGaA Market Share
        FIG. 53 Sartorius AG Revenue and Growth Rate
        FIG. 54 Sartorius AG Market Share
        FIG. 55 Eppendorf AG Revenue and Growth Rate
        FIG. 56 Eppendorf AG Market Share
        FIG. 57 Applikon Biotechnology Revenue and Growth Rate
        FIG. 58 Applikon Biotechnology Market Share
        FIG. 59 JM BIOCONNECT Revenue and Growth Rate
        FIG. 60 JM BIOCONNECT Market Share
        FIG. 61 Corning, Inc. Revenue and Growth Rate
        FIG. 62 Corning, Inc. Market Share
        FIG. 63 Boehringer Ingelheim Revenue and Growth Rate
        FIG. 64 Boehringer Ingelheim Market Share
        FIG. 65 CellGenix GmbH Revenue and Growth Rate
        FIG. 66 CellGenix GmbH Market Share
        FIG. 67 Lonza Revenue and Growth Rate
        FIG. 68 Lonza Market Share
        FIG. 69 Patheon Revenue and Growth Rate
        FIG. 70 Patheon Market Share
        FIG. 71 CMC Biologics Revenue and Growth Rate
        FIG. 72 CMC Biologics Market Share
        FIG. 73 Danaher Corporation Revenue and Growth Rate
        FIG. 74 Danaher Corporation Market Share
        FIG. 75 Market Dynamics
        FIG. 76 Global Upstream Bioprocessing – Value Chain Analysis
        FIG. 77 Technology Roadmap and Timeline
        FIG. 78 Market Attractiveness Analysis – By Product
        FIG. 79 Market Attractiveness Analysis – By Workflow
        FIG. 80 Market Attractiveness Analysis – By Mode
        FIG. 81 Market Attractiveness Analysis – By Region
        FIG. 82 Market Channel
        FIG. 83 Marketing Channel Development Trend
        FIG. 84 Growth in World Gross Product, 2008-2018

        List of Tables

        TABLE 1 Global Upstream Bioprocessing Market, 2018 & 2025 (USD Million)
        TABLE 2 Global Upstream Bioprocessing market, by Product , 2016-2026 (USD Million)
        TABLE 3 Global Upstream Bioprocessing market, by Workflow , 2016-2026 (USD Million)
        TABLE 4 Global Upstream Bioprocessing market, by Mode , 2016-2026 (USD Million)
        TABLE 5 Global Upstream Bioprocessing market, by Region, 2016-2026 (USD Million)
        TABLE 6 North America Upstream Bioprocessing Market, by Product , 2016-2026 (USD Million)
        TABLE 7 North America Upstream Bioprocessing Market, by Workflow , 2016-2026 (USD Million)
        TABLE 8 North America Upstream Bioprocessing Market, by Mode , 2016-2026 (USD Million)
        TABLE 9 Europe Upstream Bioprocessing Market, by Product , 2016-2026 (USD Million)
        TABLE 10 Europe Upstream Bioprocessing Market, by Workflow , 2016-2026 (USD Million)
        TABLE 11 Europe Upstream Bioprocessing Market, by Mode , 2016-2026 (USD Million)
        TABLE 12 Asia Pacific Upstream Bioprocessing Market, by Product , 2016-2026 (USD Million)
        TABLE 13 Asia Pacific Upstream Bioprocessing Market, by Workflow , 2016-2026 (USD Million)
        TABLE 14 Asia Pacific Upstream Bioprocessing Market, by Mode , 2016-2026 (USD Million)
        TABLE 15 Latin America Upstream Bioprocessing Market, by Product , 2016-2026 (USD Million)
        TABLE 16 Latin America Upstream Bioprocessing Market, by Workflow , 2016-2026 (USD Million)
        TABLE 17 Latin America Upstream Bioprocessing Market, by Mode , 2016-2026 (USD Million)
        TABLE 18 The Middle-East and Africa Upstream Bioprocessing Market, by Product , 2016-2026 (USD Million)
        TABLE 19 The Middle-East and Africa Upstream Bioprocessing Market, by Workflow , 2016-2026 (USD Million)
        TABLE 20 The Middle-East and Africa Upstream Bioprocessing Market, by Mode , 2016-2026 (USD Million)
        TABLE 21 Global Upstream Bioprocessing Market - Company Revenue Analysis 2016-2019 (USD Million)
        TABLE 22 Global Upstream Bioprocessing Market - Company Revenue Share Analysis 2016-2019(%)
        TABLE 23 Acquisitions and Mergers
        TABLE 24 New Product/Service Launch
        TABLE 25 Research & Development Activities
        TABLE 26 Market Drivers
        TABLE 27 Market Restraints
        TABLE 28 Market Opportunities
        

Industry Major Market Players

  • Thermo Fisher Scientific
  •  Samsung BioLogics
  •  PBS Biotech Inc.
  •  GE Healthcare
  •  Merck KGaA
  •  Sartorius AG
  •  Eppendorf AG
  • JM BIOCONNECT
  • Corning Inc.,
  • BoehringerIngelheim
  • CellGenix GmbH
  • Lonza
  • Patheon
  • CMC Biologics
  • Danaher Corporation