Search Market Research Report

Discover Our Latest Reports
Discover Our Featured Reports
Discover Top Selling Reports

Tungsten Ribbons Market Size, Share Global Analysis Report, 2020–2026

report img

Tungsten Ribbons Market By Type (Metals, Alloys), By Thickness (Less than 0.1mm, 0.11mm-0.15mm, More than 0.15mm), By Purity (90%, 92%, 95%, 99%, Others), By Application (Aviation, Medical Devices, Power and Utilities, Defense, Marine, Consumer Electronics, Semiconductor, Research and Laboratory, Others), and By Sales Channel (Direct, Indirect): Global Industry Outlook, Market Size, Business Intelligence, Consumer Preferences, Statistical Surveys, Comprehensive Analysis, Historical Developments, Current Trends, and Forecast 2020–2026

Industry Insights

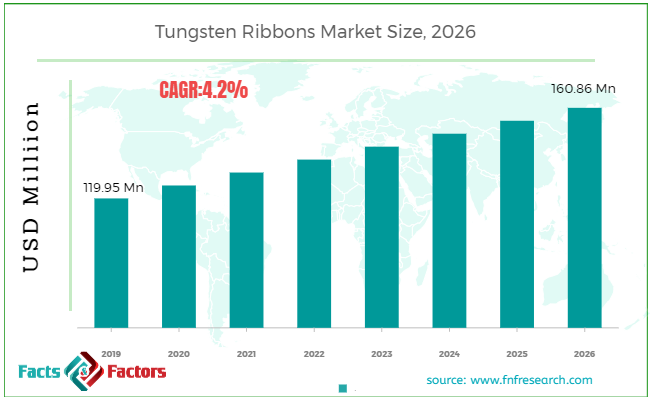
[190+ Pages Report] According to the report published by Facts Factors, the global tungsten ribbons market size was worth around USD 119.95 million in 2019 and is predicted to grow to around USD 160.86 million by 2026 with a compound annual growth rate (CAGR) of roughly 4.2% between 2020 and 2026. The report analyzes the global tungsten ribbon market drivers, restraints/challenges, and the effect they have on the demands during the projection period. In addition, the report explores emerging opportunities in the tungsten ribbon market.

Tungsten Ribbons Market Size

To know more about this report | Request Free Sample Copy

This specialized and expertise-oriented industry research report scrutinizes the technical and commercial business outlook of the Tungsten Ribbons industry. The report analyzes and declares the historical and current trends analysis of the Tungsten Ribbons industry and subsequently recommends the projected trends anticipated to be observed in the Tungsten Ribbons market during the upcoming years.

The tungsten ribbons market report analyzes and notifies the industry statistics at the global as well as regional and country levels in order to acquire a thorough perspective of the entire Tungsten Ribbons market. The historical and past insights are provided for FY 2016 to FY 2019 whereas projected trends are delivered for FY 2020 to FY 2026. The quantitative and numerical data is represented in terms of value (USD Million) from FY 2016 – 2026.


logoKey Insights from Primary Research

  • After extensive interviews with high-level executives of the major companies operating in the global tungsten ribbons market, the analysis of the primary research concludes that the global tungsten ribbons market is to undergo an impressive growth of nearly 4.2% over the forecast period.
  • In the year 2019, the tungsten ribbons market worldwide was valued at around USD 119.95 million, 2019 and is expected to be valued at over USD 160.86 million by 2026.
  • In terms of type, the metal segment is expected to dominate the global market share. The alloy segment is expected to create major market opportunities in the coming years.
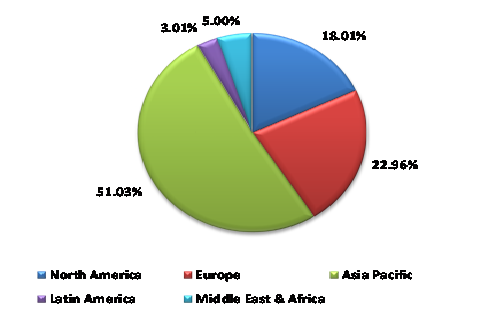
  • Asia Pacific region is dominated by the global tungsten ribbons market over the forecast period, the region was accounted for a market share of nearly 50% in 2019.?

logoKey Recommendations from Analysts

  • Our analysts recommend an increased focus on the Asia Pacific region is expected to record the fastest growth in the global tungsten ribbons market over the projected period of 2020-2026. The growth in the manufacturing and consumer electronics sector in the Asia Pacific region has driven the tungsten ribbons market.
  • Strategic developments such as acquisitions and mergers, collaborations, and regional expansion by the major companies are likely to provide greater market opportunities for the global tungsten ribbons manufacturers in the years ahead.
  • As per our analysts the less than 0.1mm segment, in terms of type, is expected to witness soaring growth in the tungsten ribbons market and is expected to dominate the global tungsten ribbons market.         
  • North America and Europe tungsten ribbons markets held a significant market share in the global tungsten ribbons market, accounting for a market share of 20% and 25% respectively in 2019.

logoMarket Share Analysis by Region, 2026

Tungsten Ribbons Market

To know more about this report | Request Free Sample Copy


The quantitative data is further underlined and reinforced by comprehensive qualitative data which comprises various across-the-board market dynamics. The rationales which directly or indirectly impact the Tungsten ribbon industry are exemplified through parameters such as growth drivers, restraints, challenges, and opportunities among other impacting factors.

Throughout our research report, we have encompassed all the proven models and tools of industry analysis and extensively illustrated all the key business strategies and business models adopted in the Tungsten Ribbons industry. The report provides an all-inclusive and detailed competitive landscape prevalent in the Tungsten Ribbons market.

The report utilizes established industry analysis tools and models such as Porter’s Five Forces framework to analyze and recognize critical business strategies adopted by various stakeholders involved in the entire value chain of the Tungsten Ribbons industry. The Tungsten Ribbons market report additionally employs SWOT analysis and PESTLE analysis models for further in-depth analysis.

The report study further includes an in-depth analysis of industry players' market shares and provides an overview of leading players' market position in the Tungsten Ribbons sector. Key strategic developments in the Tungsten Ribbons market competitive landscape such as acquisitions & mergers, inaugurations of different products and services, partnerships & joint ventures, MoU agreements, VC & funding activities, R&D activities, and geographic expansion among other noteworthy activities by key players of the Tungsten Ribbons market are appropriately highlighted in the report.

The use of tungsten ribbons in the manufacturing application, especially in the glass to metal seals in vacuum assemblies is the major factor driving the global tungsten ribbons market.

Additionally, the rising demand for the application of medical devices is further expected to propel the market growth. Furthermore, the demand for tungsten in industrial applications is also expected to rise with a widening range of applications.

The Tungsten Ribbons market research report delivers an acute valuation and taxonomy of the Tungsten Ribbons industry by practically splitting the market based on type, thickness, purity, application, sales channel, and regions. Through the analysis of the historical and projected trends, all the segments and sub-segments were evaluated through the bottom-up approach, and different market sizes have been projected for FY 2020 to FY 2026.

logoReport Scope

Report Attribute

Details

Market Size in 2019

USD 119.95 Million

Projected Market Size in 2026

USD 160.86 Million

CAGR Growth Rate

4.2% CAGR

Base Year

2019

Forecast Years

2020-2026

Key Market Players

Advent Research Materials Ltd, American Elements, Barn Door Lighting Outfitters LLC, BIMO CORPORATION, Eagle Alloys Corporation, ESPI Metals, Inc., H Cross Company, KAIYOSHA CO., LTD, Midwest Tungsten Service, Mitsuwa Electric Co., Ltd., MWS Wire Industries, Nippon Tungsten Co., Ltd., Scientific Instrument Services, T&D Materials Manufacturing, The Nilaco Corporation, and Zhuzhou Kingdon Industrial & Commercial Co., Ltd., and Others

Key Segment

By Type, Thickness,Purity, Application, and Region

Major Regions Covered

North America, Europe, Asia Pacific, Latin America, and the Middle East & Africa

Purchase Options

Request customized purchase options to meet your research needs. Explore purchase options

The regional segmentation of the Tungsten Ribbons industry includes the complete classification of all the major continents including North America, Latin America, Europe, Asia Pacific, and the Middle East & Africa. Further, country-wise data for the Tungsten Ribbons industry is provided for the leading economies of the world.

The Tungsten Ribbons market is segmented based on type, thickness, purity, application, sales channel, and region. On the basis of type segmentation, the market is classified into metal and alloy. On the basis of thickness segmentation, the market is segregated into less than 0.1mm, 0.11 mm-0.15 mm, and more than 0.15mm. On the basis of purity segmentation, the market is segmented into 90%, 92%, 95%, 99%, and others. On the basis of application segmentation, the market is bifurcated into aviation, medical devices, power and utilities, defense, marine, consumer electronics, semiconductors, research and laboratory, and others. On the basis of sales channel segmentation, the market is segmented into direct and indirect sales channels.

logoSome of the essential players operating in the Tungsten Ribbons market, but not restricted to include

  •  Advent Research Materials Ltd
  •  American Elements
  •  Barn Door Lighting Outfitters LLC
  •  BIMO CORPORATION 
  •  Eagle Alloys Corporation 
  •  ESPI Metals Inc.
  •  H Cross Company
  •  KAIYOSHA CO.LTD,
  •  Midwest Tungsten Service 
  •  Mitsuwa Electric Co.Ltd.
  •  MWS Wire Industries 
  •  Nippon Tungsten Co.Ltd. 
  •  Scientific Instrument Services 
  •  T&D Materials Manufacturing
  •  The Nilaco Corporation,
  •  Zhuzhou Kingdon Industrial & Commercial Co.Ltd.

The taxonomy of the Tungsten Ribbons industry by its scope and segmentation is as follows:

logo By TypeSegmentation Analysis

  • Metals 
  • Alloys

logo By Thickness Segmentation Analysis

  • Less than 0.1mm
  • 0.11mm-0.15mm
  • More than 0.15mm

logo By Purity Segmentation Analysis

  • 90% 
  • 92% 
  • 95% 
  • 99% 
  • Others

logo By Application Segmentation Analysis

  • Aviation 
  • Medical Devices 
  • Power and Utilities 
  • Defense 
  • Marine 
  • Consumer Electronics 
  • Semiconductor 
  • Research and Laboratory 
  • Others

logo By Sales Channel Segmentation Analysis

  • Direct
  • Indirect

logo Regional Segmentation Analysis

  • North America
    • The U.S.
    • Canada
  • Europe
    • Germany
    • The UK
    • France
    • Spain
    • Italy
    • Rest of Europe
  • Asia Pacific
    • China
    • Japan
    • India
    • South Korea
    • Southeast Asia
    • Rest of Asia Pacific
  • Latin America
    • Brazil
    • Mexico
    • Rest of Latin America
  • Middle East & Africa
    • GCC
    • South Africa
    • Rest of Middle East & Africa

Table of Content

  1. Chapter 1 Executive Summary
    1. 1.1. Introduction of Tungsten Ribbons
    2. 1.2. Global Tungsten Ribbons Market, 2019 & 2026 (USD Million)
    3. 1.3. Global Tungsten Ribbons Market, 2016 – 2026 (USD Million)
    4. 1.4. Global Tungsten Ribbons Market Absolute Revenue Opportunity, 2016 – 2026 (USD Million)
    5. 1.5. Global Tungsten Ribbons Market Incremental Revenue Opportunity, 2020 – 2026 (USD Million)
  2. Chapter 2 Tungsten Ribbons Market – Type Analysis
    1. 2.1. Global Tungsten Ribbons Market – Type Overview
    2. 2.2. Global Tungsten Ribbons Market Share, by Type, 2019 & 2026 (USD Million)
    3. 2.3. Metals
      1. 2.3.1. Global Metals Tungsten Ribbons Market, 2016 – 2026 (USD Million)
    4. 2.4. Alloys
      1. 2.4.1. Global Alloys Tungsten Ribbons Market, 2016 – 2026 (USD Million)
  3. Chapter 3 Tungsten Ribbons Market – Thickness Analysis
    1. 3.1. Global Tungsten Ribbons Market – Thickness Overview
    2. 3.2. Global Tungsten Ribbons Market Share, by Thickness, 2019 & 2026 (USD Million)
    3. 3.3. Less than 0.1mm
      1. 3.3.1. Global Less than 0.1mm Tungsten Ribbons Market, 2016 – 2026 (USD Million)
        1. 3.4. 0.11mm-0.15mm
      2. 3.4.1. Global 0.11mm-0.15mm Tungsten Ribbons Market, 2016 – 2026 (USD Million)
    4. 3.5. More than 0.15mm
      1. 3.5.1. Global More than 0.15mm Tungsten Ribbons Market, 2016 – 2026 (USD Million)
  4. Chapter 4 Tungsten Ribbons Market – Purity Analysis
    1. 4.1. Global Tungsten Ribbons Market – Purity Overview
    2. 4.2. Global Tungsten Ribbons Market Share, by Purity, 2019 & 2026 (USD Million)
    3. 4.3. 90%
      1. 4.3.1. Global 90% Tungsten Ribbons Market, 2016 – 2026 (USD Million)
    4. 4.4. 92%
      1. 4.4.1. Global 92% Tungsten Ribbons Market, 2016 – 2026 (USD Million)
    5. 4.5. 95%
      1. 4.5.1. Global 95% Tungsten Ribbons Market, 2016 – 2026 (USD Million)
    6. 4.6. 99%
      1. 4.6.1. Global 99% Tungsten Ribbons Market, 2016 – 2026 (USD Million)
    7. 4.7. Others
      1. 4.7.1. Global Others Tungsten Ribbons Market, 2016 – 2026 (USD Million)
  5. Chapter 5 Tungsten Ribbons Market – Application Analysis
    1. 5.1. Global Tungsten Ribbons Market – Application Overview
    2. 5.2. Global Tungsten Ribbons Market Share, by Application, 2019 & 2026 (USD Million)
    3. 5.3. Aviation
      1. 5.3.1. Global Aviation Tungsten Ribbons Market, 2016 – 2026 (USD Million)
    4. 5.4. Medical Devices
      1. 5.4.1. Global Medical Devices Tungsten Ribbons Market, 2016 – 2026 (USD Million)
    5. 5.5. Power and Utilities
      1. 5.5.1. Global Power and Utilities Tungsten Ribbons Market, 2016 – 2026 (USD Million)
    6. 5.6. Defense
      1. 5.6.1. Global Defense Tungsten Ribbons Market, 2016 – 2026 (USD Million)
    7. 5.7. Marine
      1. 5.7.1. Global Marine Tungsten Ribbons Market, 2016 – 2026 (USD Million)
    8. 5.8. Consumer Electronics
      1. 5.8.1. Global Consumer Electronics Tungsten Ribbons Market, 2016 – 2026 (USD Million)
    9. 5.9. Semiconductor
      1. 5.9.1. Global Semiconductor Tungsten Ribbons Market, 2016 – 2026 (USD Million)
    10. 5.10. Research and Laboratory
      1. 5.10.1. Global Research and Laboratory Tungsten Ribbons Market, 2016 – 2026 (USD Million)
    11. 5.11. Others
      1. 5.11.1. Global Others Tungsten Ribbons Market, 2016 – 2026 (USD Million)
  6. Chapter 6 Tungsten Ribbons Market – Distribution Channel Analysis
    1. 6.1. Global Tungsten Ribbons Market – Distribution Channel Overview
    2. 6.2. Global Tungsten Ribbons Market Share, by Distribution Channel, 2019 & 2026 (USD Million)
    3. 6.3. Indirect
      1. 6.3.1. Global Indirect Tungsten Ribbons Market, 2016 – 2026 (USD Million)
    4. 6.4. Direct
      1. 6.4.1. Global Direct Tungsten Ribbons Market, 2016 – 2026 (USD Million)
  7. Chapter 7 Tungsten Ribbons Market – Regional Analysis
    1. 7.1. Global Tungsten Ribbons Market Regional Overview
    2. 7.2. Global Tungsten Ribbons Market Share, by Region, 2019 & 2026 (USD Million)
    3. 7.3. North America
      1. 7.3.1. North America Tungsten Ribbons Market, 2016 – 2026 (USD Million)
        1. 7.3.1.1. North America Tungsten Ribbons Market, by Country, 2016 - 2026 (USD Million)
      2. 7.3.2. North America Tungsten Ribbons Market, by Type, 2016 – 2026
        1. 7.3.2.1. North America Tungsten Ribbons Market, by Type, 2016 – 2026 (USD Million)
      3. 7.3.3. North America Tungsten Ribbons Market, by Thickness, 2016 – 2026
        1. 7.3.3.1. North America Tungsten Ribbons Market, by Thickness, 2016 – 2026 (USD Million)
      4. 7.3.4. North America Tungsten Ribbons Market, by Purity, 2016 – 2026
        1. 7.3.4.1. North America Tungsten Ribbons Market, by Purity, 2016 – 2026 (USD Million)
      5. 7.3.5. North America Tungsten Ribbons Market, by Application, 2016 – 2026
        1. 7.3.5.1. North America Tungsten Ribbons Market, by Application, 2016 – 2026 (USD Million)
      6. 7.3.6. North America Tungsten Ribbons Market, by Distribution Channel, 2016 – 2026
        1. 7.3.6.1. North America Tungsten Ribbons Market, by Distribution Channel, 2016 – 2026 (USD Million)
          1. 7.3.7. U.S.
            1. 7.3.7.1. U.S. Tungsten Ribbons Market, 2016 – 2026 (USD Million)
      7. 7.3.8. Canada
        1. 7.3.8.1. Canada Tungsten Ribbons Market, 2016 – 2026 (USD Million)
    4. 7.4. Europe
      1. 7.4.1. Europe Tungsten Ribbons Market, 2016 – 2026 (USD Million)
        1. 7.4.1.1. Europe Tungsten Ribbons Market, by Country, 2016 - 2026 (USD Million)
      2. 7.4.2. Europe Tungsten Ribbons Market, by Type, 2016 – 2026
        1. 7.4.2.1. Europe Tungsten Ribbons Market, by Type, 2016 – 2026 (USD Million)
      3. 7.4.3. Europe Tungsten Ribbons Market, by Thickness, 2016 – 2026
        1. 7.4.3.1. Europe Tungsten Ribbons Market, by Thickness, 2016 – 2026 (USD Million)
      4. 7.4.4. Europe Tungsten Ribbons Market, by Purity, 2016 – 2026
        1. 7.4.4.1. Europe Tungsten Ribbons Market, by Purity, 2016 – 2026 (USD Million)
      5. 7.4.5. Europe Tungsten Ribbons Market, by Application, 2016 – 2026
        1. 7.4.5.1. Europe Tungsten Ribbons Market, by Application, 2016 – 2026 (USD Million)
      6. 7.4.6. Europe Tungsten Ribbons Market, by Distribution Channel, 2016 – 2026
        1. 7.4.6.1. Europe Tungsten Ribbons Market, by Distribution Channel, 2016 – 2026 (USD Million)
      7. 7.4.7. Germany
        1. 7.4.7.1. Germany Tungsten Ribbons Market, 2016 – 2026 (USD Million)
      8. 7.4.8. France
        1. 7.4.8.1. France Tungsten Ribbons Market, 2016 – 2026 (USD Million)
          1. 7.4.9. U.K.
            1. 7.4.9.1. U.K. Tungsten Ribbons Market, 2016 – 2026 (USD Million)
      9. 7.4.10. Italy
        1. 7.4.10.1. Italy Tungsten Ribbons Market, 2016 – 2026 (USD Million)
      10. 7.4.11. Spain
        1. 7.4.11.1. Spain Tungsten Ribbons Market, 2016 – 2026 (USD Million)
      11. 7.4.12. Rest of Europe
        1. 7.4.12.1. Rest of Europe Tungsten Ribbons Market, 2016 – 2026 (USD Million)
    5. 7.5. Asia Pacific
      1. 7.5.1. Asia Pacific Tungsten Ribbons Market, 2016 – 2026 (USD Million)
        1. 7.5.1.1. Asia Pacific Tungsten Ribbons Market, by Country, 2016 - 2026 (USD Million)
      2. 7.5.2. Asia Pacific Tungsten Ribbons Market, by Type, 2016 – 2026
        1. 7.5.2.1. Asia Pacific Tungsten Ribbons Market, by Type, 2016 – 2026 (USD Million)
      3. 7.5.3. Asia Pacific Tungsten Ribbons Market, by Thickness, 2016 – 2026
        1. 7.5.3.1. Asia Pacific Tungsten Ribbons Market, by Thickness, 2016 – 2026 (USD Million)
      4. 7.5.4. Asia Pacific Tungsten Ribbons Market, by Purity, 2016 – 2026
        1. 7.5.4.1. Asia Pacific Tungsten Ribbons Market, by Purity, 2016 – 2026 (USD Million)
      5. 7.5.5. Asia Pacific Tungsten Ribbons Market, by Application, 2016 – 2026
        1. 7.5.5.1. Asia Pacific Tungsten Ribbons Market, by Application, 2016 – 2026 (USD Million)
      6. 7.5.6. Asia Pacific Tungsten Ribbons Market, by Distribution Channel, 2016 – 2026
        1. 7.5.6.1. Asia Pacific Tungsten Ribbons Market, by Distribution Channel, 2016 – 2026 (USD Million)
      7. 7.5.7. China
        1. 7.5.7.1. China Tungsten Ribbons Market, 2016 – 2026 (USD Million)
      8. 7.5.8. Japan
        1. 7.5.8.1. Japan Tungsten Ribbons Market, 2016 – 2026 (USD Million)
      9. 7.5.9. India
        1. 7.5.9.1. India Tungsten Ribbons Market, 2016 – 2026 (USD Million)
      10. 7.5.10. South Korea
        1. 7.5.10.1. South Korea Tungsten Ribbons Market, 2016 – 2026 (USD Million)
      11. 7.5.11. South-East Asia
        1. 7.5.11.1. South-East Asia Tungsten Ribbons Market, 2016 – 2026 (USD Million)
      12. 7.5.12. Rest of Asia Pacific
        1. 7.5.12.1. Rest of Asia Pacific Tungsten Ribbons Market, 2016 – 2026 (USD Million)
    6. 7.6. Latin America
      1. 7.6.1. Latin America Tungsten Ribbons Market, 2016 – 2026 (USD Million)
        1. 7.6.1.1. Latin America Tungsten Ribbons Market, by Country, 2016 - 2026 (USD Million)
      2. 7.6.2. Latin America Tungsten Ribbons Market, by Type, 2016 – 2026
        1. 7.6.2.1. Latin America Tungsten Ribbons Market, by Type, 2016 – 2026 (USD Million)
      3. 7.6.3. Latin America Tungsten Ribbons Market, by Thickness, 2016 – 2026
        1. 7.6.3.1. Latin America Tungsten Ribbons Market, by Thickness, 2016 – 2026 (USD Million)
      4. 7.6.4. Latin America Tungsten Ribbons Market, by Purity, 2016 – 2026
        1. 7.6.4.1. Latin America Tungsten Ribbons Market, by Purity, 2016 – 2026 (USD Million)
      5. 7.6.5. Latin America Tungsten Ribbons Market, by Application, 2016 – 2026
        1. 7.6.5.1. Latin America Tungsten Ribbons Market, by Application, 2016 – 2026 (USD Million)
      6. 7.6.6. Latin America Tungsten Ribbons Market, by Distribution Channel, 2016 – 2026
        1. 7.6.6.1. Latin America Tungsten Ribbons Market, by Distribution Channel, 2016 – 2026 (USD Million)
      7. 7.6.7. Brazil
        1. 7.6.7.1. Brazil Tungsten Ribbons Market, 2016 – 2026 (USD Million)
      8. 7.6.8. Mexico
        1. 7.6.8.1. Mexico Tungsten Ribbons Market, 2016 – 2026 (USD Million)
      9. 7.6.9. Rest of Latin America
        1. 7.6.9.1. Rest of Latin America Tungsten Ribbons Market, 2016 – 2026 (USD Million)
    7. 7.7. The Middle-East and Africa
      1. 7.7.1. The Middle-East and Africa Tungsten Ribbons Market, 2016 – 2026 (USD Million)
        1. 7.7.1.1. The Middle-East and Africa Tungsten Ribbons Market, by Country, 2016 - 2026 (USD Million)
      2. 7.7.2. The Middle-East and Africa Tungsten Ribbons Market, by Type, 2016 – 2026
        1. 7.7.2.1. The Middle-East and Africa Tungsten Ribbons Market, by Type, 2016 – 2026 (USD Million)
      3. 7.7.3. The Middle-East and Africa Tungsten Ribbons Market, by Thickness, 2016 – 2026
        1. 7.7.3.1. The Middle-East and Africa Tungsten Ribbons Market, by Thickness, 2016 – 2026 (USD Million)
      4. 7.7.4. The Middle-East and Africa Tungsten Ribbons Market, by Purity, 2016 – 2026
        1. 7.7.4.1. The Middle-East and Africa Tungsten Ribbons Market, by Purity, 2016 – 2026 (USD Million)
      5. 7.7.5. The Middle-East and Africa Tungsten Ribbons Market, by Application, 2016 – 2026
        1. 7.7.5.1. The Middle-East and Africa Tungsten Ribbons Market, by Application, 2016 – 2026 (USD Million)
      6. 7.7.6. The Middle-East and Africa Tungsten Ribbons Market, by Distribution Channel, 2016 – 2026
        1. 7.7.6.1. The Middle-East and Africa Tungsten Ribbons Market, by Distribution Channel, 2016 – 2026 (USD Million)
      7. 7.7.7. GCC Countries
        1. 7.7.7.1. GCC Countries Tungsten Ribbons Market, 2016 – 2026 (USD Million)
      8. 7.7.8. South Africa
        1. 7.7.8.1. South Africa Tungsten Ribbons Market, 2016 – 2026 (USD Million)
      9. 7.7.9. Rest of Middle-East Africa
        1. 7.7.9.1. Rest of Middle-East Africa Tungsten Ribbons Market, 2016 – 2026 (USD Million)
  8. Chapter 8 Tungsten Ribbons Market – Competitive Landscape
    1. 8.1. Competitor Market Share – Revenue
    2. 8.2. Market Concentration Rate Analysis, Top 3 and Top 5 Players
    3. 8.3. Strategic Developments
      1. 8.3.1. Acquisitions and Mergers
      2. 8.3.2. New Products
      3. 8.3.3. Research & Development Activities
  9. Chapter 9 Company Profiles
    1. 9.1. Advent Research Materials Ltd
      1. 9.1.1. Company Overview
      2. 9.1.2. Product/Service Portfolio
      3. 9.1.3. Advent Research Materials Ltd Sales, Revenue, and Gross Margin
      4. 9.1.4. Advent Research Materials Ltd Revenue and Growth Rate
      5. 9.1.5. Advent Research Materials Ltd Market Share
      6. 9.1.6. Recent Initiatives, Funding/VC Activities, and Technological Innovations
    2. 9.2. American Elements
      1. 9.2.1. Company Overview
      2. 9.2.2. Product/Service Portfolio
      3. 9.2.3. American Elements Sales, Revenue, and Gross Margin
      4. 9.2.4. American Elements Revenue and Growth Rate
      5. 9.2.5. American Elements Market Share
      6. 9.2.6. Recent Initiatives, Funding/VC Activities, and Technological Innovations
    3. 9.3. BIMO CORPORATION
      1. 9.3.1. Company Overview
      2. 9.3.2. Product/Service Portfolio
      3. 9.3.3. BIMO CORPORATION Sales, Revenue, and Gross Margin
      4. 9.3.4. BIMO CORPORATION Revenue and Growth Rate
      5. 9.3.5. BIMO CORPORATION Market Share
      6. 9.3.6. Recent Initiatives, Funding/VC Activities, and Technological Innovations
    4. 9.4. Eagle Alloys Corporation
      1. 9.4.1. Company Overview
      2. 9.4.2. Product/Service Portfolio
      3. 9.4.3. Eagle Alloys Corporation Sales, Revenue, and Gross Margin
      4. 9.4.4. Eagle Alloys Corporation Revenue and Growth Rate
      5. 9.4.5. Eagle Alloys Corporation Market Share
      6. 9.4.6. Recent Initiatives, Funding/VC Activities, and Technological Innovations
    5. 9.5. ESPI Metals, Inc
      1. 9.5.1. Company Overview
      2. 9.5.2. Product/Service Portfolio
      3. 9.5.3. ESPI Metals, Inc Sales, Revenue, and Gross Margin
      4. 9.5.4. ESPI Metals, Inc Revenue and Growth Rate
      5. 9.5.5. ESPI Metals, Inc Market Share
      6. 9.5.6. Recent Initiatives, Funding/VC Activities, and Technological Innovations
    6. 9.6. H Cross Company
      1. 9.6.1. Company Overview
      2. 9.6.2. Product/Service Portfolio
      3. 9.6.3. H Cross Company Sales, Revenue, and Gross Margin
      4. 9.6.4. H Cross Company Revenue and Growth Rate
      5. 9.6.5. H Cross Company Market Share
      6. 9.6.6. Recent Initiatives, Funding/VC Activities, and Technological Innovations
    7. 9.7. KAIYOSHA CO., LTD
      1. 9.7.1. Company Overview
      2. 9.7.2. Product/Service Portfolio
      3. 9.7.3. KAIYOSHA CO., LTD Sales, Revenue, and Gross Margin
      4. 9.7.4. KAIYOSHA CO., LTD Revenue and Growth Rate
      5. 9.7.5. KAIYOSHA CO., LTD Market Share
      6. 9.7.6. Recent Initiatives, Funding/VC Activities, and Technological Innovations
    8. 9.8. Midwest Tungsten Service
      1. 9.8.1. Company Overview
      2. 9.8.2. Product/Service Portfolio
      3. 9.8.3. Midwest Tungsten Service Sales, Revenue, and Gross Margin
      4. 9.8.4. Midwest Tungsten Service Revenue and Growth Rate
      5. 9.8.5. Midwest Tungsten Service Market Share
      6. 9.8.6. Recent Initiatives, Funding/VC Activities, and Technological Innovations
    9. 9.9. Mitsuwa Electric Co., Ltd
      1. 9.9.1. Company Overview
      2. 9.9.2. Product/Service Portfolio
      3. 9.9.3. Mitsuwa Electric Co., Ltd Sales, Revenue, and Gross Margin
      4. 9.9.4. Mitsuwa Electric Co., Ltd Revenue and Growth Rate
      5. 9.9.5. Mitsuwa Electric Co., Ltd Market Share
      6. 9.9.6. Recent Initiatives, Funding/VC Activities, and Technological Innovations
    10. 9.10. MWS Wire Industries
      1. 9.10.1. Company Overview
      2. 9.10.2. Product/Service Portfolio
      3. 9.10.3. MWS Wire Industries Sales, Revenue, and Gross Margin
      4. 9.10.4. MWS Wire Industries Revenue and Growth Rate
      5. 9.10.5. MWS Wire Industries Market Share
      6. 9.10.6. Recent Initiatives, Funding/VC Activities, and Technological Innovations
    11. 9.11. Nippon Tungsten Co., Ltd.
      1. 9.11.1. Company Overview
      2. 9.11.2. Product/Service Portfolio
      3. 9.11.3. Nippon Tungsten Co., Ltd. Sales, Revenue, and Gross Margin
      4. 9.11.4. Nippon Tungsten Co., Ltd. Revenue and Growth Rate
      5. 9.11.5. Nippon Tungsten Co., Ltd. Market Share
      6. 9.11.6. Recent Initiatives, Funding/VC Activities, and Technological Innovations
    12. 9.12. Scientific Instrument Services
      1. 9.12.1. Company Overview
      2. 9.12.2. Product/Service Portfolio
      3. 9.12.3. Scientific Instrument Services Sales, Revenue, and Gross Margin
      4. 9.12.4. Scientific Instrument Services Revenue and Growth Rate
      5. 9.12.5. Scientific Instrument Services Market Share
      6. 9.12.6. Recent Initiatives, Funding/VC Activities, and Technological Innovations
    13. 9.13. T&D Materials Manufacturing
      1. 9.13.1. Company Overview
      2. 9.13.2. Product/Service Portfolio
      3. 9.13.3. T&D Materials Manufacturing Sales, Revenue, and Gross Margin
      4. 9.13.4. T&D Materials Manufacturing Revenue and Growth Rate
      5. 9.13.5. T&D Materials Manufacturing Market Share
      6. 9.13.6. Recent Initiatives, Funding/VC Activities, and Technological Innovations
    14. 9.14. Zhuzhou Kingdon Industrial & Commercial Co., Ltd
      1. 9.14.1. Company Overview
      2. 9.14.2. Product/Service Portfolio
      3. 9.14.3. Zhuzhou Kingdon Industrial & Commercial Co., Ltd Sales, Revenue, and Gross Margin
      4. 9.14.4. Zhuzhou Kingdon Industrial & Commercial Co., Ltd Revenue and Growth Rate
      5. 9.14.5. Zhuzhou Kingdon Industrial & Commercial Co., Ltd Market Share
      6. 9.14.6. Recent Initiatives, Funding/VC Activities, and Technological Innovations
  10. Chapter 10 Tungsten Ribbons — Industry Analysis
    1. 10.1. Introduction and Taxonomy
    2. 10.2. Tungsten Ribbons Market – Key Trends
      1. 10.2.1. Market Drivers
      2. 10.2.2. Market Restraints
      3. 10.2.3. Market Opportunities
    3. 10.3. Value Chain Analysis
    4. 10.4. Key Mandates and Regulations
    5. 10.5. Technology Roadmap and Timeline
    6. 10.6. Tungsten Ribbons Market – Attractiveness Analysis
      1. 10.6.1. By Type
      2. 10.6.2. By Thickness
      3. 10.6.3. By Purity
      4. 10.6.4. By Application
      5. 10.6.5. By Distribution Channel
      6. 10.6.6. By Region
  11. Chapter 11 Industrial Chain, Sourcing Strategy, and Downstream Buyers
    1. 11.1. Tungsten Ribbons Industrial Chain Analysis
    2. 11.2. Downstream Buyers
    3. 11.3. Distributors/Traders List
  12. Chapter 12 Marketing Strategy Analysis
    1. 12.1. Marketing Channel
    2. 12.2. Direct Marketing
    3. 12.3. Indirect Marketing
    4. 12.4. Marketing Channel Development Trends
    5. 12.5. Economic/Political Environmental Change
  13. Chapter 13 Report Conclusion & Key Insights
    1. 13.1. Key Insights from Primary Interviews & Surveys Respondents
    2. 13.2. Key Takeaways from Analysts, Consultants, and Industry Leaders
  14. Chapter 14 Research Approach & Methodology
    1. 14.1. Report Description
    2. 14.2. Research Scope
    3. 14.3. Research Methodology
      1. 14.3.1. Secondary Research
      2. 14.3.2. Primary Research
      3. 14.3.3. Statistical Models
        1. 14.3.3.1. Company Share Analysis Model
        2. 14.3.3.2. Revenue Based Modeling
      4. 14.3.4. Research Limitations

  • List of Figures

    Fig.1 Product Picture of Tungsten Ribbons
    Fig.2 Global Tungsten Ribbons Market, 2016 – 2026 (USD Million)
    Fig.3 Global Tungsten Ribbons Market Absolute Revenue Opportunity, 2016 – 2026 (USD Million)
    Fig.4 Global Tungsten Ribbons Market Incremental Revenue Opportunity, 2020 – 2026 (USD Million)
    Fig.5 Global Tungsten Ribbons Market Share, by Type, 2019 & 2026 (USD Million)
    Fig.6 Global Metals Tungsten Ribbons Market, 2016 – 2026 (USD Million)
    Fig.7 Global Alloys Tungsten Ribbons Market, 2016 – 2026 (USD Million)
    Fig.8 Global Tungsten Ribbons Market Share, by Thickness, 2019 & 2026 (USD Million)
    Fig.9 Global Less than 0.1mm Tungsten Ribbons Market, 2016 – 2026 (USD Million)
    Fig.10 Global 0.11mm-0.15mm Tungsten Ribbons Market, 2016 – 2026 (USD Million)
    Fig.11 Global More than 0.15mm Tungsten Ribbons Market, 2016 – 2026 (USD Million)
    Fig.12 Global Tungsten Ribbons Market Share, by Purity, 2019 & 2026 (USD Million)
    Fig.13 Global 90% Tungsten Ribbons Market, 2016 – 2026 (USD Million)
    Fig.14 Global  92% Tungsten Ribbons Market, 2016 – 2026 (USD Million)
    Fig.15 Global 95% Tungsten Ribbons Market, 2016 – 2026 (USD Million)
    Fig.16 Global 99% Tungsten Ribbons Market, 2016 – 2026 (USD Million)
    Fig.17 Global  Others Tungsten Ribbons Market, 2016 – 2026 (USD Million)
    Fig.18 Global Tungsten Ribbons Market Share, by  Application, 2019 & 2026 (USD Million)
    Fig.19 Global  Aviation Tungsten Ribbons Market, 2016 – 2026 (USD Million)
    Fig.20 Global Medical Devices Tungsten Ribbons Market, 2016 – 2026 (USD Million)
    Fig.21 Global Power and Utilities Tungsten Ribbons Market, 2016 – 2026 (USD Million)
    Fig.22 Global Defense Tungsten Ribbons Market, 2016 – 2026 (USD Million)
    Fig.23 Global Marine Tungsten Ribbons Market, 2016 – 2026 (USD Million)
    Fig.24 Global Consumer Electronics Tungsten Ribbons Market, 2016 – 2026 (USD Million)
    Fig.25 Global Semiconductor Tungsten Ribbons Market, 2016 – 2026 (USD Million)
    Fig.26 Global Research and Laboratory Tungsten Ribbons Market, 2016 – 2026 (USD Million)
    Fig.27 Global Others Tungsten Ribbons Market, 2016 – 2026 (USD Million)
    Fig.28 Global Tungsten Ribbons Market Share, by Distribution Channel, 2019 & 2026 (USD Million)
    Fig.29 Global Indirect Tungsten Ribbons Market, 2016 – 2026 (USD Million)
    Fig.30 Global Direct Tungsten Ribbons Market, 2016 – 2026 (USD Million)
    Fig.31 Global Tungsten Ribbons Market Share, by Region, 2019 & 2026 (USD Million)
    Fig.32 North America Tungsten Ribbons Market, 2016 – 2026 (USD Million)
    Fig.33 U.S. Tungsten Ribbons Market, 2016 – 2026 (USD Million)
    Fig.34 Canada Tungsten Ribbons Market, 2016 – 2026 (USD Million)
    Fig.35 Europe Tungsten Ribbons Market, 2016 – 2026 (USD Million)
    Fig.36 Germany Tungsten Ribbons Market, 2016 – 2026 (USD Million)
    Fig.37 France Tungsten Ribbons Market, 2016 – 2026 (USD Million)
    Fig.38 U.K. Tungsten Ribbons Market, 2016 – 2026 (USD Million)
    Fig.39 Italy Tungsten Ribbons Market, 2016 – 2026 (USD Million)
    Fig.40 Spain Tungsten Ribbons Market, 2016 – 2026 (USD Million)
    Fig.41 Rest of Europe Tungsten Ribbons Market, 2016 – 2026 (USD Million)
    Fig.42 Asia Pacific Tungsten Ribbons Market, 2016 – 2026 (USD Million)
    Fig.43 China Tungsten Ribbons Market, 2016 – 2026 (USD Million)
    Fig.44 Japan Tungsten Ribbons Market, 2016 – 2026 (USD Million)
    Fig.45 India Tungsten Ribbons Market, 2016 – 2026 (USD Million)
    Fig.46 South  Korea Tungsten Ribbons Market, 2016 – 2026 (USD Million)
    Fig.47 South-East Asia Tungsten Ribbons Market, 2016 – 2026 (USD Million)
    Fig.48 Rest of Asia Pacific Tungsten Ribbons Market, 2016 – 2026 (USD Million)
    Fig.49 Latin America Tungsten Ribbons Market, 2016 – 2026 (USD Million)
    Fig.50 Brazil Tungsten Ribbons Market, 2016 – 2026 (USD Million)
    Fig.51 Mexico Tungsten Ribbons Market, 2016 – 2026 (USD Million)
    Fig.52 Rest of Latin America Tungsten Ribbons Market, 2016 – 2026 (USD Million)
    Fig.53 The Middle-East and Africa Tungsten Ribbons Market, 2016 – 2026 (USD Million)
    Fig.54 GCC Countries Tungsten Ribbons Market, 2016 – 2026 (USD Million)
    Fig.55 South Africa Tungsten Ribbons Market, 2016 – 2026 (USD Million)
    Fig.56 Rest of Middle-East Africa Tungsten Ribbons Market, 2016 – 2026 (USD Million)
    Fig.57 Competitor Market Share – Revenue
    Fig.58 Advent Research Materials Ltd Revenue and Growth Rate
    Fig.59 Advent Research Materials Ltd Market Share
    Fig.60 American Elements Revenue and Growth Rate
    Fig.61 American Elements Market Share
    Fig.62 BIMO CORPORATION Revenue and Growth Rate
    Fig.63 BIMO CORPORATION Market Share
    Fig.64 Eagle Alloys Corporation Revenue and Growth Rate
    Fig.65 Eagle Alloys Corporation Market Share
    Fig.66 ESPI Metals, Inc Revenue and Growth Rate
    Fig.67 ESPI Metals, Inc Market Share
    Fig.68 H Cross Company Revenue and Growth Rate
    Fig.69 H Cross Company Market Share
    Fig.70 KAIYOSHA CO., LTD Revenue and Growth Rate
    Fig.71 KAIYOSHA CO., LTD Market Share
    Fig.72 Midwest Tungsten Service Revenue and Growth Rate
    Fig.73 Midwest Tungsten Service Market Share
    Fig.74 Mitsuwa Electric Co., Ltd Revenue and Growth Rate
    Fig.75 Mitsuwa Electric Co., Ltd Market Share
    Fig.76 MWS Wire Industries Revenue and Growth Rate
    Fig.77 MWS Wire Industries Market Share
    Fig.78 Nippon Tungsten Co., Ltd. Revenue and Growth Rate
    Fig.79 Nippon Tungsten Co., Ltd. Market Share
    Fig.80 Scientific Instrument Services Revenue and Growth Rate
    Fig.81 Scientific Instrument Services Market Share
    Fig.82 T&D Materials Manufacturing Revenue and Growth Rate
    Fig.83 T&D Materials Manufacturing Market Share
    Fig.84 Zhuzhou Kingdon Industrial & Commercial Co., Ltd Revenue and Growth Rate
    Fig.85 Zhuzhou Kingdon Industrial & Commercial Co., Ltd Market Share
    Fig.86 Market Dynamics
    Fig.87 Global Tungsten Ribbons – Value Chain Analysis
    Fig.88 Key Mandates and Regulations
    Fig.89 Technology Roadmap and Timeline
    Fig.90 Market Attractiveness Analysis – By Type
    Fig.91 Market Attractiveness Analysis – By Thickness
    Fig.92 Market Attractiveness Analysis – By Purity
    Fig.93 Market Attractiveness Analysis – By  Application
    Fig.94 Market Attractiveness Analysis – By Distribution Channel
    Fig.95 Market Attractiveness Analysis – By Region
    Fig.96 Tungsten Ribbons Industrial Chain Analysis
    Fig.97 Market Channels
    Fig.98 Marketing Channel Development Trend
    Fig.99 Growth in World Gross Product, 2008-2018
    

    List of Tables

    Table 1 Global Tungsten Ribbons Market, 2019 & 2026 (USD Million)
    Table 2 Global Tungsten Ribbons Market, by Type, 2016 – 2026 (USD Million)
    Table 3 Global Tungsten Ribbons Market, by Thickness, 2016 – 2026 (USD Million)
    Table 4 Global Tungsten Ribbons Market, by Purity, 2016 – 2026 (USD Million)
    Table 5 Global Tungsten Ribbons Market, by  Application, 2016 – 2026 (USD Million)
    Table 6 Global Tungsten Ribbons Market, by Distribution Channel, 2016 – 2026 (USD Million)
    Table 7 Global Tungsten Ribbons Market, by Region, 2016 – 2026 (USD Million)
    Table 8 North America Tungsten Ribbons Market, by Country, 2016 – 2026 (USD Million)
    Table 9 North America Tungsten Ribbons Market, by Type, 2016 – 2026 (USD Million)
    Table 10 North America Tungsten Ribbons Market, by Thickness, 2016 – 2026 (USD Million)
    Table 11 North America Tungsten Ribbons Market, by Purity, 2016 – 2026 (USD Million)
    Table 12 North America Tungsten Ribbons Market, by  Application, 2016 – 2026 (USD Million)
    Table 13 North America Tungsten Ribbons Market, by Distribution Channel, 2016 – 2026 (USD Million)
    Table 14 Europe Tungsten Ribbons Market, by Country, 2016 – 2026 (USD Million)
    Table 15 Europe Tungsten Ribbons Market, by Type, 2016 – 2026 (USD Million)
    Table 16 Europe Tungsten Ribbons Market, by Thickness, 2016 – 2026 (USD Million)
    Table 17 Europe Tungsten Ribbons Market, by Purity, 2016 – 2026 (USD Million)
    Table 18 Europe Tungsten Ribbons Market, by  Application, 2016 – 2026 (USD Million)
    Table 19 Europe Tungsten Ribbons Market, by Distribution Channel, 2016 – 2026 (USD Million)
    Table 20 Asia Pacific Tungsten Ribbons Market, by Country, 2016 – 2026 (USD Million)
    Table 21 Asia Pacific Tungsten Ribbons Market, by Type, 2016 – 2026 (USD Million)
    Table 22 Asia Pacific Tungsten Ribbons Market, by Thickness, 2016 – 2026 (USD Million)
    Table 23 Asia Pacific Tungsten Ribbons Market, by Purity, 2016 – 2026 (USD Million)
    Table 24 Asia Pacific Tungsten Ribbons Market, by  Application, 2016 – 2026 (USD Million)
    Table 25 Asia Pacific Tungsten Ribbons Market, by Distribution Channel, 2016 – 2026 (USD Million)
    Table 26 Latin America Tungsten Ribbons Market, by Country, 2016 – 2026 (USD Million)
    Table 27 Latin America Tungsten Ribbons Market, by Type, 2016 – 2026 (USD Million)
    Table 28 Latin America Tungsten Ribbons Market, by Thickness, 2016 – 2026 (USD Million)
    Table 29 Latin America Tungsten Ribbons Market, by Purity, 2016 – 2026 (USD Million)
    Table 30 Latin America Tungsten Ribbons Market, by  Application, 2016 – 2026 (USD Million)
    Table 31 Latin America Tungsten Ribbons Market, by Distribution Channel, 2016 – 2026 (USD Million)
    Table 32 The Middle-East and Africa Tungsten Ribbons Market, by Country, 2016 – 2026 (USD Million)
    Table 33 The Middle-East and Africa Tungsten Ribbons Market, by Type, 2016 – 2026 (USD Million)
    Table 34 The Middle-East and Africa Tungsten Ribbons Market, by Thickness, 2016 – 2026 (USD Million)
    Table 35 The Middle-East and Africa Tungsten Ribbons Market, by Purity, 2016 – 2026 (USD Million)
    Table 36 The Middle-East and Africa Tungsten Ribbons Market, by  Application, 2016 – 2026 (USD Million)
    Table 37 The Middle-East and Africa Tungsten Ribbons Market, by Distribution Channel, 2016 – 2026 (USD Million)
    Table 38 Global Tungsten Ribbons Market - Company Revenue Analysis, 2016 – 2019 (USD Million)
    Table 39 Global Tungsten Ribbons Market - Company Revenue Share Analysis, 2016 – 2019 (%)
    Table 40 Acquisitions and Mergers
    Table 41 Market Drivers – Impact Analysis
    Table 42 Market Restraints
    Table 43 Market Opportunities
    Table 44 Major Buyers of Tungsten Ribbons
    Table 45 Distributors/Traders of Tungsten Ribbons by Region
    
  •  

    Industry Major Market Players

    •  Advent Research Materials Ltd
    •  American Elements
    •  Barn Door Lighting Outfitters LLC
    •  BIMO CORPORATION 
    •  Eagle Alloys Corporation 
    •  ESPI Metals Inc.
    •  H Cross Company
    •  KAIYOSHA CO.LTD,
    •  Midwest Tungsten Service 
    •  Mitsuwa Electric Co.Ltd.
    •  MWS Wire Industries 
    •  Nippon Tungsten Co.Ltd. 
    •  Scientific Instrument Services 
    •  T&D Materials Manufacturing
    •  The Nilaco Corporation,
    •  Zhuzhou Kingdon Industrial & Commercial Co.Ltd.