Search Market Research Report

Discover Our Latest Reports
Discover Our Featured Reports
Discover Top Selling Reports

Time Temperature Indicator Labels Market Size, Share Global Analysis Report, 2019–2026

report img

Time Temperature Indicator Labels Market By Product Type (Color-Based, Barcode-Based), By Label Information (Critical Temperature Indicator (CTI), Critical Time Temperature Indicator (CTTI), Time Temperature Indicator (TTI) ) and By End-User (Food and Beverages, Pharmaceuticals, Chemical and Fertilizers): Global Industry Perspective, Market Size, Statistical Research, Market Intelligence, Comprehensive Analysis, Historical Trends, and Forecast 2019–2026

Industry Insights

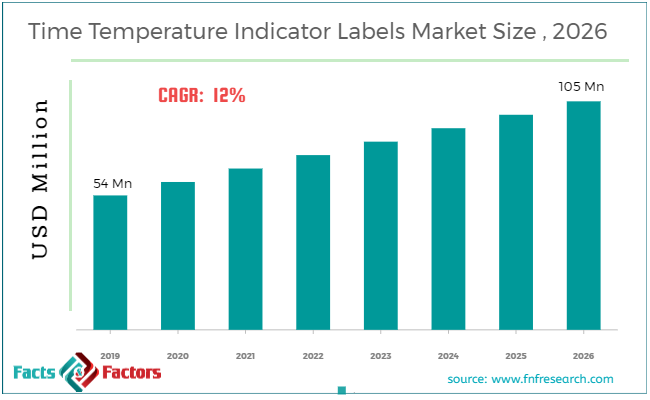
According to the report published by Facts & Factors, the global Time Temperature Indicator Labels Market size was worth around USD 54 million in 2019 and is predicted to grow around USD 105 million by 2026 with a compound annual growth rate (CAGR) of roughly 12% between 2020 and 2026. The report analyzes the global Time Temperature Indicator Labels Market drivers, restraints/challenges, and the effect they have on the demands during the projection period. In addition, the report explores emerging opportunities in the Time Temperature Indicator Labels Market.

Time Temperature Indicator Labels Market

To know more about this report | Request Free Sample Copy

This professional and specialized report study examines the technical and business perspective of the Time Temperature Indicator Labels industry. The report provides a historical analysis of the industry as well as the projected trends expected to be witnessed in the Time Temperature Indicator Labels market. The report study analyzes the market statistics at the global as well as the regional levels to gain an in-depth perspective of the overall Time Temperature Indicator Labels market. The historical insights are provided from 2016 to 2019 and projected trends are provided from 2020 to 2026. The quantitative data is provided in terms of both volume (Units) and value (USD Million) for 2016 – 2026. The qualitative data is reinforced by analyzing and providing numerous market dynamics (directly or indirectly affecting the industry) such as growth drivers, restraints, challenges, and opportunities.

We have included various industry analysis models in our report and extensively demonstrated the key business strategies and competitive landscape of the Time Temperature Indicator Labels market in our study.

logoKey Insights from Primary Research

  • As per the details shared by our primary respondents, Time Temperature Indicator Labels Market is expected to grow at an annual rate of around 12%.
  • Through the primary research, it was observed that the Time Temperature Indicator Labels Market was estimated at around USD 54 Million in 2019.
  • The “Color-Based” category, on the basis of product type, was the leading revenue generator in 2019.
  • The “Critical Time Temperature Indicators (CTTI)” under the segment of Label Information, was dominant in the year 2019.
  • On the basis of end-user segmentation, the “pharmaceuticals” category held the leading share in 2019.

logoKey Recommendations from Analysts

  • As per our analysts, Time Temperature Indicator Labels Market is popular among the food and pharmaceutical industry as these two industries have spread across the globe.
  • Brands and retailers are looking for easier and affordable options of indicator labels that are more effective and can be easily understood by any person.
  • Critical Time Temperature Indicators (CTTI) are used on a large scale as it is very convenient to indicate any issue in the distribution channel and it is very cost-effective.
  • North American region is the region where maximum indicator labels are used as these nations are trying to be self-reliant in the field of pharmaceuticals.
  • As the CAGR is growing at around 12%, the Time Temperature Indicator Labels market is providing good business and job opportunities for people around the world and numerous benefits for the people associated in the entire value chain.

logo
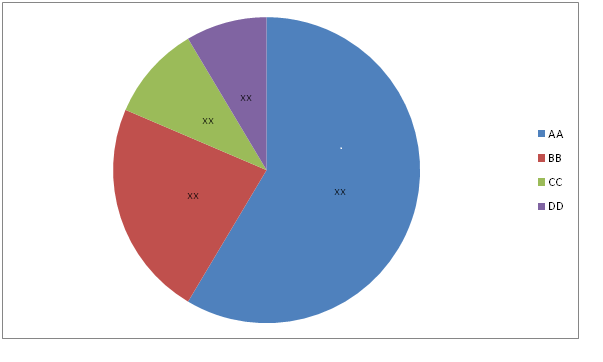
Market Attractiveness – By End-User

Time Temperature Indicator Labels Market

To know more about this report | Request Free Sample Copy

Our study also includes an analysis of Porter’s Five Forces framework for understanding the competitive strategies adopted by various stakeholders involved in the entire value chain of the Time Temperature Indicator Labels market. It also encompasses PESTLE analysis and SWOT analysis.

The report also offers an in-depth analysis of the market shares of each industry player and gives an outline of the market position of key players in the Time Temperature Indicator Labels market. Moreover, the study offers wide coverage of key strategic advances witnessed in the market such as new product launches, acquisitions & mergers, collaborations & joint ventures, funding & VC activities, agreements, partnerships, R&D activities, and regional expansion of key players of the Time Temperature Indicator Labels market.

The research study provides a critical assessment of the Time Temperature Indicator Labels industry by logically segmenting the market on the basis of Product Type, Label Information, End-User, and regions. Based on the past, present, and future trends, all the segments were analyzed from the bottom up, and the market sizes have been estimated from 2020 to 2026. The regional segmentation of the Time Temperature Indicator Labels industry includes the holistic bifurcation of all the five major continents including North America, Europe, Asia Pacific, Latin America, and the Middle East & Africa.

logoReport Scope

Report Attribute

Details

Market Size in 2019

USD 54 Million

Projected Market Size in 2026

USD 105 Million

CAGR Growth Rate

CAGR 12%

Base Year

2019

Forecast Years

2020-2026

Key Market Players

3M, Thin Film Electronics ASA, Freshpoint Quality Assurance Ltd., NiGK Corporation, LCR Hallcrest, LLC, Biosynergy, Inc., Temptime Corporation, Delta Trak, Inc., CCL Industries Inc.and others.

Key Segment

By Type, Label Information, End-user and Region

Major Regions Covered

North America, Europe, Asia Pacific, Latin America, and the Middle East &, Africa

Purchase Options

Request customized purchase options to meet your research needs. Explore purchase options

Time Temperature Indicator Labels are those smart labels that are used to get information about the time and temperature of a product. Various types of indicator labels are available in the market that can give some accurate details about the time and temperature exposure of any certain product. These labels are widely used in the industry of food, medical and pharmaceuticals as the products of these segments are very important. As per the demands and advancing technology, these indicator labels are getting advanced and enhanced.

Brands and Retails prefer color based indicator label as it is easily visible to the naked eyes and can be easily indicating the quality issue just by changing its color. They prefer such indicator labels that are cost-effective and easily available. Many developed countries are preferring to provide the packaging of their products with these indicator labels to assure the guarantee about the quality of the product and if the product is traveling overseas, then to provide the assurance that the product was handled with utmost care and in such environment that is favorable for the product to stay unaffected by any external factor.

The Time Temperature Indicator Labels market is segmented based on Product Type, Label Information and End-User Application.  On the basis of Product Type segmentation, the market is classified into Color-Based and Barcode-Based. In terms of Label Information, the market is classified into Critical Temperature Indicator (CTI), Critical Time Temperature Indicators (CTTI), and Time Temperature Indicators (TTI).In terms of End-User Application segmentation, the market is divided into Food and Beverages, Pharmaceuticals, Chemicals and Fertilizers.

logoSome of the essential players operating in the Time Temperature Indicator Labels market, but not restricted to include

  • 3M
  • Thin Film Electronics ASA
  • Freshpoint Quality Assurance Ltd.
  • NiGK Corporation
  • LCR Hallcrest, LLC
  • Biosynergy, Inc.
  • Temptime Corporation
  • Delta Trak, Inc.
  • CCL Industries Inc.

The taxonomy of the Time Temperature Indicator Labels Market by its scope and segmentation is as follows:

logo By Type Segmentation Analysis

  • Color-Based
  • Barcode-Based

logo By Label Information Segmentation Analysis

  • Critical Temperature Indicator (CTI)
  • Critical Time Temperature Indicators (CTTI)
  • Time Temperature Indicators (TTI)

logo By End-user Segmentation Analysis

  • Food and Beverages
  • Pharmaceuticals
  • Chemicals and Fertilizers

logo Regional Segmentation Analysis

  • North America
    • The U.S.
    • Canada
  • Europe
    • France
    • The UK
    • Spain
    • Germany
    • Italy
    • Rest of Europe
  • Asia Pacific
    • China
    • Japan
    • India
    • South Korea
    • Southeast Asia
    • Rest of Asia Pacific
  • Latin America
    • Brazil
    • Mexico
    • Rest of Latin America
  • Middle East & Africa
    • GCC
    • South Africa
    • Rest of Middle East & Africa

logoKEY BUSINESS POINTERS ADDRESSED & FOREMOST REASONS TO PROCURE THE REPORT:

  • Statistical Analysis of the Past, Current, and Future Trends of the Industry with Validated Market Sizes Data
  • Direct and Indirect Rationales Impacting the Industry
  • In-depth and Micro Analysis of Viable Segments and Sub-segments
  • Companies and Vendors Market Share, Competitive Landscape, and Player Positioning Analysis
  • Demand Side (Consumption) and Supply Side (Production) Perspective and Analysis wherever applicable
  • Key Buyers and End-Users Analysis
  • Value Chain and Manufacturing Cost Structure Analysis wherever relevant
  • Key Marketing Strategies as well as Key Sales Channels adopted in the market
  • Investment Opportunity Analysis & Patents Analysis wherever feasible
  • Technological Road Map & Technical Analysis
  • Robust Research Methodology comprising dynamic mix (65%~35%) of Extensive Primary Research (primary interviews, ad-hoc surveys, questionnaires) and Protracted Secondary Research (proprietary in-house database, paid external databases, publically available validated sources)

Table of Content

  1. CHAPTER 1. Executive Summary
  2. CHAPTER 2. Time Temperature Indicator Labels market – Product Type Analysis
    1. 2.1. Global Time Temperature Indicator Labels Market – Product Type Overview
    2. 2.2. Global Time Temperature Indicator Labels Market Share, by Product Type, 2018 & 2025 (USD Million)
    3. 2.3. Global Time Temperature Indicator Labels Market share, by Product Type, 2018 & 2025 (Units)
    4. 2.4. Color-Based
      1. 2.4.1. Global Color-Based Time Temperature Indicator Labels Market, 2016-2026 (USD Million)
      2. 2.4.2. Global Color-Based Time Temperature Indicator Labels Market, 2016-2026 (Units)
    5. 2.5. Barcode-Based
      1. 2.5.1. Global Barcode-Based Time Temperature Indicator Labels Market, 2016-2026 (USD Million)
      2. 2.5.2. Global Barcode-Based Time Temperature Indicator Labels Market, 2016-2026 (Units)
  3. CHAPTER 3. Time Temperature Indicator Labels market – Label Information Analysis
    1. 3.1. Global Time Temperature Indicator Labels Market – Label Information Overview
    2. 3.2. Global Time Temperature Indicator Labels Market Share, by Label Information, 2018 & 2025 (USD Million)
    3. 3.3. Global Time Temperature Indicator Labels Market share, by Label Information, 2018 & 2025 (Units)
    4. 3.4. Critical Temperature Indicator (CTI)
      1. 3.4.1. Global Critical Temperature Indicator (CTI) Time Temperature Indicator Labels Market, 2016-2026 (USD Million)
      2. 3.4.2. Global Critical Temperature Indicator (CTI) Time Temperature Indicator Labels Market, 2016-2026 (Units)
    5. 3.5. Critical Time Temperature Indicators (CTTI)
      1. 3.5.1. Global Critical Time Temperature Indicators (CTTI) Time Temperature Indicator Labels Market, 2016-2026 (USD Million)
      2. 3.5.2. Global Critical Time Temperature Indicators (CTTI) Time Temperature Indicator Labels Market, 2016-2026 (Units)
    6. 3.6. Time Temperature Indicators (TTI)
      1. 3.6.1. Global Time Temperature Indicators (TTI) Time Temperature Indicator Labels Market, 2016-2026 (USD Million)
      2. 3.6.2. Global Time Temperature Indicators (TTI) Time Temperature Indicator Labels Market, 2016-2026 (Units)
  4. CHAPTER 4. Time Temperature Indicator Labels market – End-User Analysis
    1. 4.1. Global Time Temperature Indicator Labels Market – End-User Overview
    2. 4.2. Global Time Temperature Indicator Labels Market Share, by End-User, 2018 & 2025 (USD Million)
    3. 4.3. Global Time Temperature Indicator Labels Market share, by End-User, 2018 & 2025 (Units)
    4. 4.4. Food and Beverages
      1. 4.4.1. Global Food and Beverages Time Temperature Indicator Labels Market, 2016-2026 (USD Million)
      2. 4.4.2. Global Food and Beverages Time Temperature Indicator Labels Market, 2016-2026 (Units)
    5. 4.5. Pharmaceuticals
      1. 4.5.1. Global Pharmaceuticals Time Temperature Indicator Labels Market, 2016-2026 (USD Million)
      2. 4.5.2. Global Pharmaceuticals Time Temperature Indicator Labels Market, 2016-2026 (Units)
    6. 4.6. Chemicals and Fertilizers
      1. 4.6.1. Global Chemicals and Fertilizers Time Temperature Indicator Labels Market, 2016-2026 (USD Million)
      2. 4.6.2. Global Chemicals and Fertilizers Time Temperature Indicator Labels Market, 2016-2026 (Units)
  5. CHAPTER 5. Time Temperature Indicator Labels market – Regional Analysis
    1. 5.1. Global Time Temperature Indicator Labels Market Regional Overview
    2. 5.2. Global Time Temperature Indicator Labels Market Share, by Region, 2018 & 2025 (Value)
    3. 5.3. Global Time Temperature Indicator Labels Market Share, by Region, 2018 & 2025 (Volume)
    4. 5.4. North America
      1. 5.4.1. North America Time Temperature Indicator Labels Market size and forecast, 2016-2026
      2. 5.4.2. North America Time Temperature Indicator Labels Market, by Country, 2018 - 2025 (USD Million)
      3. 5.4.3. North America Market size and forecast, 2016-2026 (Units)
      4. 5.4.4. North America Time Temperature Indicator Labels Market, by Country, 2018 - 2025 (Units)
      5. 5.4.5. North America Time Temperature Indicator Labels Market, by Product Type, 2016-2026
      6. 5.4.6. North America Time Temperature Indicator Labels Market, by Label Information, 2016-2026
      7. 5.4.7. North America Time Temperature Indicator Labels Market, by End-User, 2016-2026
      8. 5.4.8. U.S.
      9. 5.4.9. Canada
    5. 5.5. Europe
      1. 5.5.1. Europe Time Temperature Indicator Labels Market size and forecast, 2016-2026
      2. 5.5.2. Europe Time Temperature Indicator Labels Market, by Country, 2018 - 2025 (USD Million)
      3. 5.5.3. Europe Market size and forecast, 2016-2026 (Units)
      4. 5.5.4. Europe Time Temperature Indicator Labels Market, by Country, 2018 - 2025 (Units)
      5. 5.5.5. Europe Time Temperature Indicator Labels Market, by Product Type, 2016-2026
      6. 5.5.6. Europe Time Temperature Indicator Labels Market, by Label Information, 2016-2026
      7. 5.5.7. Europe Time Temperature Indicator Labels Market, by End-User, 2016-2026
      8. 5.5.8. Germany
      9. 5.5.9. France
      10. 5.5.10. U.K.
      11. 5.5.11. Italy
      12. 5.5.12. Spain
      13. 5.5.13. Rest of Europe
    6. 5.6. Asia Pacific
      1. 5.6.1. Asia Pacific Time Temperature Indicator Labels Market size and forecast, 2016-2026
      2. 5.6.2. Asia Pacific Time Temperature Indicator Labels Market, by Country, 2018 - 2025 (USD Million)
      3. 5.6.3. Asia Pacific Market size and forecast, 2016-2026 (Units)
      4. 5.6.4. Asia Pacific Time Temperature Indicator Labels Market, by Country, 2018 - 2025 (Units)
      5. 5.6.5. Asia Pacific Time Temperature Indicator Labels Market, by Product Type, 2016-2026
      6. 5.6.6. Asia Pacific Time Temperature Indicator Labels Market, by Label Information, 2016-2026
      7. 5.6.7. Asia Pacific Time Temperature Indicator Labels Market, by End-User, 2016-2026
      8. 5.6.8. China
      9. 5.6.9. Japan
      10. 5.6.10. India
      11. 5.6.11. South Korea
      12. 5.6.12. South-East Asia
      13. 5.6.13. Rest of Asia Pacific
    7. 5.7. Latin America
      1. 5.7.1. Latin America Time Temperature Indicator Labels Market size and forecast, 2016-2026
      2. 5.7.2. Latin America Time Temperature Indicator Labels Market, by Country, 2018 - 2025 (USD Million)
      3. 5.7.3. Latin America Market size and forecast, 2016-2026 (Units)
      4. 5.7.4. Latin America Time Temperature Indicator Labels Market, by Country, 2018 - 2025 (Units)
      5. 5.7.5. Latin America Time Temperature Indicator Labels Market, by Product Type, 2016-2026
      6. 5.7.6. Latin America Time Temperature Indicator Labels Market, by Label Information, 2016-2026
      7. 5.7.7. Latin America Time Temperature Indicator Labels Market, by End-User, 2016-2026
      8. 5.7.8. Brazil
      9. 5.7.9. Mexico
      10. 5.7.10. Rest of Latin America
    8. 5.8. The Middle-East and Africa
      1. 5.8.1. The Middle-East and Africa Time Temperature Indicator Labels Market size and forecast, 2016-2026
      2. 5.8.2. The Middle-East and Africa Time Temperature Indicator Labels Market, by Country, 2018 - 2025 (USD Million)
      3. 5.8.3. The Middle-East and Africa Market size and forecast, 2016-2026 (Units)
      4. 5.8.4. The Middle-East and Africa Time Temperature Indicator Labels Market, by Country, 2018 - 2025 (Units)
      5. 5.8.5. The Middle-East and Africa Time Temperature Indicator Labels Market, by Product Type, 2016-2026
      6. 5.8.6. The Middle-East and Africa Time Temperature Indicator Labels Market, by Label Information, 2016-2026
      7. 5.8.7. The Middle-East and Africa Time Temperature Indicator Labels Market, by End-User, 2016-2026
      8. 5.8.8. GCC Countries
      9. 5.8.9. South Africa
      10. 5.8.10. Rest of Middle-East Africa
  6. CHAPTER 6. Time Temperature Indicator Labels Production, Consumption, Export, Import by Regions
    1. 6.1. Global Time Temperature Indicator Labels production and revenue, 2015-2025 (USD Million) (Units)
    2. 6.2. Global Import and Export Analysis, by Region
  7. CHAPTER 7. Time Temperature Indicator Labels market – Competitive Landscape
    1. 7.1. Competitor Market Share – Revenue
    2. 7.2. Market Concentration Rate Analysis, Top 3 and Top 5 Players
    3. 7.3. Competitor Market Share – Volume
    4. 7.4. Strategic Development
      1. 7.4.1. Acquisitions and Mergers
      2. 7.4.2. New Products
      3. 7.4.3. Research & Development Activities
  8. CHAPTER 8. Company Profiles
    1. 8.1. 3M
      1. 8.1.1. Company Overview
      2. 8.1.2. 3M Sales, Revenue, Price, and Gross Margin
      3. 8.1.3. Product portfolio
      4. 8.1.4. Recent initiatives
    2. 8.2. Thin Film Electronics ASA
      1. 8.2.1. Company Overview
      2. 8.2.2. Thin Film Electronics ASA Sales, Revenue, Price, and Gross Margin
      3. 8.2.3. Product portfolio
      4. 8.2.4. Recent initiatives
    3. 8.3. Freshpoint Quality Assurance Ltd.
      1. 8.3.1. Company Overview
      2. 8.3.2. Freshpoint Quality Assurance Ltd. Sales, Revenue, Price, and Gross Margin
      3. 8.3.3. Product portfolio
      4. 8.3.4. Recent initiatives
    4. 8.4. NiGK Corporation
      1. 8.4.1. Company Overview
      2. 8.4.2. NiGK Corporation Sales, Revenue, Price, and Gross Margin
      3. 8.4.3. Product portfolio
      4. 8.4.4. Recent initiatives
    5. 8.5. LCR Hallcrest, LLC
      1. 8.5.1. Company Overview
      2. 8.5.2. LCR Hallcrest, LLC Sales, Revenue, Price, and Gross Margin
      3. 8.5.3. Product portfolio
      4. 8.5.4. Recent initiatives
    6. 8.6. Biosynergy, Inc.
      1. 8.6.1. Company Overview
      2. 8.6.2. Biosynergy, Inc. Sales, Revenue, Price, and Gross Margin
      3. 8.6.3. Product portfolio
      4. 8.6.4. Recent initiatives
    7. 8.7. Temptime Corporation
      1. 8.7.1. Company Overview
      2. 8.7.2. Temptime Corporation Sales, Revenue, Price, and Gross Margin
      3. 8.7.3. Product portfolio
      4. 8.7.4. Recent initiatives
    8. 8.8. Delta Trak, Inc.
      1. 8.8.1. Company Overview
      2. 8.8.2. Delta Trak, Inc. Sales, Revenue, Price, and Gross Margin
      3. 8.8.3. Product portfolio
      4. 8.8.4. Recent initiatives
    9. 8.9. CCL Industries Inc.
      1. 8.9.1. Company Overview
      2. 8.9.2. CCL Industries Inc. Sales, Revenue, Price, and Gross Margin
      3. 8.9.3. Product portfolio
      4. 8.9.4. Recent initiatives
  9. CHAPTER 9. Time Temperature Indicator Labels — Industry Analysis
    1. 9.1. Introduction and Taxonomy
    2. 9.2. Time Temperature Indicator Labels Market – Key Trends
      1. 9.2.1. Market Drivers
      2. 9.2.2. Market Restraints
      3. 9.2.3. Market Opportunities
    3. 9.3. Value Chain Analysis
    4. 9.4. Key Mandates and Regulations
    5. 9.5. Technology Roadmap and Timeline
    6. 9.6. Time Temperature Indicator Labels market – Attractiveness Analysis
      1. 9.6.1. By Product Type
      2. 9.6.2. By Label Information
      3. 9.6.3. By End-User
      4. 9.6.4. By Region
  10. CHAPTER 10. Raw Material analysis
    1. 10.1. Time Temperature Indicator Labels Key Raw Material Analysis
      1. 10.1.1. Key Raw Materials
      2. 10.1.2. Price Trend of Key Raw Materials
    2. 10.2. Key Suppliers of Raw Materials
    3. 10.3. Proportion of Manufacturing Cost Structure
      1. 10.3.1. Raw Materials
      2. 10.3.2. Labor Cost
    4. 10.4. Manufacturing Expenses Analysis of Time Temperature Indicator Labels
  11. CHAPTER 11. Industrial Chain, Sourcing Strategy and Downstream Buyers
    1. 11.1. Time Temperature Indicator Labels Industrial Chain Analysis
    2. 11.2. Upstream Raw Materials Sourcing
      1. 11.2.1. Risk Mitigation:
      2. 11.2.2. Supplier Relationships:
      3. 11.2.3. Business Processes:
      4. 11.2.4. Securing the Product:
    3. 11.3. Raw Materials Sources of Time Temperature Indicator Labels Major Manufacturers in 2016
    4. 11.4. Downstream Buyers
    5. 11.5. Distributors/Traders List
  12. CHAPTER 12. Marketing Strategy Analysis, Distributors
    1. 12.1. Marketing Channel
    2. 12.2. Direct Marketing
    3. 12.3. Indirect Marketing
    4. 12.4. Marketing Channel Development Trend
    5. 12.5. Economic/Political Environmental Change
  13. CHAPTER 13. Report Conclusion
  14. CHAPTER 14. Research Approach & Methodology
    1. 14.1. Report Description
    2. 14.2. Research Scope
    3. 14.3. Research Methodology
      1. 14.3.1. Secondary Research
      2. 14.3.2. Primary Research
      3. 14.3.3. Models

      List of Figures

      FIG. 1 Global Time Temperature Indicator Labels Market, 2016-2026 (USD Million)
      FIG. 2 Global Time Temperature Indicator Labels Market Share, by Product Type, 2018 & 2025 (USD Million)
      FIG. 3 Global Time Temperature Indicator Labels Market share, by Product Type, 2018 & 2025 (Units)
      FIG. 4 Global Color-Based Time Temperature Indicator Labels Market, 2016-2026 (USD Million)
      FIG. 5 Global Color-Based Time Temperature Indicator Labels  Market, 2016-2026 (Units)
      FIG. 6 Global Barcode-Based Time Temperature Indicator Labels Market, 2016-2026 (USD Million)
      FIG. 7 Global Barcode-Based Time Temperature Indicator Labels  Market, 2016-2026 (Units)
      FIG. 8 Global Time Temperature Indicator Labels Market Share, by Label Information, 2018 & 2025 (USD Million)
      FIG. 9 Global Time Temperature Indicator Labels Market share, by Label Information, 2018 & 2025 (Units)
      FIG. 10 Global Critical Temperature Indicator (CTI) Time Temperature Indicator Labels Market, 2016-2026 (USD Million)
      FIG. 11 Global Critical Temperature Indicator (CTI) Time Temperature Indicator Labels  Market, 2016-2026 (Units)
      FIG. 12 Global Critical Time Temperature Indicators (CTTI) Time Temperature Indicator Labels Market, 2016-2026 (USD Million)
      FIG. 13 Global Critical Time Temperature Indicators (CTTI) Time Temperature Indicator Labels  Market, 2016-2026 (Units)
      FIG. 14 Global Time Temperature Indicators (TTI) Time Temperature Indicator Labels Market, 2016-2026 (USD Million)
      FIG. 15 Global Time Temperature Indicators (TTI) Time Temperature Indicator Labels  Market, 2016-2026 (Units)
      FIG. 16 Global Time Temperature Indicator Labels Market Share, by End-User, 2018 & 2025 (USD Million)
      FIG. 17 Global Time Temperature Indicator Labels Market share, by End-User, 2018 & 2025 (Units)
      FIG. 18 Global Food and Beverages Time Temperature Indicator Labels Market, 2016-2026 (USD Million)
      FIG. 19 Global Food and Beverages Time Temperature Indicator Labels  Market, 2016-2026 (Units)
      FIG. 20 Global Pharmaceuticals Time Temperature Indicator Labels Market, 2016-2026 (USD Million)
      FIG. 21 Global Pharmaceuticals Time Temperature Indicator Labels  Market, 2016-2026 (Units)
      FIG. 22 Global Chemicals and Fertilizers Time Temperature Indicator Labels Market, 2016-2026 (USD Million)
      FIG. 23 Global Chemicals and Fertilizers Time Temperature Indicator Labels  Market, 2016-2026 (Units)
      FIG. 24 Global Time Temperature Indicator Labels Market Share, by Region, 2018 & 2025
      FIG. 25 Global Time Temperature Indicator Labels Market Share, by Region, 2018 & 2025
      FIG. 26 North America Time Temperature Indicator Labels Market, 2016-2026
      FIG. 27 North America Time Temperature Indicator Labels  Market, 2016-2026 (Units)
      FIG. 28 U.S. Time Temperature Indicator Labels Market, 2016-2026
      FIG. 29 U.S. Time Temperature Indicator Labels  Market, 2016-2026 (Units)
      FIG. 30 Canada Time Temperature Indicator Labels Market, 2016-2026
      FIG. 31 Canada Time Temperature Indicator Labels  Market, 2016-2026 (Units)
      FIG. 32 Europe Time Temperature Indicator Labels Market, 2016-2026
      FIG. 33 Europe Time Temperature Indicator Labels  Market, 2016-2026 (Units)
      FIG. 34 Germany Time Temperature Indicator Labels Market, 2016-2026
      FIG. 35 Germany Time Temperature Indicator Labels  Market, 2016-2026 (Units)
      FIG. 36 France Time Temperature Indicator Labels Market, 2016-2026
      FIG. 37 France Time Temperature Indicator Labels  Market, 2016-2026 (Units)
      FIG. 38 U.K. Time Temperature Indicator Labels Market, 2016-2026
      FIG. 39 U.K. Time Temperature Indicator Labels  Market, 2016-2026 (Units)
      FIG. 40 Italy Time Temperature Indicator Labels Market, 2016-2026
      FIG. 41 Italy Time Temperature Indicator Labels  Market, 2016-2026 (Units)
      FIG. 42 Spain Time Temperature Indicator Labels Market, 2016-2026
      FIG. 43 Spain Time Temperature Indicator Labels  Market, 2016-2026 (Units)
      FIG. 44 Rest of Europe Time Temperature Indicator Labels Market, 2016-2026
      FIG. 45 Rest of Europe Time Temperature Indicator Labels  Market, 2016-2026 (Units)
      FIG. 46 Asia Pacific Time Temperature Indicator Labels Market, 2016-2026
      FIG. 47 Asia Pacific Time Temperature Indicator Labels  Market, 2016-2026 (Units)
      FIG. 48 China Time Temperature Indicator Labels Market, 2016-2026
      FIG. 49 China Time Temperature Indicator Labels  Market, 2016-2026 (Units)
      FIG. 50 Japan Time Temperature Indicator Labels Market, 2016-2026
      FIG. 51 Japan Time Temperature Indicator Labels  Market, 2016-2026 (Units)
      FIG. 52 India Time Temperature Indicator Labels Market, 2016-2026
      FIG. 53 India Time Temperature Indicator Labels  Market, 2016-2026 (Units)
      FIG. 54 South  Korea Time Temperature Indicator Labels Market, 2016-2026
      FIG. 55 South  Korea Time Temperature Indicator Labels  Market, 2016-2026 (Units)
      FIG. 56 South-East Asia Time Temperature Indicator Labels Market, 2016-2026
      FIG. 57 South-East Asia Time Temperature Indicator Labels  Market, 2016-2026 (Units)
      FIG. 58 Rest of Asia Pacific Time Temperature Indicator Labels Market, 2016-2026
      FIG. 59 Rest of Asia Pacific Time Temperature Indicator Labels  Market, 2016-2026 (Units)
      FIG. 60 Latin America Time Temperature Indicator Labels Market, 2016-2026
      FIG. 61 Latin America Time Temperature Indicator Labels  Market, 2016-2026 (Units)
      FIG. 62 Brazil Time Temperature Indicator Labels Market, 2016-2026
      FIG. 63 Brazil Time Temperature Indicator Labels  Market, 2016-2026 (Units)
      FIG. 64 Mexico Time Temperature Indicator Labels Market, 2016-2026
      FIG. 65 Mexico Time Temperature Indicator Labels  Market, 2016-2026 (Units)
      FIG. 66 Rest of Latin America Time Temperature Indicator Labels Market, 2016-2026
      FIG. 67 Rest of Latin America Time Temperature Indicator Labels  Market, 2016-2026 (Units)
      FIG. 68 The Middle-East and Africa Time Temperature Indicator Labels Market, 2016-2026
      FIG. 69 The Middle-East and Africa Time Temperature Indicator Labels  Market, 2016-2026 (Units)
      FIG. 70 GCC Countries Time Temperature Indicator Labels Market, 2016-2026
      FIG. 71 GCC Countries Time Temperature Indicator Labels  Market, 2016-2026 (Units)
      FIG. 72 South Africa Time Temperature Indicator Labels Market, 2016-2026
      FIG. 73 South Africa Time Temperature Indicator Labels  Market, 2016-2026 (Units)
      FIG. 74 Rest of Middle-East Africa Time Temperature Indicator Labels Market, 2016-2026
      FIG. 75 Rest of Middle-East Africa Time Temperature Indicator Labels  Market, 2016-2026 (Units)
      FIG. 76 Global Time Temperature Indicator Labels production and revenue, 2015-2025 (USD Million) (Units)
      FIG. 77 North America Time Temperature Indicator Labels production and revenue, 2015-2025 (USD Million) (Units)
      FIG. 78 Europe Time Temperature Indicator Labels production and revenue, 2015-2025 (USD Million) (Units)
      FIG. 79 Asia Pacific Time Temperature Indicator Labels production and revenue, 2015-2025 (USD Million) (Units)
      FIG. 80 Latin America Time Temperature Indicator Labels production and revenue, 2015-2025 (USD Million) (Units)
      FIG. 81 Middle East and Africa Time Temperature Indicator Labels production and revenue, 2015-2025 (USD Million) (Units)
      FIG. 82 Competitor Market Share – Revenue
      FIG. 83 Competitor Market Share – Volume
      FIG. 84 3M Revenue and Growth Rate
      FIG. 85 3M Market Share
      FIG. 86 Thin Film Electronics ASA Revenue and Growth Rate
      FIG. 87 Thin Film Electronics ASA Market Share
      FIG. 88 Freshpoint Quality Assurance Ltd. Revenue and Growth Rate
      FIG. 89 Freshpoint Quality Assurance Ltd. Market Share
      FIG. 90 NiGK Corporation Revenue and Growth Rate
      FIG. 91 NiGK Corporation Market Share
      FIG. 92 LCR Hallcrest, LLC Revenue and Growth Rate
      FIG. 93 LCR Hallcrest, LLC Market Share
      FIG. 94 Biosynergy, Inc. Revenue and Growth Rate
      FIG. 95 Biosynergy, Inc. Market Share
      FIG. 96 Temptime Corporation Revenue and Growth Rate
      FIG. 97 Temptime Corporation Market Share
      FIG. 98 Delta Trak, Inc. Revenue and Growth Rate
      FIG. 99 Delta Trak, Inc. Market Share
      FIG. 100 CCL Industries Inc. Revenue and Growth Rate
      FIG. 101 CCL Industries Inc. Market Share
      FIG. 102 Market Dynamics
      FIG. 103 Global Time Temperature Indicator Labels – Value Chain Analysis
      FIG. 104 Key Mandates and Regulations
      FIG. 105 Technology Roadmap and Timeline
      FIG. 106 Market Attractiveness Analysis – By Product Type
      FIG. 107 Market Attractiveness Analysis – By Label Information
      FIG. 108 Market Attractiveness Analysis – By End-User
      FIG. 109 Market Attractiveness Analysis – By Region
      FIG. 110 Manufacturing Cost Structure of Time Temperature Indicator Labels
      FIG. 111 Time Temperature Indicator Labels Industrial Chain Analysis
      FIG. 112 Market Channel
      FIG. 113 Marketing Channel Development Trend
      FIG. 114 Growth in World Gross Product, 2008-2018


      List of Tables

      TABLE 1 Global Time Temperature Indicator Labels market, 2018 & 2025 (USD Million)
      TABLE 2 Global Time Temperature Indicator Labels market, by Product Type, 2016-2026 (USD Million)
      TABLE 3 Global Time Temperature Indicator Labels market, by Product Type, 2016-2026 (Units)
      TABLE 4 Global Time Temperature Indicator Labels market, by Label Information, 2016-2026 (USD Million)
      TABLE 5 Global Time Temperature Indicator Labels market, by Label Information, 2016-2026 (Units)
      TABLE 6 Global Time Temperature Indicator Labels market, by End-User, 2016-2026 (USD Million)
      TABLE 7 Global Time Temperature Indicator Labels market, by End-User, 2016-2026 (Units)
      TABLE 8 Global Time Temperature Indicator Labels market, by region, 2016-2026 (USD Million)
      TABLE 9 Global Time Temperature Indicator Labels market, by region, 2016-2026 (Units)
      TABLE 10 North America Time Temperature Indicator Labels Market, by Product Type, 2016-2026 (USD Million)
      TABLE 11 North America Time Temperature Indicator Labels Market, by Product Type, 2016-2026 (Units)
      TABLE 12 North America Time Temperature Indicator Labels Market, by Label Information, 2016-2026 (USD Million)
      TABLE 13 North America Time Temperature Indicator Labels Market, by Label Information, 2016-2026 (Units)
      TABLE 14 North America Time Temperature Indicator Labels Market, by End-User, 2016-2026 (USD Million)
      TABLE 15 North America Time Temperature Indicator Labels Market, by End-User, 2016-2026 (Units)
      TABLE 16 Europe Time Temperature Indicator Labels Market, by Product Type, 2016-2026 (USD Million)
      TABLE 17 Europe Time Temperature Indicator Labels Market, by Product Type, 2016-2026 (Units)
      TABLE 18 Europe Time Temperature Indicator Labels Market, by Label Information, 2016-2026 (USD Million)
      TABLE 19 Europe Time Temperature Indicator Labels Market, by Label Information, 2016-2026 (Units)
      TABLE 20 Europe Time Temperature Indicator Labels Market, by End-User, 2016-2026 (USD Million)
      TABLE 21 Europe Time Temperature Indicator Labels Market, by End-User, 2016-2026 (Units)
      TABLE 22 Asia Pacific Time Temperature Indicator Labels Market, by Product Type, 2016-2026 (USD Million)
      TABLE 23 Asia Pacific Time Temperature Indicator Labels Market, by Product Type, 2016-2026 (Units)
      TABLE 24 Asia Pacific Time Temperature Indicator Labels Market, by Label Information, 2016-2026 (USD Million)
      TABLE 25 Asia Pacific Time Temperature Indicator Labels Market, by Label Information, 2016-2026 (Units)
      TABLE 26 Asia Pacific Time Temperature Indicator Labels Market, by End-User, 2016-2026 (USD Million)
      TABLE 27 Asia Pacific Time Temperature Indicator Labels Market, by End-User, 2016-2026 (Units)
      TABLE 28 Latin America Time Temperature Indicator Labels Market, by Product Type, 2016-2026 (USD Million)
      TABLE 29 Latin America Time Temperature Indicator Labels Market, by Product Type, 2016-2026 (Units)
      TABLE 30 Latin America Time Temperature Indicator Labels Market, by Label Information, 2016-2026 (USD Million)
      TABLE 31 Latin America Time Temperature Indicator Labels Market, by Label Information, 2016-2026 (Units)
      TABLE 32 Latin America Time Temperature Indicator Labels Market, by End-User, 2016-2026 (USD Million)
      TABLE 33 Latin America Time Temperature Indicator Labels Market, by End-User, 2016-2026 (Units)
      TABLE 34 The Middle-East and Africa Time Temperature Indicator Labels Market, by Product Type, 2016-2026 (USD Million)
      TABLE 35 The Middle-East and Africa Time Temperature Indicator Labels Market, by Product Type, 2016-2026 (Units)
      TABLE 36 The Middle-East and Africa Time Temperature Indicator Labels Market, by Label Information, 2016-2026 (USD Million)
      TABLE 37 The Middle-East and Africa Time Temperature Indicator Labels Market, by Label Information, 2016-2026 (Units)
      TABLE 38 The Middle-East and Africa Time Temperature Indicator Labels Market, by End-User, 2016-2026 (USD Million)
      TABLE 39 The Middle-East and Africa Time Temperature Indicator Labels Market, by End-User, 2016-2026 (Units)
      TABLE 40 North America Time Temperature Indicator Labels Production, Consumption, Export, Import, 2016-2019
      TABLE 41 Europe Time Temperature Indicator Labels Production, Consumption, Export, Import, 2016-2019
      TABLE 42 Asia Pacific Time Temperature Indicator Labels Production, Consumption, Export, Import, 2016-2019
      TABLE 43 Latin America Time Temperature Indicator Labels Production, Consumption, Export, Import, 2016-2019
      TABLE 44 Middle East & Africa Time Temperature Indicator Labels Production, Consumption, Export, Import, 2016-2019
      TABLE 45 Global Time Temperature Indicator Labels Market - Company Revenue Analysis 2016-2019 (USD Million)
      TABLE 46 Global Time Temperature Indicator Labels Market - Company Revenue Share Analysis 2016-2019(%)
      TABLE 47 Global Time Temperature Indicator Labels Market - Company Volume Analysis 2016-2019 (Units)
      TABLE 48 Global Time Temperature Indicator Labels Market - Company Volume Share Analysis 2016-2019(%)
      TABLE 49 Acquisitions and Mergers
      TABLE 50 New Product/Service Launch
      TABLE 51 Research & Development Activities
      TABLE 52 Market Drivers
      TABLE 53 Market Restraints
      TABLE 54 Market Opportunities
      TABLE 55 Production Base and Market Concentration Rate of Raw Material
      TABLE 56 Key Suppliers of Raw Materials
      TABLE 57 Raw Materials Sources of Time Temperature Indicator Labels Major Manufacturers in 2016
      TABLE 58 Major Buyers of Time Temperature Indicator Labels
      TABLE 59 Distributors/Traders of Time Temperature Indicator Labels by Region

Industry Major Market Players

  • 3M
  • Thin Film Electronics ASA
  • Freshpoint Quality Assurance Ltd.
  • NiGK Corporation
  • LCR Hallcrest, LLC
  • Biosynergy, Inc.
  • Temptime Corporation
  • Delta Trak, Inc.
  • CCL Industries Inc.