Search Market Research Report

Discover Our Latest Reports
Discover Our Featured Reports
Discover Top Selling Reports

Thermal Energy Storage Market Size, Share Global Analysis Report, 2020–2026

report img

Thermal Energy Storage Market By Technology (Sensible Heat Storage, Latent Heat Storage, and Thermal Heat Storage); By Storage Material (Water, Molten Salt, Phase Change Material (PCM), and Others); By End Users (Commercial and Industrial, Utilities, and Residential): Global Industry Outlook, Market Size, Business Intelligence, Consumer Preferences, Statistical Surveys, Comprehensive Analysis, Historical Developments, Current Trends, and Forecast 2020–2026

Industry Insights

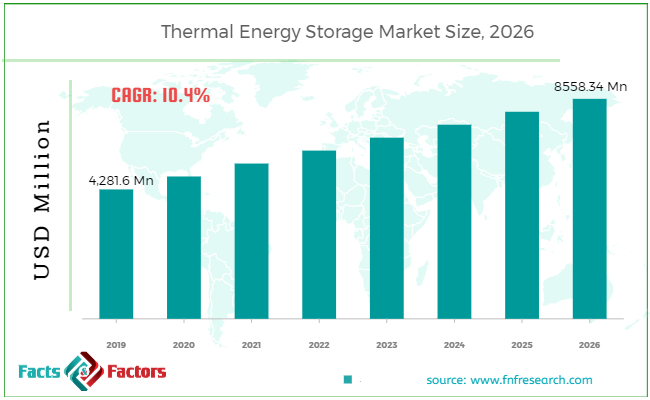
[220+ Pages Report] According to the report published by Facts Factors, the global thermal energy storage market size was worth around USD 4,281.6 million in 2019 and is predicted to grow to around USD 8558.34 million by 2026 with a compound annual growth rate (CAGR) of roughly 10.4% between 2020 and 2026. The report analyzes the global thermal energy storage market drivers, restraints/challenges, and the effect they have on the demands during the projection period. In addition, the report explores emerging opportunities in the thermal energy storage market.

Thermal Energy Storage Market Size

To know more about this report | Request Free Sample Copy

This specialized and expertise oriented industry research report scrutinizes the technical and commercial business outlook of the thermal energy storage industry. The report analyzes and declares the historical and current trends analysis of the thermal energy storage industry and subsequently recommends the projected trends anticipated to be observed in the thermal energy storage market in the upcoming years.

The thermal energy storage market report analyzes and notifies the industry statistics at the global as well as regional and country levels in order to acquire a thorough perspective of the entire thermal energy storage market. The historical and past insights are provided for FY 2016 to FY 2019 whereas projected trends are delivered for FY 2020 to FY 2026. The quantitative and numerical data is represented in terms of both volumes (Units) and value (USD Million) from FY 2016 – 2026.


logoKey Insights from Primary Research        

  • As per primary respondents, the global thermal energy storage market is set to grow annually at a CAGR rate of 10.4%. In 2019, the market is valued at around USD 4,281.6Million and is expected to reach around USD 8558.34 Million by 2026.
  • On basis of the technology segment, ‘latent heat storage’ dominated the global thermal energy storage market in 2019. The latent heat storage segment will grow at a CAGR rate of 10.2% over the forecast period. Sensible heat storage is anticipated to be the fastest-growing segment during the forecast timeline.
  • On basis of the storage material segment, ‘molten salt’ dominated the global thermal energy storage market in 2019. This segment is anticipated to grow at a CAGR rate of 10.3%.
  • On basis of the end-users segment, ‘commercial and industrial’ dominated the global thermal energy storage market in 2019. This segment is projected to grow at a CAGR rate of 10.0%. The ‘residential’ segment is anticipated to be the fastest-growing segment during 2020-2026.
  • As per primary respondents, North America is the leading market in 2019 owing to the presence of a huge number of vendors coupled with numerous thermal projects is under construction in the United States.

logoKey Recommendations from Analysts

  • As per our analysts, the global thermal energy storage market is expected to grow significantly over the forecast period.
  • As per analysts, the lack of technical expertise and technological barriers are expected to curb market growth.
  • As per our analysts, government incentive programs for installing energy efficiency solutions are driving the market growth in recent years.
  • The strategic and competitive advantage provided by government initiatives regarding sustainable technology adoption will aid in achieving the established carbon emission reduction targets and thus it has been estimated to stimulate the market demand globally.
  • Our team of analysts has identified, that The Asia Pacific region is expected to be the fastest-growing regional segment in the next six years is due to rapid growth in urbanization and population in developing nations such as India, South Korea, China, Indonesia, and Malaysia.

The quantitative data is further underlined and reinforced by comprehensive qualitative data which comprises various across-the-board market dynamics. The rationales which directly or indirectly impact the thermal energy storage industry are exemplified through parameters such as growth drivers, restraints, challenges, and opportunities among other impacting factors.

Throughout our research report, we have encompassed all the proven models and tools of industry analysis and extensively illustrated all the key business strategies and business models adopted in the thermal energy storage industry. The report provides an all-inclusive and detailed competitive landscape prevalent in the thermal energy storage market.

The report utilizes established industry analysis tools and models such as Porter’s Five Forces framework to analyze and recognize critical business strategies adopted by various stakeholders involved in the entire value chain of the thermal energy storage industry. The thermal energy storage market report additionally employs SWOT analysis and PESTLE analysis models for further in-depth analysis.

The report study further includes an in-depth analysis of industry players' market shares and provides an overview of leading players' market position in the thermal energy storage sector. Key strategic developments in the thermal energy storage market competitive landscape such as acquisitions & mergers, inaugurations of different products and services, partnerships & joint ventures, MoU agreements, VC & funding activities, R&D activities, and geographic expansion among other noteworthy activities by key players of the thermal energy storage market are appropriately highlighted in the report.

Growing construction sector revenues, from both publicly and privately funded projects across the globe and the emergence of energy-efficient solutions, are the major factors that are boosting the demand for thermal energy storage systems in the market. Moreover, the refrigeration and supply of cooling systems have become important across food &beverages, and pharmaceuticals markets to prevent spoilage of food and medicines. Henceforth, a substantial increase in demand for HVAC systems has fueled the sales of thermal energy storage systems. However, technology barriers and lack of technical expertise are expected to hinder the market growth over the forecast years. Furthermore, rising momentum on renewable energy generation such as concentrated solar power is anticipated to proliferate the growth of the thermal energy storage market in upcoming years.

The thermal energy storage market research report delivers an acute valuation and taxonomy of the thermal energy storage industry by practically splitting the market on the basis of different types, applications, and regions. Through the analysis of the historical and projected trends, all the segments and sub-segments were evaluated through the bottom-up approach, and different market sizes have been projected for FY 2020 to FY 2026.

The regional segmentation of the thermal energy storage industry includes the complete classification of all the major continents including North America, Latin America, Europe, Asia Pacific, and the Middle East & Africa. Further, country-wise data for the thermal energy storage industry is provided for the leading economies of the world.

The global thermal energy storage market has been segmented into technology, storage material, and end-users. The technology has been categorized into sensible heat storage, latent heat storage, and thermal heat storage. The storage material has been classified into the water, molten salt, and phase change material (PCM), among others. The end-user has been fragmented into commercial and industrial, utilities, and residential.

logoReport Scope

Report Attribute

Details

Market Size in 2019

USD 4,281.6 Million

Projected Market Size in 2026

USD 8558.34 Million

CAGR Growth Rate

10.4% CAGR

Base Year

2021

Forecast Years

2022-2028

Key Market Players

Baltimore Aircoil International, Cryogel Thermal Energy Storage, Caldwell Energy Company, Dunham Bush, EVAPCO Inc., CALMAC (Trane), Cristopia (CIAT UK), Araner, Nostromo, FVB Energy Inc., Ground Sun Ltd., Viking Cold Solutions, DN Tanks, Vogt Ice, and Sunwell, , and Others

Key Segment

By Technology , By Storage Material, By End Users, and By Region

Major Regions Covered

North America, Europe, Asia Pacific, Latin America, and the Middle East & Africa

Purchase Options

Request customized purchase options to meet your research needs. Explore purchase options

logoSome of the essential players operating in the global thermal energy storage market, but not restricted to include

  •  Baltimore
  •  Aircoil International
  •  Cryogel Thermal Energy Storage
  •  Caldwell Energy Company 
  •  Dunham Bush 
  •  EVAPCO, Inc.
  •  CALMAC (Trane)
  •  Cristopia (CIAT UK)
  •  Araner, Nostromo
  •  FVB Energy Inc. 
  •  Ground Sun Ltd 
  •  Viking Cold Solutions 
  •  DN Tanks 
  •  Vogt Ice 
  •  Sunwell

The taxonomy of the thermal energy storage market by its scope and segmentation is as follows:

logoBy TechnologySegmentation Analysis

  • Sensible Heat Storage
  • Latent Heat Storage
  • Thermal Heat Storage

logoBy Storage Material Segmentation Analysis

  • Water
  • Molten Salt
  • Phase Change Material (PCM)
  • Others

logoBy End UsersSegmentation Analysis

  • Commercial and Industrial
  • Utilities
  • Residential

logoBy Regional Segmentation Analysis

  • North America
    • The U.S.
    • Canada
  • Europe
    • Germany
    • The UK
    • France
    • Spain
    • Italy
    • Rest of Europe
  • Asia Pacific
    • China
    • Japan
    • India
    • South Korea
    • Southeast Asia
    • Rest of Asia Pacific
  • Latin America
    • Brazil
    • Mexico
    • Rest of Latin America
  • Middle East & Africa
    • GCC
    • South Africa
    • Rest of Middle East & Africa

Table of Content

  1. Chapter 1 Executive Summary
    1. 1.1. Introduction of Thermal Energy Storage
    2. 1.2. Global Thermal Energy Storage Market, 2019 & 2026 (USD Million)
    3. 1.3. Global Thermal Energy Storage Market, 2016 – 2026 (USD Million)
    4. 1.4. Global Thermal Energy Storage Market Absolute Revenue Opportunity, 2016 – 2026 (USD Million)
    5. 1.5. Global Thermal Energy Storage Market Incremental Revenue Opportunity, 2020 – 2026 (USD Million)
  2. Chapter 2 Thermal Energy Storage Market – Technology Analysis
    1. 2.1. Global Thermal Energy Storage Market – Technology Overview
    2. 2.2. Global Thermal Energy Storage Market Share, by Technology, 2019 & 2026 (USD Million)
    3. 2.3. Sensible Heat Storage
      1. 2.3.1. Global Sensible Heat Storage Thermal Energy Storage Market, 2016 – 2026 (USD Million)
    4. 2.4. Latent Heat Storage
      1. 2.4.1. Global Latent Heat Storage Thermal Energy Storage Market, 2016 – 2026 (USD Million)
    5. 2.5. Thermal Heat Storage
      1. 2.5.1. Global Thermal Heat Storage Thermal Energy Storage Market, 2016 – 2026 (USD Million)
  3. Chapter 3 Thermal Energy Storage Market – Storage Material Analysis
    1. 3.1. Global Thermal Energy Storage Market – Storage Material Overview
    2. 3.2. Global Thermal Energy Storage Market Share, by Storage Material, 2019 & 2026 (USD Million)
    3. 3.3. Water
      1. 3.3.1. Global Water Thermal Energy Storage Market, 2016 – 2026 (USD Million)
    4. 3.4. Molten Salt
      1. 3.4.1. Global Molten Salt Thermal Energy Storage Market, 2016 – 2026 (USD Million)
    5. 3.5. Phase Change Material (PCM)
      1. 3.5.1. Global Phase Change Material (PCM) Thermal Energy Storage Market, 2016 – 2026 (USD Million)
    6. 3.6. Others
      1. 3.6.1. Global Others Thermal Energy Storage Market, 2016 – 2026 (USD Million)
  4. Chapter 4 Thermal Energy Storage Market – End Users Analysis
    1. 4.1. Global Thermal Energy Storage Market – End Users Overview
    2. 4.2. Global Thermal Energy Storage Market Share, by End Users, 2019 & 2026 (USD Million)
    3. 4.3. Commercial and Industrial
      1. 4.3.1. Global Commercial and Industrial Thermal Energy Storage Market, 2016 – 2026 (USD Million)
    4. 4.4. Utilities
      1. 4.4.1. Global Utilities Thermal Energy Storage Market, 2016 – 2026 (USD Million)
    5. 4.5. Residential
      1. 4.5.1. Global Residential Thermal Energy Storage Market, 2016 – 2026 (USD Million)
  5. Chapter 5 Thermal Energy Storage Market – Regional Analysis
    1. 5.1. Global Thermal Energy Storage Market Regional Overview
    2. 5.2. Global Thermal Energy Storage Market Share, by Region, 2019 & 2026 (USD Million)
    3. 5.3. North America
      1. 5.3.1. North America Thermal Energy Storage Market, 2016 – 2026 (USD Million)
        1. 5.3.1.1. North America Thermal Energy Storage Market, by Country, 2016 - 2026 (USD Million)
      2. 5.3.2. North America Thermal Energy Storage Market, by Technology, 2016 – 2026
        1. 5.3.2.1. North America Thermal Energy Storage Market, by Technology, 2016 – 2026 (USD Million)
      3. 5.3.3. North America Thermal Energy Storage Market, by Storage Material, 2016 – 2026
        1. 5.3.3.1. North America Thermal Energy Storage Market, by Storage Material, 2016 – 2026 (USD Million)
      4. 5.3.4. North America Thermal Energy Storage Market, by End Users, 2016 – 2026
        1. 5.3.4.1. North America Thermal Energy Storage Market, by End Users, 2016 – 2026 (USD Million)
          1. 5.3.5. U.S.
            1. 5.3.5.1. U.S. Thermal Energy Storage Market, 2016 – 2026 (USD Million)
      5. 5.3.6. Canada
        1. 5.3.6.1. Canada Thermal Energy Storage Market, 2016 – 2026 (USD Million)
    4. 5.4. Europe
      1. 5.4.1. Europe Thermal Energy Storage Market, 2016 – 2026 (USD Million)
        1. 5.4.1.1. Europe Thermal Energy Storage Market, by Country, 2016 - 2026 (USD Million)
      2. 5.4.2. Europe Thermal Energy Storage Market, by Technology, 2016 – 2026
        1. 5.4.2.1. Europe Thermal Energy Storage Market, by Technology, 2016 – 2026 (USD Million)
      3. 5.4.3. Europe Thermal Energy Storage Market, by Storage Material, 2016 – 2026
        1. 5.4.3.1. Europe Thermal Energy Storage Market, by Storage Material, 2016 – 2026 (USD Million)
      4. 5.4.4. Europe Thermal Energy Storage Market, by End Users, 2016 – 2026
        1. 5.4.4.1. Europe Thermal Energy Storage Market, by End Users, 2016 – 2026 (USD Million)
      5. 5.4.5. Germany
        1. 5.4.5.1. Germany Thermal Energy Storage Market, 2016 – 2026 (USD Million)
      6. 5.4.6. France
        1. 5.4.6.1. France Thermal Energy Storage Market, 2016 – 2026 (USD Million)
          1. 5.4.7. U.K.
            1. 5.4.7.1. U.K. Thermal Energy Storage Market, 2016 – 2026 (USD Million)
      7. 5.4.8. Italy
        1. 5.4.8.1. Italy Thermal Energy Storage Market, 2016 – 2026 (USD Million)
      8. 5.4.9. Spain
        1. 5.4.9.1. Spain Thermal Energy Storage Market, 2016 – 2026 (USD Million)
      9. 5.4.10. Rest of Europe
        1. 5.4.10.1. Rest of Europe Thermal Energy Storage Market, 2016 – 2026 (USD Million)
    5. 5.5. Asia Pacific
      1. 5.5.1. Asia Pacific Thermal Energy Storage Market, 2016 – 2026 (USD Million)
        1. 5.5.1.1. Asia Pacific Thermal Energy Storage Market, by Country, 2016 - 2026 (USD Million)
      2. 5.5.2. Asia Pacific Thermal Energy Storage Market, by Technology, 2016 – 2026
        1. 5.5.2.1. Asia Pacific Thermal Energy Storage Market, by Technology, 2016 – 2026 (USD Million)
      3. 5.5.3. Asia Pacific Thermal Energy Storage Market, by Storage Material, 2016 – 2026
        1. 5.5.3.1. Asia Pacific Thermal Energy Storage Market, by Storage Material, 2016 – 2026 (USD Million)
      4. 5.5.4. Asia Pacific Thermal Energy Storage Market, by End Users, 2016 – 2026
        1. 5.5.4.1. Asia Pacific Thermal Energy Storage Market, by End Users, 2016 – 2026 (USD Million)
      5. 5.5.5. China
        1. 5.5.5.1. China Thermal Energy Storage Market, 2016 – 2026 (USD Million)
      6. 5.5.6. Japan
        1. 5.5.6.1. Japan Thermal Energy Storage Market, 2016 – 2026 (USD Million)
      7. 5.5.7. India
        1. 5.5.7.1. India Thermal Energy Storage Market, 2016 – 2026 (USD Million)
      8. 5.5.8. South Korea
        1. 5.5.8.1. South Korea Thermal Energy Storage Market, 2016 – 2026 (USD Million)
      9. 5.5.9. South-East Asia
        1. 5.5.9.1. South-East Asia Thermal Energy Storage Market, 2016 – 2026 (USD Million)
      10. 5.5.10. Rest of Asia Pacific
        1. 5.5.10.1. Rest of Asia Pacific Thermal Energy Storage Market, 2016 – 2026 (USD Million)
    6. 5.6. Latin America
      1. 5.6.1. Latin America Thermal Energy Storage Market, 2016 – 2026 (USD Million)
        1. 5.6.1.1. Latin America Thermal Energy Storage Market, by Country, 2016 - 2026 (USD Million)
      2. 5.6.2. Latin America Thermal Energy Storage Market, by Technology, 2016 – 2026
        1. 5.6.2.1. Latin America Thermal Energy Storage Market, by Technology, 2016 – 2026 (USD Million)
      3. 5.6.3. Latin America Thermal Energy Storage Market, by Storage Material, 2016 – 2026
        1. 5.6.3.1. Latin America Thermal Energy Storage Market, by Storage Material, 2016 – 2026 (USD Million)
      4. 5.6.4. Latin America Thermal Energy Storage Market, by End Users, 2016 – 2026
        1. 5.6.4.1. Latin America Thermal Energy Storage Market, by End Users, 2016 – 2026 (USD Million)
      5. 5.6.5. Brazil
        1. 5.6.5.1. Brazil Thermal Energy Storage Market, 2016 – 2026 (USD Million)
      6. 5.6.6. Mexico
        1. 5.6.6.1. Mexico Thermal Energy Storage Market, 2016 – 2026 (USD Million)
      7. 5.6.7. Rest of Latin America
        1. 5.6.7.1. Rest of Latin America Thermal Energy Storage Market, 2016 – 2026 (USD Million)
    7. 5.7. The Middle-East and Africa
      1. 5.7.1. The Middle-East and Africa Thermal Energy Storage Market, 2016 – 2026 (USD Million)
        1. 5.7.1.1. The Middle-East and Africa Thermal Energy Storage Market, by Country, 2016 - 2026 (USD Million)
      2. 5.7.2. The Middle-East and Africa Thermal Energy Storage Market, by Technology, 2016 – 2026
        1. 5.7.2.1. The Middle-East and Africa Thermal Energy Storage Market, by Technology, 2016 – 2026 (USD Million)
      3. 5.7.3. The Middle-East and Africa Thermal Energy Storage Market, by Storage Material, 2016 – 2026
        1. 5.7.3.1. The Middle-East and Africa Thermal Energy Storage Market, by Storage Material, 2016 – 2026 (USD Million)
      4. 5.7.4. The Middle-East and Africa Thermal Energy Storage Market, by End Users, 2016 – 2026
        1. 5.7.4.1. The Middle-East and Africa Thermal Energy Storage Market, by End Users, 2016 – 2026 (USD Million)
      5. 5.7.5. GCC Countries
        1. 5.7.5.1. GCC Countries Thermal Energy Storage Market, 2016 – 2026 (USD Million)
      6. 5.7.6. South Africa
        1. 5.7.6.1. South Africa Thermal Energy Storage Market, 2016 – 2026 (USD Million)
      7. 5.7.7. Rest of Middle-East Africa
        1. 5.7.7.1. Rest of Middle-East Africa Thermal Energy Storage Market, 2016 – 2026 (USD Million)
  6. Chapter 6 Thermal Energy Storage Market – Competitive Landscape
    1. 6.1. Competitor Market Share – Revenue
    2. 6.2. Market Concentration Rate Analysis, Top 3 and Top 5 Players
    3. 6.3. Strategic Developments
      1. 6.3.1. Acquisitions and Mergers
      2. 6.3.2. New Products
      3. 6.3.3. Research & Development Activities
  7. Chapter 7 Company Profiles
    1. 7.1. Baltimore
      1. 7.1.1. Company Overview
      2. 7.1.2. Product/Service Portfolio
      3. 7.1.3. Baltimore Sales, Revenue, and Gross Margin
      4. 7.1.4. Baltimore Revenue and Growth Rate
      5. 7.1.5. Baltimore Market Share
      6. 7.1.6. Recent Initiatives, Funding/VC Activities, and Technological Innovations
    2. 7.2. Cryogel
      1. 7.2.1. Company Overview
      2. 7.2.2. Product/Service Portfolio
      3. 7.2.3. Cryogel Sales, Revenue, and Gross Margin
      4. 7.2.4. Cryogel Revenue and Growth Rate
      5. 7.2.5. Cryogel Market Share
      6. 7.2.6. Recent Initiatives, Funding/VC Activities, and Technological Innovations
    3. 7.3. Dunham Bush
      1. 7.3.1. Company Overview
      2. 7.3.2. Product/Service Portfolio
      3. 7.3.3. Dunham Bush Sales, Revenue, and Gross Margin
      4. 7.3.4. Dunham Bush Revenue and Growth Rate
      5. 7.3.5. Dunham Bush Market Share
      6. 7.3.6. Recent Initiatives, Funding/VC Activities, and Technological Innovations
    4. 7.4. EVAPCO, Inc.
      1. 7.4.1. Company Overview
      2. 7.4.2. Product/Service Portfolio
      3. 7.4.3. EVAPCO, Inc. Sales, Revenue, and Gross Margin
      4. 7.4.4. EVAPCO, Inc. Revenue and Growth Rate
      5. 7.4.5. EVAPCO, Inc. Market Share
      6. 7.4.6. Recent Initiatives, Funding/VC Activities, and Technological Innovations
    5. 7.5. CALMAC (Trane)
      1. 7.5.1. Company Overview
      2. 7.5.2. Product/Service Portfolio
      3. 7.5.3. CALMAC (Trane) Sales, Revenue, and Gross Margin
      4. 7.5.4. CALMAC (Trane) Revenue and Growth Rate
      5. 7.5.5. CALMAC (Trane) Market Share
      6. 7.5.6. Recent Initiatives, Funding/VC Activities, and Technological Innovations
    6. 7.6. Cristopia (CIAT UK)
      1. 7.6.1. Company Overview
      2. 7.6.2. Product/Service Portfolio
      3. 7.6.3. Cristopia (CIAT UK) Sales, Revenue, and Gross Margin
      4. 7.6.4. Cristopia (CIAT UK) Revenue and Growth Rate
      5. 7.6.5. Cristopia (CIAT UK) Market Share
      6. 7.6.6. Recent Initiatives, Funding/VC Activities, and Technological Innovations
    7. 7.7. Araner
      1. 7.7.1. Company Overview
      2. 7.7.2. Product/Service Portfolio
      3. 7.7.3. Araner Sales, Revenue, and Gross Margin
      4. 7.7.4. Araner Revenue and Growth Rate
      5. 7.7.5. Araner Market Share
      6. 7.7.6. Recent Initiatives, Funding/VC Activities, and Technological Innovations
    8. 7.8. Nostromo
      1. 7.8.1. Company Overview
      2. 7.8.2. Product/Service Portfolio
      3. 7.8.3. Nostromo Sales, Revenue, and Gross Margin
      4. 7.8.4. Nostromo Revenue and Growth Rate
      5. 7.8.5. Nostromo Market Share
      6. 7.8.6. Recent Initiatives, Funding/VC Activities, and Technological Innovations
    9. 7.9. FVB Energy Inc.
      1. 7.9.1. Company Overview
      2. 7.9.2. Product/Service Portfolio
      3. 7.9.3. FVB Energy Inc. Sales, Revenue, and Gross Margin
      4. 7.9.4. FVB Energy Inc. Revenue and Growth Rate
      5. 7.9.5. FVB Energy Inc. Market Share
      6. 7.9.6. Recent Initiatives, Funding/VC Activities, and Technological Innovations
    10. 7.10. Viking Cold Solutions
      1. 7.10.1. Company Overview
      2. 7.10.2. Product/Service Portfolio
      3. 7.10.3. Viking Cold Solutions Sales, Revenue, and Gross Margin
      4. 7.10.4. Viking Cold Solutions Revenue and Growth Rate
      5. 7.10.5. Viking Cold Solutions Market Share
      6. 7.10.6. Recent Initiatives, Funding/VC Activities, and Technological Innovations
    11. 7.11. DN Tanks
      1. 7.11.1. Company Overview
      2. 7.11.2. Product/Service Portfolio
      3. 7.11.3. DN Tanks Sales, Revenue, and Gross Margin
      4. 7.11.4. DN Tanks Revenue and Growth Rate
      5. 7.11.5. DN Tanks Market Share
      6. 7.11.6. Recent Initiatives, Funding/VC Activities, and Technological Innovations
    12. 7.12. Ground Sun Ltd
      1. 7.12.1. Company Overview
      2. 7.12.2. Product/Service Portfolio
      3. 7.12.3. Ground Sun Ltd Sales, Revenue, and Gross Margin
      4. 7.12.4. Ground Sun Ltd Revenue and Growth Rate
      5. 7.12.5. Ground Sun Ltd Market Share
      6. 7.12.6. Recent Initiatives, Funding/VC Activities, and Technological Innovations
    13. 7.13. Vogt Ice
      1. 7.13.1. Company Overview
      2. 7.13.2. Product/Service Portfolio
      3. 7.13.3. Vogt Ice Sales, Revenue, and Gross Margin
      4. 7.13.4. Vogt Ice Revenue and Growth Rate
      5. 7.13.5. Vogt Ice Market Share
      6. 7.13.6. Recent Initiatives, Funding/VC Activities, and Technological Innovations
    14. 7.14. Sunwell
      1. 7.14.1. Company Overview
      2. 7.14.2. Product/Service Portfolio
      3. 7.14.3. Sunwell Sales, Revenue, and Gross Margin
      4. 7.14.4. Sunwell Revenue and Growth Rate
      5. 7.14.5. Sunwell Market Share
      6. 7.14.6. Recent Initiatives, Funding/VC Activities, and Technological Innovations
  8. Chapter 8 Thermal Energy Storage — Industry Analysis
    1. 8.1. Introduction and Taxonomy
    2. 8.2. Thermal Energy Storage Market – Key Trends
      1. 8.2.1. Market Drivers
      2. 8.2.2. Market Restraints
      3. 8.2.3. Market Opportunities
    3. 8.3. Value Chain Analysis
    4. 8.4. Key Mandates and Regulations
    5. 8.5. Technology Roadmap and Timeline
    6. 8.6. Thermal Energy Storage Market – Attractiveness Analysis
      1. 8.6.1. By Technology
      2. 8.6.2. By Storage Material
      3. 8.6.3. By End Users
      4. 8.6.4. By Region
  9. Chapter 9 Industrial Chain, Sourcing Strategy, and Downstream Buyers
    1. 9.1. Thermal Energy Storage Industrial Chain Analysis
    2. 9.2. Downstream Buyers
    3. 9.3. Distributors/Traders List
  10. Chapter 10 Marketing Strategy Analysis
    1. 10.1. Marketing Channel
    2. 10.2. Direct Marketing
    3. 10.3. Indirect Marketing
    4. 10.4. Marketing Channel Development Trends
    5. 10.5. Economic/Political Environmental Change
  11. Chapter 11 Report Conclusion & Key Insights
    1. 11.1. Key Insights from Primary Interviews & Surveys Respondents
    2. 11.2. Key Takeaways from Analysts, Consultants, and Industry Leaders
  12. Chapter 12 Research Approach & Methodology
    1. 12.1. Report Description
    2. 12.2. Research Scope
    3. 12.3. Research Methodology
      1. 12.3.1. Secondary Research
      2. 12.3.2. Primary Research
      3. 12.3.3. Statistical Models
        1. 12.3.3.1. Company Share Analysis Model
        2. 12.3.3.2. Revenue Based Modeling
      4. 12.3.4. Research Limitations

      List of Figures

      Fig.1	Product Picture of Thermal Energy Storage
      Fig.2	Global Thermal Energy Storage Market, 2016 – 2026 (USD Million)
      Fig.3	Global Thermal Energy Storage Market Absolute Revenue Opportunity, 2016 – 2026 (USD Million)
      Fig.4	Global Thermal Energy Storage Market Incremental Revenue Opportunity, 2020 – 2026 (USD Million)
      Fig.5	Global Thermal Energy Storage Market Share, by Technology, 2019 & 2026 (USD Million)
      Fig.6	Global Sensible Heat Storage Thermal Energy Storage Market, 2016 – 2026 (USD Million)
      Fig.7	Global Latent Heat Storage Thermal Energy Storage Market, 2016 – 2026 (USD Million)
      Fig.8	Global Thermal Heat Storage Thermal Energy Storage Market, 2016 – 2026 (USD Million)
      Fig.9	Global Thermal Energy Storage Market Share, by Storage Material, 2019 & 2026 (USD Million)
      Fig.10	Global Water Thermal Energy Storage Market, 2016 – 2026 (USD Million)
      Fig.11	Global Molten Salt Thermal Energy Storage Market, 2016 – 2026 (USD Million)
      Fig.12	Global Phase Change Material (PCM) Thermal Energy Storage Market, 2016 – 2026 (USD Million)
      Fig.13	Global Others Thermal Energy Storage Market, 2016 – 2026 (USD Million)
      Fig.14	Global Thermal Energy Storage Market Share, by End Users, 2019 & 2026 (USD Million)
      Fig.15	Global Commercial and Industrial Thermal Energy Storage Market, 2016 – 2026 (USD Million)
      Fig.16	Global Utilities Thermal Energy Storage Market, 2016 – 2026 (USD Million)
      Fig.17	Global Residential Thermal Energy Storage Market, 2016 – 2026 (USD Million)
      Fig.18	Global Thermal Energy Storage Market Share, by Region, 2019 & 2026 (USD Million)
      Fig.19	North America Thermal Energy Storage Market, 2016 – 2026 (USD Million)
      Fig.20	U.S. Thermal Energy Storage Market, 2016 – 2026 (USD Million)
      Fig.21	Canada Thermal Energy Storage Market, 2016 – 2026 (USD Million)
      Fig.22	Europe Thermal Energy Storage Market, 2016 – 2026 (USD Million)
      Fig.23	Germany Thermal Energy Storage Market, 2016 – 2026 (USD Million)
      Fig.24	France Thermal Energy Storage Market, 2016 – 2026 (USD Million)
      Fig.25	U.K. Thermal Energy Storage Market, 2016 – 2026 (USD Million)
      Fig.26	Italy Thermal Energy Storage Market, 2016 – 2026 (USD Million)
      Fig.27	Spain Thermal Energy Storage Market, 2016 – 2026 (USD Million)
      Fig.28	Rest of Europe Thermal Energy Storage Market, 2016 – 2026 (USD Million)
      Fig.29	Asia Pacific Thermal Energy Storage Market, 2016 – 2026 (USD Million)
      Fig.30	China Thermal Energy Storage Market, 2016 – 2026 (USD Million)
      Fig.31	Japan Thermal Energy Storage Market, 2016 – 2026 (USD Million)
      Fig.32	India Thermal Energy Storage Market, 2016 – 2026 (USD Million)
      Fig.33	South  Korea Thermal Energy Storage Market, 2016 – 2026 (USD Million)
      Fig.34	South-East Asia Thermal Energy Storage Market, 2016 – 2026 (USD Million)
      Fig.35	Rest of Asia Pacific Thermal Energy Storage Market, 2016 – 2026 (USD Million)
      Fig.36	Latin America Thermal Energy Storage Market, 2016 – 2026 (USD Million)
      Fig.37	Brazil Thermal Energy Storage Market, 2016 – 2026 (USD Million)
      Fig.38	Mexico Thermal Energy Storage Market, 2016 – 2026 (USD Million)
      Fig.39	Rest of Latin America Thermal Energy Storage Market, 2016 – 2026 (USD Million)
      Fig.40	The Middle-East and Africa Thermal Energy Storage Market, 2016 – 2026 (USD Million)
      Fig.41	GCC Countries Thermal Energy Storage Market, 2016 – 2026 (USD Million)
      Fig.42	South Africa Thermal Energy Storage Market, 2016 – 2026 (USD Million)
      Fig.43	Rest of Middle-East Africa Thermal Energy Storage Market, 2016 – 2026 (USD Million)
      Fig.44	Competitor Market Share – Revenue
      Fig.45	Baltimore Revenue and Growth Rate
      Fig.46	Baltimore Market Share
      Fig.47	Cryogel Revenue and Growth Rate
      Fig.48	Cryogel Market Share
      Fig.49	Dunham Bush Revenue and Growth Rate
      Fig.50	Dunham Bush Market Share
      Fig.51	EVAPCO, Inc. Revenue and Growth Rate
      Fig.52	EVAPCO, Inc. Market Share
      Fig.53	CALMAC (Trane) Revenue and Growth Rate
      Fig.54	CALMAC (Trane) Market Share
      Fig.55	Cristopia (CIAT UK) Revenue and Growth Rate
      Fig.56	Cristopia (CIAT UK) Market Share
      Fig.57	Araner Revenue and Growth Rate
      Fig.58	Araner Market Share
      Fig.59	Nostromo Revenue and Growth Rate
      Fig.60	Nostromo Market Share
      Fig.61	FVB Energy Inc. Revenue and Growth Rate
      Fig.62	FVB Energy Inc. Market Share
      Fig.63	Viking Cold Solutions Revenue and Growth Rate
      Fig.64	Viking Cold Solutions Market Share
      Fig.65	DN Tanks Revenue and Growth Rate
      Fig.66	DN Tanks Market Share
      Fig.67	Ground Sun Ltd Revenue and Growth Rate
      Fig.68	Ground Sun Ltd Market Share
      Fig.69	Vogt Ice Revenue and Growth Rate
      Fig.70	Vogt Ice Market Share
      Fig.71	Sunwell Revenue and Growth Rate
      Fig.72	Sunwell Market Share
      Fig.73	Market Dynamics
      Fig.74	Global Thermal Energy Storage – Value Chain Analysis
      Fig.75	Key Mandates and Regulations
      Fig.76	Technology Roadmap and Timeline
      Fig.77	Market Attractiveness Analysis – By Technology
      Fig.78	Market Attractiveness Analysis – By Storage Material
      Fig.79	Market Attractiveness Analysis – By End Users
      Fig.80	Market Attractiveness Analysis – By Region
      Fig.81	Thermal Energy Storage Industrial Chain Analysis
      Fig.82	Market Channels
      Fig.83	Marketing Channel Development Trend
      Fig.84	Growth in World Gross Product, 2008-2018
      

      List of Tables

      Table 1	Global Thermal Energy Storage Market, 2019 & 2026 (USD Million)
      Table 2	Global Thermal Energy Storage Market, by Technology, 2016 – 2026 (USD Million)
      Table 3	Global Thermal Energy Storage Market, by Storage Material, 2016 – 2026 (USD Million)
      Table 4	Global Thermal Energy Storage Market, by End Users, 2016 – 2026 (USD Million)
      Table 5	Global Thermal Energy Storage Market, by Region, 2016 – 2026 (USD Million)
      Table 6	North America Thermal Energy Storage Market, by Country, 2016 – 2026 (USD Million)
      Table 7	North America Thermal Energy Storage Market, by Technology, 2016 – 2026 (USD Million)
      Table 8	North America Thermal Energy Storage Market, by Storage Material, 2016 – 2026 (USD Million)
      Table 9	North America Thermal Energy Storage Market, by End Users, 2016 – 2026 (USD Million)
      Table 10 Europe Thermal Energy Storage Market, by Country, 2016 – 2026 (USD Million)
      Table 11 Europe Thermal Energy Storage Market, by Technology, 2016 – 2026 (USD Million)
      Table 12 Europe Thermal Energy Storage Market, by Storage Material, 2016 – 2026 (USD Million)
      Table 13 Europe Thermal Energy Storage Market, by End Users, 2016 – 2026 (USD Million)
      Table 14 Asia Pacific Thermal Energy Storage Market, by Country, 2016 – 2026 (USD Million)
      Table 15 Asia Pacific Thermal Energy Storage Market, by Technology, 2016 – 2026 (USD Million)
      Table 16 Asia Pacific Thermal Energy Storage Market, by Storage Material, 2016 – 2026 (USD Million)
      Table 17 Asia Pacific Thermal Energy Storage Market, by End Users, 2016 – 2026 (USD Million)
      Table 18 Latin America Thermal Energy Storage Market, by Country, 2016 – 2026 (USD Million)
      Table 19 Latin America Thermal Energy Storage Market, by Technology, 2016 – 2026 (USD Million)
      Table 20 Latin America Thermal Energy Storage Market, by Storage Material, 2016 – 2026 (USD Million)
      Table 21 Latin America Thermal Energy Storage Market, by End Users, 2016 – 2026 (USD Million)
      Table 22 The Middle-East and Africa Thermal Energy Storage Market, by Country, 2016 – 2026 (USD Million)
      Table 23 The Middle-East and Africa Thermal Energy Storage Market, by Technology, 2016 – 2026 (USD Million)
      Table 24 The Middle-East and Africa Thermal Energy Storage Market, by Storage Material, 2016 – 2026 (USD Million)
      Table 25 The Middle-East and Africa Thermal Energy Storage Market, by End Users, 2016 – 2026 (USD Million)
      Table 26 Global Thermal Energy Storage Market - Company Revenue Analysis, 2016 – 2019 (USD Million)
      Table 27 Global Thermal Energy Storage Market - Company Revenue Share Analysis, 2016 – 2019 (%)
      Table 28 Acquisitions and Mergers
      Table 29 Market Drivers – Impact Analysis
      Table 30 Market Restraints
      Table 31 Market Opportunities
      Table 32 Major Buyers of Thermal Energy Storage
      Table 33 Distributors/Traders of Thermal Energy Storage by Region
      

Industry Major Market Players

  •  Baltimore
  •  Aircoil International
  •  Cryogel Thermal Energy Storage
  •  Caldwell Energy Company 
  •  Dunham Bush 
  •  EVAPCO, Inc.
  •  CALMAC (Trane)
  •  Cristopia (CIAT UK)
  •  Araner, Nostromo
  •  FVB Energy Inc. 
  •  Ground Sun Ltd 
  •  Viking Cold Solutions 
  •  DN Tanks 
  •  Vogt Ice 
  •  Sunwell