Search Market Research Report

Discover Our Latest Reports
Discover Our Featured Reports
Discover Top Selling Reports

Textile Chemicals Market Size, Share Global Analysis Report, 2021 - 2026

report img

Textile Chemicals Market By Product (Coating & Sizing Chemicals, Colorant & Auxiliaries, Finishing Agents, Surfactants, De-Sizing Agents, & Others), By Application (Apparel, Home Furnishing, & Technical Textiles), And By Regions - Global & Regional Industry Perspective, Comprehensive Analysis, and Forecast 2021 - 2026

Industry Insights

Textile Chemicals Market

To know more about this report | Request Free Sample Copy

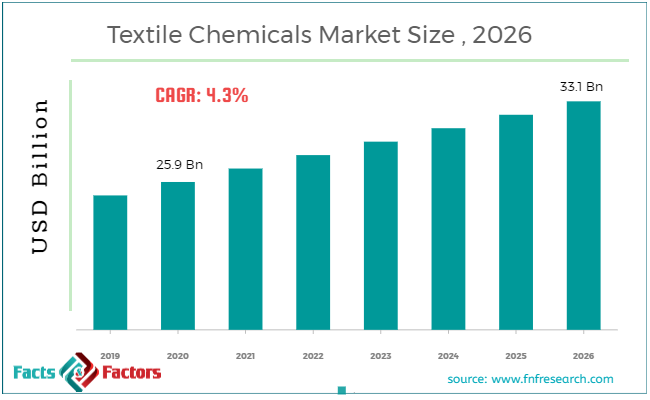
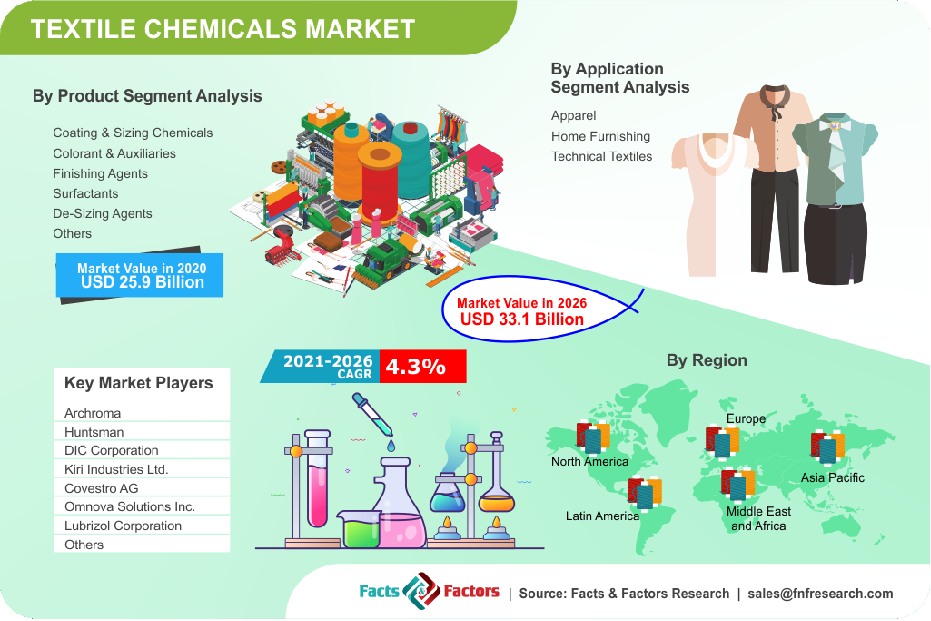
[213+ Pages Report] We at Facts & Factors have recently published a report titled “Textile Chemicals Market” that encompasses the spectacle of the market in an analytical and comprehensive manner. In this report, the global textile chemicals market is estimated to reach USD 33.1 Billion in the year 2026 from an initial value of USD 25.9 Billion in the year 2020 growing at a CAGR value of 4.3%.

logoMarket Overview

Textile chemicals are a highly specialized group of chemicals that belong to the groups such as biocides, flame retardants, water repellents, and warp sizes to chemical bonds such as bleaches, emulsified oils, and greases, starch, sulfonated oils, waxes, and some forms of surfactants. Because of the nature of the chemicals that are involved, textile chemicals are extremely difficult to process and often require intense distilling measures to safely dissipate.

logoKey Insights from Primary Research

  • The textile chemicals market is set to grow annually at a rate of around 5.5% as per our primary research
  • It was established through primary research that the textile chemicals market was valued at around USD 27 billion in 2019
  • Asia-Pacific held the largest market share of the textile chemicals market
  • The “Synthetic fiber” category, on the basis of fiber type segmentation, was the leading revenue-generating with a market share of 67%
  • The “Coating and sizing” category, on the basis of product type segmentation, was the leading revenue-generating with 30% market share

logoKey Recommendations from Analysts

  • As per our analysts, the major application of textile chemicals is anticipated to be the manufacturing of apparels
  • The growing demand for apparels globally is boosting the textile chemicals market
  • The growing industrialization in countries like India and China has given the textile chemical industry a huge impetus.
  • Thriving growth of the apparel industry on account of implementing innovative strategies by textile chemical manufacturers with significant support from the government has led to the prominent development of the textile chemical market in the Middle East and Africa region
  • Stringent environmental regulations regarding the disposal of textile effluents are pulling back the textile chemicals market

logoIndustry Growth Factors

The primary driving factors for the significant growth of the global textile chemicals market are the rising demand in technical textiles coupled with the rising adoption of low-grade VOC and biodegradable materials for textile manufacturing to name a few. Additionally, factors pertaining to unique and exclusive characteristics offered by chemical textiles coupled with added benefits such as mechanical resistance, anti-dust, insulation from fire and thermal resistance, and resistive properties toward UV and IR is expected to increase the footprint of the global textile chemicals market during the advent of the forecast period. Moreover, increased consumption of technical textiles due to a rising demand from various applications coupled with rising innovations owing to increasing attractiveness and adaptability will fuel the growth of the global textile chemicals market during the advent of the forecast duration.

The global textile chemicals market is expected to be driven by increased usage of chemical textiles toward the manufacturing sector coupled with rising consumer demands in terms of texture and apparel subsidizing to name a few. Rising demand for the sustainability of products coupled with the increased imposition of restricted substance lists (RSLs) will increase the consumer base for the global textile chemicals market during the forecast period. However, stringent environmental regulation regarding disposal means coupled with rising consumer awareness toward human health upon increases usage is expected to decrease the market share of the global textile chemicals market during the advent of the forecast period.

/textile-chemicals-market

To know more about this report | Request Free Sample Copy

logoSegmentation Analysis

The global textile chemicals market is segmented into product, application, and region.

On the basis of product, the global textile chemicals market is divided into coating & sizing chemicals, colorant & auxiliaries, finishing agents, surfactants, de-sizing agents, and others. The segment pertaining to colorant & auxiliaries is expected to witness the largest market share during the advent of the forecast period owing to the ability of the latter toward preparing and modifying substrate for the process of coloration coupled with the increased functionality in terms of increasing fastness ability of dyeing to name a few. Additionally, factors pertaining to a wider range of forms of availability of products such as dispersing agents, carriers, sequestering agents, peroxide killer, anti-foaming agents, and anti-pilling agents will further cement the dominant market position of the latter segment during the advent of the market period. On the basis of application, the global textile chemicals market is classified into apparel, home furnishing, and technical textiles. The apparel segment is expected to witness the largest market share during the advent of the forecast period due to a rising number of products such as shirts, t-shirts, suits, jackets, trousers, skirts, and swimwear coupled with the rising production of apparel due to an increasing demand to name a few. Additionally, a rapid shift of the key market players toward adopting increasing consumer demands coupled with increasing disposable income among consumers will help cement the dominant market position of the latter segment during the forecast period.

logo Report Scope

Report Attribute

Details

Market Size in 2020

USD 25.9 Billion

Projected Market Size in 2026

USD 33.1 Billion

CAGR Growth Rate

4.3% CAGR

Base Year

2020

Forecast Years

2021-2026

Key Market Players

Archroma, Huntsman, DIC Corporation, Kiri Industries Ltd., Covestro AG, Omnova Solutions Inc., Lubrizol Corporation, Solvay S.A., Evonik Industries, Tanatext Chemicals, Rudolf GmbH, NICCA Chemical Co. Ltd., Kemin Industries Inc., JINTEX Ltd., Dow, Wacker Chemie AG, Huntsman International Inc., and Sarex Chemicals, among others.

Key Segments

Products, Applications, and Region

Major Regions Covered

North America, Europe, Asia Pacific, Latin America, and Middle East & Africa

Purchase Options

Request customized purchase options to meet your research needs. Explore purchase options

logo Regional Analysis

Asia-Pacific is expected to witness the largest market share during the advent of the forecast period owing to the region is the home to a global hub for textile production and exports coupled with rising demand for textile from emerging economies such as China and India to name a few. Additionally, the rising availability of bulk material required for production coupled with lowering labor costs is expected to increase the footprint of the textile chemicals market during the advent of the forecast period. Rapid industrialization measures coupled with increasing government support in the form of rising incentives will further push the existing boundaries of the textile chemicals market in the region during the advent of the forecast period. North America is expected to witness a substantial market share after the latter region in terms of generated revenue due to rising sale of fiber, textiles, and apparel coupled with rising investments toward research and development to name a few.

logo Competitive Players

The key market participants for the global textile chemicals market are

  • Archroma
  • Huntsman
  • DIC Corporation
  • Kiri Industries Ltd.
  • Covestro AG
  • Omnova Solutions Inc.
  • Lubrizol Corporation
  • Solvay S.A.
  • Evonik Industries
  • Tanatext Chemicals
  • Rudolf GmbH
  • NICCA Chemical Co. Ltd.
  • Kemin Industries Inc.
  • JINTEX Ltd.
  • Dow
  • Wacker Chemie AG
  • Huntsman International Inc.
  • Sarex Chemicals

logo By Product Segment Analysis

  • Coating & Sizing Chemicals
  • Colorant & Auxiliaries
  • Finishing Agents
  • Surfactants
  • De-Sizing Agents
  • Others

logo By Application Segment Analysis

  • Apparel
  • Home Furnishing
  • Technical Textiles

logo By Regional Segment Analysis

  • North America
    • U.S.
    • Canada
  • Europe
    • UK
    • France
    • Germany
    • Italy
    • Spain
    • Rest of Europe
  • Asia Pacific
    • China
    • Japan
    • India
    • South Korea
    • Southeast Asia
    • Rest of Asia Pacific
  • Latin America
    • Brazil
    • Mexico
    • Rest of Latin America
  • Middle East and Africa
    • GCC Countries
    • South Africa
    • Rest of MEA

Table of Content

  1. Chapter 1 Executive Summary
    1. 1.1. Introduction of Textile Chemicals
    2. 1.2. Global Textile Chemicals Market, 2019 & 2026 (USD Billion)
    3. 1.3. Global Textile Chemicals Market, 2016 – 2026 (USD Billion)
    4. 1.4. Global Textile Chemicals Market Absolute Revenue Opportunity, 2016 – 2026 (USD Billion)
    5. 1.5. Global Textile Chemicals Market Incremental Revenue Opportunity, 2020 – 2026 (USD Billion)
  2. Chapter 2 Textile Chemicals Market – Product Analysis
    1. 2.1. Global Textile Chemicals Market – Product Overview
    2. 2.2. Global Textile Chemicals Market Share, by Product, 2019 & 2026 (USD Billion)
    3. 2.3. Coating & Sizing Chemicals
      1. 2.3.1. Global Coating & Sizing Chemicals Textile Chemicals Market, 2016 – 2026 (USD Billion)
    4. 2.4. Colorant & Auxiliaries
      1. 2.4.1. Global Colorant & Auxiliaries Textile Chemicals Market, 2016 – 2026 (USD Billion)
    5. 2.5. Finishing Agents
      1. 2.5.1. Global Finishing Agents Textile Chemicals Market, 2016 – 2026 (USD Billion)
    6. 2.6. Surfactants
      1. 2.6.1. Global Surfactants Textile Chemicals Market, 2016 – 2026 (USD Billion)
    7. 2.7. De-Sizing Agents
      1. 2.7.1. Global De-Sizing Agents Textile Chemicals Market, 2016 – 2026 (USD Billion)
    8. 2.8. Others
      1. 2.8.1. Global Others Textile Chemicals Market, 2016 – 2026 (USD Billion)
  3. Chapter 3 Textile Chemicals Market – Application Analysis
    1. 3.1. Global Textile Chemicals Market – Application Overview
    2. 3.2. Global Textile Chemicals Market Share, by Application, 2019 & 2026 (USD Billion)
    3. 3.3. Apparel
      1. 3.3.1. Global Apparel Textile Chemicals Market, 2016 – 2026 (USD Billion)
    4. 3.4. Home Furnishing
      1. 3.4.1. Global Home Furnishing Textile Chemicals Market, 2016 – 2026 (USD Billion)
    5. 3.5. Technical Textiles
      1. 3.5.1. Global Technical Textiles Textile Chemicals Market, 2016 – 2026 (USD Billion)
  4. Chapter 4 Textile Chemicals Market – Regional Analysis
    1. 4.1. Global Textile Chemicals Market Regional Overview
    2. 4.2. Global Textile Chemicals Market Share, by Region, 2019 & 2026 (USD Billion)
    3. 4.3. North America
      1. 4.3.1. North America Textile Chemicals Market, 2016 – 2026 (USD Billion)
        1. 4.3.1.1. North America Textile Chemicals Market, by Country, 2016 - 2026 (USD Billion)
      2. 4.3.2. North America Textile Chemicals Market, by Product, 2016 – 2026
        1. 4.3.2.1. North America Textile Chemicals Market, by Product, 2016 – 2026 (USD Billion)
      3. 4.3.3. North America Textile Chemicals Market, by Application, 2016 – 2026
        1. 4.3.3.1. North America Textile Chemicals Market, by Application, 2016 – 2026 (USD Billion)
      4. 4.3.4. U.S.
        1. 4.3.4.1. U.S. Textile Chemicals Market, 2016 – 2026 (USD Billion)
      5. 4.3.5. Canada
        1. 4.3.5.1. Canada Textile Chemicals Market, 2016 – 2026 (USD Billion)
    4. 4.4. Europe
      1. 4.4.1. Europe Textile Chemicals Market, 2016 – 2026 (USD Billion)
        1. 4.4.1.1. Europe Textile Chemicals Market, by Country, 2016 - 2026 (USD Billion)
      2. 4.4.2. Europe Textile Chemicals Market, by Product, 2016 – 2026
        1. 4.4.2.1. Europe Textile Chemicals Market, by Product, 2016 – 2026 (USD Billion)
      3. 4.4.3. Europe Textile Chemicals Market, by Application, 2016 – 2026
        1. 4.4.3.1. Europe Textile Chemicals Market, by Application, 2016 – 2026 (USD Billion)
      4. 4.4.4. Germany
        1. 4.4.4.1. Germany Textile Chemicals Market, 2016 – 2026 (USD Billion)
      5. 4.4.5. France
        1. 4.4.5.1. France Textile Chemicals Market, 2016 – 2026 (USD Billion)
      6. 4.4.6. U.K.
        1. 4.4.6.1. U.K. Textile Chemicals Market, 2016 – 2026 (USD Billion)
      7. 4.4.7. Italy
        1. 4.4.7.1. Italy Textile Chemicals Market, 2016 – 2026 (USD Billion)
      8. 4.4.8. Spain
        1. 4.4.8.1. Spain Textile Chemicals Market, 2016 – 2026 (USD Billion)
      9. 4.4.9. Rest of Europe
        1. 4.4.9.1. Rest of Europe Textile Chemicals Market, 2016 – 2026 (USD Billion)
    5. 4.5. Asia Pacific
      1. 4.5.1. Asia Pacific Textile Chemicals Market, 2016 – 2026 (USD Billion)
        1. 4.5.1.1. Asia Pacific Textile Chemicals Market, by Country, 2016 - 2026 (USD Billion)
      2. 4.5.2. Asia Pacific Textile Chemicals Market, by Product, 2016 – 2026
        1. 4.5.2.1. Asia Pacific Textile Chemicals Market, by Product, 2016 – 2026 (USD Billion)
      3. 4.5.3. Asia Pacific Textile Chemicals Market, by Application, 2016 – 2026
        1. 4.5.3.1. Asia Pacific Textile Chemicals Market, by Application, 2016 – 2026 (USD Billion)
      4. 4.5.4. China
        1. 4.5.4.1. China Textile Chemicals Market, 2016 – 2026 (USD Billion)
      5. 4.5.5. Japan
        1. 4.5.5.1. Japan Textile Chemicals Market, 2016 – 2026 (USD Billion)
      6. 4.5.6. India
        1. 4.5.6.1. India Textile Chemicals Market, 2016 – 2026 (USD Billion)
      7. 4.5.7. South Korea
        1. 4.5.7.1. South Korea Textile Chemicals Market, 2016 – 2026 (USD Billion)
      8. 4.5.8. South-East Asia
        1. 4.5.8.1. South-East Asia Textile Chemicals Market, 2016 – 2026 (USD Billion)
      9. 4.5.9. Rest of Asia Pacific
        1. 4.5.9.1. Rest of Asia Pacific Textile Chemicals Market, 2016 – 2026 (USD Billion)
    6. 4.6. Latin America
      1. 4.6.1. Latin America Textile Chemicals Market, 2016 – 2026 (USD Billion)
        1. 4.6.1.1. Latin America Textile Chemicals Market, by Country, 2016 - 2026 (USD Billion)
      2. 4.6.2. Latin America Textile Chemicals Market, by Product, 2016 – 2026
        1. 4.6.2.1. Latin America Textile Chemicals Market, by Product, 2016 – 2026 (USD Billion)
      3. 4.6.3. Latin America Textile Chemicals Market, by Application, 2016 – 2026
        1. 4.6.3.1. Latin America Textile Chemicals Market, by Application, 2016 – 2026 (USD Billion)
      4. 4.6.4. Brazil
        1. 4.6.4.1. Brazil Textile Chemicals Market, 2016 – 2026 (USD Billion)
      5. 4.6.5. Mexico
        1. 4.6.5.1. Mexico Textile Chemicals Market, 2016 – 2026 (USD Billion)
      6. 4.6.6. Rest of Latin America
        1. 4.6.6.1. Rest of Latin America Textile Chemicals Market, 2016 – 2026 (USD Billion)
    7. 4.7. The Middle-East and Africa
      1. 4.7.1. The Middle-East and Africa Textile Chemicals Market, 2016 – 2026 (USD Billion)
        1. 4.7.1.1. The Middle-East and Africa Textile Chemicals Market, by Country, 2016 - 2026 (USD Billion)
      2. 4.7.2. The Middle-East and Africa Textile Chemicals Market, by Product, 2016 – 2026
        1. 4.7.2.1. The Middle-East and Africa Textile Chemicals Market, by Product, 2016 – 2026 (USD Billion)
      3. 4.7.3. The Middle-East and Africa Textile Chemicals Market, by Application, 2016 – 2026
        1. 4.7.3.1. The Middle-East and Africa Textile Chemicals Market, by Application, 2016 – 2026 (USD Billion)
      4. 4.7.4. GCC Countries
        1. 4.7.4.1. GCC Countries Textile Chemicals Market, 2016 – 2026 (USD Billion)
      5. 4.7.5. South Africa
        1. 4.7.5.1. South Africa Textile Chemicals Market, 2016 – 2026 (USD Billion)
      6. 4.7.6. Rest of Middle-East Africa
        1. 4.7.6.1. Rest of Middle-East Africa Textile Chemicals Market, 2016 – 2026 (USD Billion)
  5. Chapter 5 Textile Chemicals Market – Competitive Landscape
    1. 5.1. Competitor Market Share – Revenue
    2. 5.2. Market Concentration Rate Analysis, Top 3 and Top 5 Players
    3. 5.3. Strategic Developments
      1. 5.3.1. Acquisitions and Mergers
      2. 5.3.2. New Products
      3. 5.3.3. Research & Development Activities
  6. Chapter 6 Company Profiles
    1. 6.1. Archroma
      1. 6.1.1. Company Overview
      2. 6.1.2. Product/Service Portfolio
      3. 6.1.3. Archroma Sales, Revenue, and Gross Margin
      4. 6.1.4. Archroma Revenue and Growth Rate
      5. 6.1.5. Archroma Market Share
      6. 6.1.6. Recent Initiatives, Funding/VC Activities, and Technological Innovations
    2. 6.2. Huntsman
      1. 6.2.1. Company Overview
      2. 6.2.2. Product/Service Portfolio
      3. 6.2.3. Huntsman Sales, Revenue, and Gross Margin
      4. 6.2.4. Huntsman Revenue and Growth Rate
      5. 6.2.5. Huntsman Market Share
      6. 6.2.6. Recent Initiatives, Funding/VC Activities, and Technological Innovations
    3. 6.3. DIC Corporation
      1. 6.3.1. Company Overview
      2. 6.3.2. Product/Service Portfolio
      3. 6.3.3. DIC Corporation Sales, Revenue, and Gross Margin
      4. 6.3.4. DIC Corporation Revenue and Growth Rate
      5. 6.3.5. DIC Corporation Market Share
      6. 6.3.6. Recent Initiatives, Funding/VC Activities, and Technological Innovations
    4. 6.4. Kiri Industries Ltd
      1. 6.4.1. Company Overview
      2. 6.4.2. Product/Service Portfolio
      3. 6.4.3. Kiri Industries Ltd Sales, Revenue, and Gross Margin
      4. 6.4.4. Kiri Industries Ltd Revenue and Growth Rate
      5. 6.4.5. Kiri Industries Ltd Market Share
      6. 6.4.6. Recent Initiatives, Funding/VC Activities, and Technological Innovations
    5. 6.5. Covestro AG
      1. 6.5.1. Company Overview
      2. 6.5.2. Product/Service Portfolio
      3. 6.5.3. Covestro AG Sales, Revenue, and Gross Margin
      4. 6.5.4. Covestro AG Revenue and Growth Rate
      5. 6.5.5. Covestro AG Market Share
      6. 6.5.6. Recent Initiatives, Funding/VC Activities, and Technological Innovations
    6. 6.6. Omnova Solutions Inc
      1. 6.6.1. Company Overview
      2. 6.6.2. Product/Service Portfolio
      3. 6.6.3. Omnova Solutions Inc Sales, Revenue, and Gross Margin
      4. 6.6.4. Omnova Solutions Inc Revenue and Growth Rate
      5. 6.6.5. Omnova Solutions Inc Market Share
      6. 6.6.6. Recent Initiatives, Funding/VC Activities, and Technological Innovations
    7. 6.7. Lubrizol Corporation
      1. 6.7.1. Company Overview
      2. 6.7.2. Product/Service Portfolio
      3. 6.7.3. Lubrizol Corporation Sales, Revenue, and Gross Margin
      4. 6.7.4. Lubrizol Corporation Revenue and Growth Rate
      5. 6.7.5. Lubrizol Corporation Market Share
      6. 6.7.6. Recent Initiatives, Funding/VC Activities, and Technological Innovations
    8. 6.8. Solvay S.A
      1. 6.8.1. Company Overview
      2. 6.8.2. Product/Service Portfolio
      3. 6.8.3. Solvay S.A Sales, Revenue, and Gross Margin
      4. 6.8.4. Solvay S.A Revenue and Growth Rate
      5. 6.8.5. Solvay S.A Market Share
      6. 6.8.6. Recent Initiatives, Funding/VC Activities, and Technological Innovations
    9. 6.9. Evonik Industries
      1. 6.9.1. Company Overview
      2. 6.9.2. Product/Service Portfolio
      3. 6.9.3. Evonik Industries Sales, Revenue, and Gross Margin
      4. 6.9.4. Evonik Industries Revenue and Growth Rate
      5. 6.9.5. Evonik Industries Market Share
      6. 6.9.6. Recent Initiatives, Funding/VC Activities, and Technological Innovations
    10. 6.10. Tanatext Chemicals
      1. 6.10.1. Company Overview
      2. 6.10.2. Product/Service Portfolio
      3. 6.10.3. Tanatext Chemicals Sales, Revenue, and Gross Margin
      4. 6.10.4. Tanatext Chemicals Revenue and Growth Rate
      5. 6.10.5. Tanatext Chemicals Market Share
      6. 6.10.6. Recent Initiatives, Funding/VC Activities, and Technological Innovations
    11. 6.11. Rudolf GmbH
      1. 6.11.1. Company Overview
      2. 6.11.2. Product/Service Portfolio
      3. 6.11.3. Rudolf GmbH Sales, Revenue, and Gross Margin
      4. 6.11.4. Rudolf GmbH Revenue and Growth Rate
      5. 6.11.5. Rudolf GmbH Market Share
      6. 6.11.6. Recent Initiatives, Funding/VC Activities, and Technological Innovations
    12. 6.12. NICCA Chemical Co. Ltd
      1. 6.12.1. Company Overview
      2. 6.12.2. Product/Service Portfolio
      3. 6.12.3. NICCA Chemical Co. Ltd Sales, Revenue, and Gross Margin
      4. 6.12.4. NICCA Chemical Co. Ltd Revenue and Growth Rate
      5. 6.12.5. NICCA Chemical Co. Ltd Market Share
      6. 6.12.6. Recent Initiatives, Funding/VC Activities, and Technological Innovations
    13. 6.13. Kemin Industries Inc
      1. 6.13.1. Company Overview
      2. 6.13.2. Product/Service Portfolio
      3. 6.13.3. Kemin Industries Inc Sales, Revenue, and Gross Margin
      4. 6.13.4. Kemin Industries Inc Revenue and Growth Rate
      5. 6.13.5. Kemin Industries Inc Market Share
      6. 6.13.6. Recent Initiatives, Funding/VC Activities, and Technological Innovations
    14. 6.14. JINTEX Ltd
      1. 6.14.1. Company Overview
      2. 6.14.2. Product/Service Portfolio
      3. 6.14.3. JINTEX Ltd Sales, Revenue, and Gross Margin
      4. 6.14.4. JINTEX Ltd Revenue and Growth Rate
      5. 6.14.5. JINTEX Ltd Market Share
      6. 6.14.6. Recent Initiatives, Funding/VC Activities, and Technological Innovations
    15. 6.15. Dow
      1. 6.15.1. Company Overview
      2. 6.15.2. Product/Service Portfolio
      3. 6.15.3. Dow Sales, Revenue, and Gross Margin
      4. 6.15.4. Dow Revenue and Growth Rate
      5. 6.15.5. Dow Market Share
      6. 6.15.6. Recent Initiatives, Funding/VC Activities, and Technological Innovations
    16. 6.16. Wacker Chemie AG
      1. 6.16.1. Company Overview
      2. 6.16.2. Product/Service Portfolio
      3. 6.16.3. Wacker Chemie AG Sales, Revenue, and Gross Margin
      4. 6.16.4. Wacker Chemie AG Revenue and Growth Rate
      5. 6.16.5. Wacker Chemie AG Market Share
      6. 6.16.6. Recent Initiatives, Funding/VC Activities, and Technological Innovations
    17. 6.17. Huntsman International Inc
      1. 6.17.1. Company Overview
      2. 6.17.2. Product/Service Portfolio
      3. 6.17.3. Huntsman International Inc Sales, Revenue, and Gross Margin
      4. 6.17.4. Huntsman International Inc Revenue and Growth Rate
      5. 6.17.5. Huntsman International Inc Market Share
      6. 6.17.6. Recent Initiatives, Funding/VC Activities, and Technological Innovations
    18. 6.18. Sarex Chemicals
      1. 6.18.1. Company Overview
      2. 6.18.2. Product/Service Portfolio
      3. 6.18.3. Sarex Chemicals Sales, Revenue, and Gross Margin
      4. 6.18.4. Sarex Chemicals Revenue and Growth Rate
      5. 6.18.5. Sarex Chemicals Market Share
      6. 6.18.6. Recent Initiatives, Funding/VC Activities, and Technological Innovations
  7. Chapter 7 Textile Chemicals — Industry Analysis
    1. 7.1. Introduction and Taxonomy
    2. 7.2. Textile Chemicals Market – Key Trends
      1. 7.2.1. Market Drivers
      2. 7.2.2. Market Restraints
      3. 7.2.3. Market Opportunities
    3. 7.3. Value Chain Analysis
    4. 7.4. Key Mandates and Regulations
    5. 7.5. Technology Roadmap and Timeline
    6. 7.6. Textile Chemicals Market – Attractiveness Analysis
      1. 7.6.1. By Product
      2. 7.6.2. By Application
      3. 7.6.3. By Region
  8. Chapter 8 Industrial Chain, Sourcing Strategy, and Downstream Buyers
    1. 8.1. Textile Chemicals Industrial Chain Analysis
    2. 8.2. Downstream Buyers
    3. 8.3. Distributors/Traders List
  9. Chapter 9 Marketing Strategy Analysis
    1. 9.1. Marketing Channel
    2. 9.2. Direct Marketing
    3. 9.3. Indirect Marketing
    4. 9.4. Marketing Channel Development Trends
    5. 9.5. Economic/Political Environmental Change
  10. Chapter 10 Report Conclusion & Key Insights
    1. 10.1. Key Insights from Primary Interviews & Surveys Respondents
    2. 10.2. Key Takeaways from Analysts, Consultants, and Industry Leaders
  11. Chapter 11 Research Approach & Methodology
    1. 11.1. Report Description
    2. 11.2. Research Scope
    3. 11.3. Research Methodology
      1. 11.3.1. Secondary Research
      2. 11.3.2. Primary Research
      3. 11.3.3. Statistical Models
        1. 11.3.3.1. Company Share Analysis Model
        2. 11.3.3.2. Revenue Based Modeling
      4. 11.3.4. Research Limitations

      List of Figures

      Fig.1	Product Picture of Textile Chemicals
      Fig.2	Global Textile Chemicals Market, 2016 – 2026 (USD Billion)
      Fig.3	Global Textile Chemicals Market Absolute Revenue Opportunity, 2016 – 2026 (USD Billion)
      Fig.4	Global Textile Chemicals Market Incremental Revenue Opportunity, 2020 – 2026 (USD Billion)
      Fig.5	Global Textile Chemicals Market Share, by Product, 2019 & 2026 (USD Billion)
      Fig.6	Global Coating & Sizing Chemicals  Textile Chemicals Market, 2016 – 2026 (USD Billion)
      Fig.7	Global Colorant & Auxiliaries  Textile Chemicals Market, 2016 – 2026 (USD Billion)
      Fig.8	Global Finishing Agents Textile Chemicals Market, 2016 – 2026 (USD Billion)
      Fig.9	Global Surfactants Textile Chemicals Market, 2016 – 2026 (USD Billion)
      Fig.10	Global De-Sizing Agents Textile Chemicals Market, 2016 – 2026 (USD Billion)
      Fig.11	Global Others Textile Chemicals Market, 2016 – 2026 (USD Billion)
      Fig.12	Global Textile Chemicals Market Share, by Application, 2019 & 2026 (USD Billion)
      Fig.13	Global Apparel  Textile Chemicals Market, 2016 – 2026 (USD Billion)
      Fig.14	Global Home Furnishing  Textile Chemicals Market, 2016 – 2026 (USD Billion)
      Fig.15	Global Technical Textiles Textile Chemicals Market, 2016 – 2026 (USD Billion)
      Fig.16	Global Textile Chemicals Market Share, by Region, 2019 & 2026 (USD Billion)
      Fig.17	North America Textile Chemicals Market, 2016 – 2026 (USD Billion)
      Fig.18	U.S. Textile Chemicals Market, 2016 – 2026 (USD Billion)
      Fig.19	Canada Textile Chemicals Market, 2016 – 2026 (USD Billion)
      Fig.20	Europe Textile Chemicals Market, 2016 – 2026 (USD Billion)
      Fig.21	Germany Textile Chemicals Market, 2016 – 2026 (USD Billion)
      Fig.22	France Textile Chemicals Market, 2016 – 2026 (USD Billion)
      Fig.23	U.K. Textile Chemicals Market, 2016 – 2026 (USD Billion)
      Fig.24	Italy Textile Chemicals Market, 2016 – 2026 (USD Billion)
      Fig.25	Spain Textile Chemicals Market, 2016 – 2026 (USD Billion)
      Fig.26	Rest of Europe Textile Chemicals Market, 2016 – 2026 (USD Billion)
      Fig.27	Asia Pacific Textile Chemicals Market, 2016 – 2026 (USD Billion)
      Fig.28	China Textile Chemicals Market, 2016 – 2026 (USD Billion)
      Fig.29	Japan Textile Chemicals Market, 2016 – 2026 (USD Billion)
      Fig.30	India Textile Chemicals Market, 2016 – 2026 (USD Billion)
      Fig.31	South  Korea Textile Chemicals Market, 2016 – 2026 (USD Billion)
      Fig.32	South-East Asia Textile Chemicals Market, 2016 – 2026 (USD Billion)
      Fig.33	Rest of Asia Pacific Textile Chemicals Market, 2016 – 2026 (USD Billion)
      Fig.34	Latin America Textile Chemicals Market, 2016 – 2026 (USD Billion)
      Fig.35	Brazil Textile Chemicals Market, 2016 – 2026 (USD Billion)
      Fig.36	Mexico Textile Chemicals Market, 2016 – 2026 (USD Billion)
      Fig.37	Rest of Latin America Textile Chemicals Market, 2016 – 2026 (USD Billion)
      Fig.38	The Middle-East and Africa Textile Chemicals Market, 2016 – 2026 (USD Billion)
      Fig.39	GCC Countries Textile Chemicals Market, 2016 – 2026 (USD Billion)
      Fig.40	South Africa Textile Chemicals Market, 2016 – 2026 (USD Billion)
      Fig.41	Rest of Middle-East Africa Textile Chemicals Market, 2016 – 2026 (USD Billion)
      Fig.42	Competitor Market Share – Revenue
      Fig.43	Archroma Revenue and Growth Rate
      Fig.44	Archroma Market Share
      Fig.45	Huntsman Revenue and Growth Rate
      Fig.46	Huntsman Market Share
      Fig.47	DIC Corporation Revenue and Growth Rate
      Fig.48	DIC Corporation Market Share
      Fig.49	Kiri Industries Ltd Revenue and Growth Rate
      Fig.50	Kiri Industries Ltd Market Share
      Fig.51	Covestro AG Revenue and Growth Rate
      Fig.52	Covestro AG Market Share
      Fig.53	Omnova Solutions Inc Revenue and Growth Rate
      Fig.54	Omnova Solutions Inc Market Share
      Fig.55	Lubrizol Corporation Revenue and Growth Rate
      Fig.56	Lubrizol Corporation Market Share
      Fig.57	Solvay S.A Revenue and Growth Rate
      Fig.58	Solvay S.A Market Share
      Fig.59	Evonik Industries Revenue and Growth Rate
      Fig.60	Evonik Industries Market Share
      Fig.61	Tanatext Chemicals Revenue and Growth Rate
      Fig.62	Tanatext Chemicals Market Share
      Fig.63	Rudolf GmbH Revenue and Growth Rate
      Fig.64	Rudolf GmbH Market Share
      Fig.65	NICCA Chemical Co. Ltd Revenue and Growth Rate
      Fig.66	NICCA Chemical Co. Ltd Market Share
      Fig.67	Kemin Industries Inc Revenue and Growth Rate
      Fig.68	Kemin Industries Inc Market Share
      Fig.69	JINTEX Ltd Revenue and Growth Rate
      Fig.70	JINTEX Ltd Market Share
      Fig.71	Dow Revenue and Growth Rate
      Fig.72	Dow Market Share
      Fig.73	Wacker Chemie AG Revenue and Growth Rate
      Fig.74	Wacker Chemie AG Market Share
      Fig.75	Huntsman International Inc Revenue and Growth Rate
      Fig.76	Huntsman International Inc Market Share
      Fig.77	Sarex Chemicals Revenue and Growth Rate
      Fig.78	Sarex Chemicals Market Share
      Fig.79	Market Dynamics
      Fig.80	Global Textile Chemicals – Value Chain Analysis
      Fig.81	Key Mandates and Regulations
      Fig.82	Technology Roadmap and Timeline
      Fig.83	Market Attractiveness Analysis – By Product
      Fig.84	Market Attractiveness Analysis – By Application
      Fig.85	Market Attractiveness Analysis – By Region
      Fig.86	Textile Chemicals Industrial Chain Analysis
      Fig.87	Market Channels
      Fig.88	Marketing Channel Development Trend
      Fig.89	Growth in World Gross Product, 2008-2018
      

      List of Tables

      Table 1	Global Textile Chemicals Market, 2019 & 2026 (USD Billion)
      Table 2	Global Textile Chemicals Market, by Product, 2016 – 2026 (USD Billion)
      Table 3	Global Textile Chemicals Market, by Application, 2016 – 2026 (USD Billion)
      Table 4	Global Textile Chemicals Market, by Region, 2016 – 2026 (USD Billion)
      Table 5	North America Textile Chemicals Market, by Country, 2016 – 2026 (USD Billion)
      Table 6	North America Textile Chemicals Market, by Product, 2016 – 2026 (USD Billion)
      Table 7	North America Textile Chemicals Market, by Application, 2016 – 2026 (USD Billion)
      Table 8	Europe Textile Chemicals Market, by Country, 2016 – 2026 (USD Billion)
      Table 9	Europe Textile Chemicals Market, by Product, 2016 – 2026 (USD Billion)
      Table 10 Europe Textile Chemicals Market, by Application, 2016 – 2026 (USD Billion)
      Table 11 Asia Pacific Textile Chemicals Market, by Country, 2016 – 2026 (USD Billion)
      Table 12 Asia Pacific Textile Chemicals Market, by Product, 2016 – 2026 (USD Billion)
      Table 13 Asia Pacific Textile Chemicals Market, by Application, 2016 – 2026 (USD Billion)
      Table 14 Latin America Textile Chemicals Market, by Country, 2016 – 2026 (USD Billion)
      Table 15 Latin America Textile Chemicals Market, by Product, 2016 – 2026 (USD Billion)
      Table 16 Latin America Textile Chemicals Market, by Application, 2016 – 2026 (USD Billion)
      Table 17 The Middle-East and Africa Textile Chemicals Market, by Country, 2016 – 2026 (USD Billion)
      Table 18 The Middle-East and Africa Textile Chemicals Market, by Product, 2016 – 2026 (USD Billion)
      Table 19 The Middle-East and Africa Textile Chemicals Market, by Application, 2016 – 2026 (USD Billion)
      Table 20 Global Textile Chemicals Market - Company Revenue Analysis, 2016 – 2019 (USD Billion)
      Table 21 Global Textile Chemicals Market - Company Revenue Share Analysis, 2016 – 2019 (%)
      Table 22 Acquisitions and Mergers
      Table 23 Market Drivers – Impact Analysis
      Table 24 Market Restraints
      Table 25 Market Opportunities
      Table 26 Major Buyers of Textile Chemicals
      Table 27 Distributors/Traders of Textile Chemicals by Region
      

Industry Major Market Players

  • Archroma
  • Huntsman
  • DIC Corporation
  • Kiri Industries Ltd.
  • Covestro AG
  • Omnova Solutions Inc.
  • Lubrizol Corporation
  • Solvay S.A.
  • Evonik Industries
  • Tanatext Chemicals
  • Rudolf GmbH
  • NICCA Chemical Co. Ltd.
  • Kemin Industries Inc.
  • JINTEX Ltd.
  • Dow
  • Wacker Chemie AG
  • Huntsman International Inc.
  • Sarex Chemicals