Search Market Research Report

Discover Our Latest Reports
Discover Our Featured Reports
Discover Top Selling Reports

Team Collaboration Software Market Size, Share Global Analysis Report, , 2021 – 2026

report img

Team Collaboration Software Market By Software Type (Communication, Conferencing, and Coordination), By Deployment Mode (Cloud-based and On-Premise based), By Enterprise Size (Small and Medium Enterprise (SMEs), and Large Enterprise), By End-User (Banking, Financial Services and Insurance (BFSI), IT and Telecommunications, Manufacturing, Retail and Consumer Goods, Healthcare, Transportation and Logistics, Education, and Others): Global Industry Perspective, Comprehensive Analysis, and Forecast, 2021 – 2026

Industry Insights

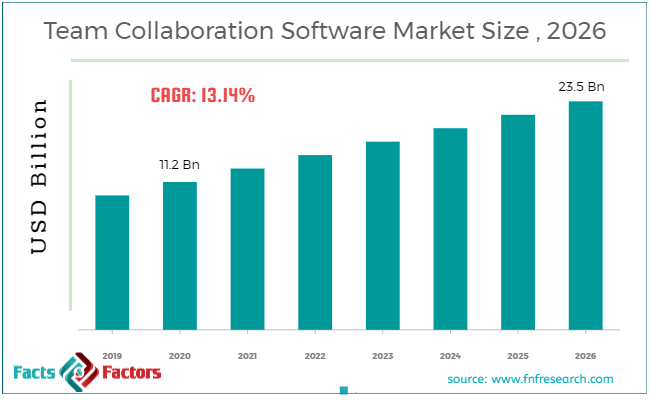
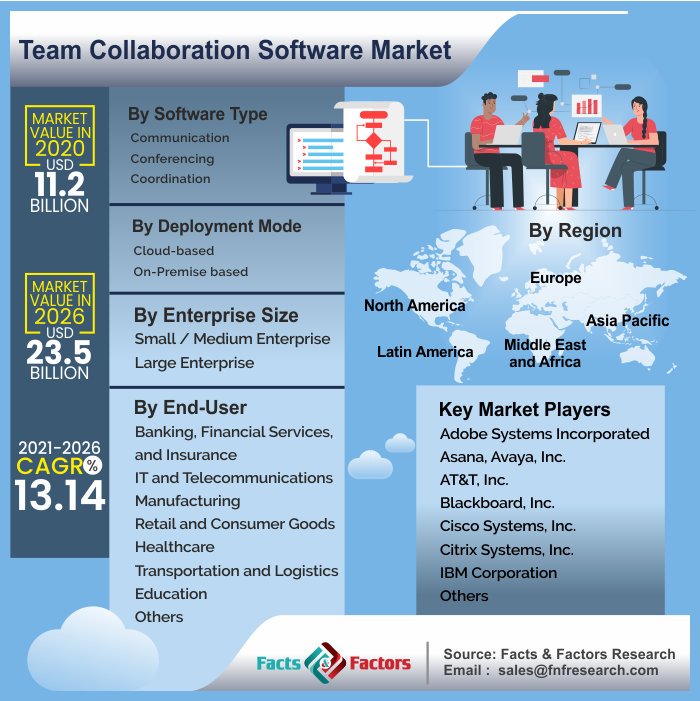
[197+ Pages Report] As per the Facts and Factors market research report, the global team collaboration software market generated sales revenue of USD 11.2 Billion in 2020. Further, the team collaboration software sales are expected to generate revenue of USD 23.5 Billion by the end of 2026, increasing at a CAGR of around 13.14% from 2021 to 2026.

Team Collaboration Software Market Size

To know more about this report | Request Free Sample Copy

logoMarket Overview

Many businesses have adopted distributed workforces as the new standard, prompting businesses all around the world to implement team collaboration software to ensure that workers can work together smoothly from anywhere at any time. Individual employee productivity and project success are dependent on team collaboration. Collaboration software for teams can help save costs, shorten deadlines, boost productivity, and increase return on investment (ROI). Businesses have begun to use team collaboration software to keep their employees connected, even if they come from different regions and cultures, to share a shared purpose and strengthen team relationships. Team collaboration software helps the entire workforce from top to bottom coordinate. This coordination can be done using a communication channel at an individual level or team level. Team collaboration software has made working collaboratively easier for businesses with multiple offices around the world or having their employees working remotely in different parts of the world.

logoIndustry Growth Factor

The team collaboration software market is driven mainly by the increasingly remote workforce and the need for them to stay connected from anywhere at any time. Positive growth in the adoption of team collaboration software by businesses around the world is surging since the COVID-19 pandemic. Governments around the world have imposed lockdown and strict regulations for maintaining social distancing to stop the spread of the coronavirus. Thus several organizations have prompted their employees to work from home. Disruptions in business operations have been faced by many end-users such as BFSI, education, manufacturing, and others due to COVID-19 Pandemic. Due to this many industries have adopted collaboration software solutions to ease the work pressure among employees and navigate revenue growth.

In addition, large-scale adoption of this software offers benefits such as process cost-saving, strengthen relationships among team members, shorten deadlines, and increased productivity. The usage of team collaboration software as a platform, as well as technological advancements, is expected to provide many opportunities for the industry to grow.

logoSegmentation Analysis

The study provides a decisive view of the global team collaboration software market by segmenting it based on software type, deployment mode, enterprise size, end-user, and geographic regions. The software type segment is categorized into communication, conferencing, and coordination. Cloud-based and On-Premise based is the deployment mode segment of the global team collaboration software market. To offer better target customer analysis, our analyst further bifurcates the enterprise size segment into small and medium-size enterprise, and large size enterprises. In addition, to understand the industry, our analyst classified end-users segment by banking, financial services and insurance (BFSI), IT and telecommunications, manufacturing, retail and consumer goods, healthcare, transportation and logistics, education, and others.

team-collaboration-software-market

To know more about this report | Request Free Sample Copy

logo Report Scope

Report Attribute

Details

Market Size in 2020

USD 11.2 Billion

Projected Market Size in 2026

USD 23.5 Billion

CAGR Growth Rate

13.14% CAGR

Base Year

2020

Forecast Years

2021-2026

Key Market Players

Adobe Systems Incorporated, Asana, Avaya, Inc., AT&T, Inc., Blackboard, Inc., Cisco Systems, Inc., Citrix Systems, Inc., IBM Corporation, and Others

Key Segments

Software Type, Deployment Mode, Enterprise Size, End-User, and Region

Major Regions Covered

North America, Europe, Asia Pacific, Latin America, and Middle East & Africa

Purchase Options

Request customized purchase options to meet your research needs. Explore purchase options

logo Regional Analysis

Based on regions, the global team collaboration software market can be divided into five main regions namely North America, Europe, Asia Pacific, Latin America, and The Middle East and Africa.

North America holds the largest market share in the global team collaboration software market. The dominance in this region is primarily due to financial stability, rising IT expenditures, and technological advancements. Most importantly, the growing adoption of communication tools for internal data sharing and project activities along with the end-to-end data transfer and encrypted data transmission in terms of security measures is projected to bolster the market in North America. The rising penetration of the Internet coupled with the increasing of collaboration tools to support the work from home measures being followed during the time of the pandemic are likely to prompt team collaboration software market growth. High investments in infrastructure, a rising number of service providers, and an unprecedented surge in the number of smartphone users are the reasons for the Asia Pacific region to witness the fastest growth in the global team collaboration software market over the forecast period. Nations such as India and Japan are witnessing rapid industrialization. Recently, India was reported to be the second-most sought-after manufacturing destination in the world. In addition, the government's Make in India initiative has emphasized the necessity for efficient team collaboration software solutions.

logo Competitive Players

Some of the key players in the team collaboration software market are

  • Adobe Systems Incorporated
  • Asana
  • Avaya Inc.
  • AT&T Inc.
  • Blackboard Inc.
  • Cisco Systems Inc.
  • Citrix Systems Inc.
  • IBM Corporation
  • Microsoft Corporation
  • Oracle Corporation
  • Slack Technologies Inc.
  • Trello
  • Team Viewer GmbH

The global team collaboration software market is segmented into:

logo By Software Type

  • Communication
  • Conferencing
  • Coordination

logo By Deployment Mode

  • Cloud-based
  • On-Premise based

logo By Enterprise Size

  • Small and Medium Enterprise (SMEs)
  • Large Enterprise

logo By End-User

  • Banking, Financial Services, and Insurance
  • IT and Telecommunications
  • Manufacturing
  • Retail and Consumer Goods
  • Healthcare
  • Transportation and Logistics
  • Education
  • Others

logo By Region

  • North America
    • The U.S.
    • Canada
  • Europe
    • France
    • The UK
    • Spain
    • Germany
    • Italy
    • Rest of Europe
  • Asia Pacific
    • China
    • Japan
    • India
    • South Korea
    • Southeast Asia
    • Rest of Asia Pacific
  • Latin America
    • Brazil
    • Mexico
    • Rest of Latin America
  • Middle East & Africa
    • GCC
    • South Africa
    • Rest of Middle East & Africa

Table of Content

  1. Chapter 1 Executive Summary
    1. 1.1. Introduction of Team Collaboration Software
    2. 1.2. Global Team Collaboration Software Market, 2020 & 2026 (USD Billion)
    3. 1.3. Global Team Collaboration Software Market, 2016 – 2026 (USD Billion)
    4. 1.4. Global Team Collaboration Software Market Absolute Revenue Opportunity, 2016 – 2026 (USD Billion)
    5. 1.5. Global Team Collaboration Software Market Incremental Revenue Opportunity, 2020 – 2026 (USD Billion)
    6. 1.6. COVID-19 Impacts on Virtual Communication Market
      1. 1.6.1. COVID-19 Impact on the Players
      2. 1.6.2. Business Strategies and Recommendations
  2. Chapter 2 Team Collaboration Software Market – Software Type Analysis
    1. 2.1. Global Team Collaboration Software Market – Software Type Overview
    2. 2.2. Global Team Collaboration Software Market Share, by Software Type, 2020 & 2026 (USD Billion)
    3. 2.3. Communication
      1. 2.3.1. Global Communication Team Collaboration Software Market, 2016 – 2026 (USD Billion)
    4. 2.4. Conferencing
      1. 2.4.1. Global Conferencing Team Collaboration Software Market, 2016 – 2026 (USD Billion)
    5. 2.5. Coordination
      1. 2.5.1. Global Coordination Team Collaboration Software Market, 2016 – 2026 (USD Billion)
  3. Chapter 3 Team Collaboration Software Market – Deployment Type Analysis
    1. 3.1. Global Team Collaboration Software Market – Deployment Type Overview
    2. 3.2. Global Team Collaboration Software Market Share, by Deployment Type, 2020 & 2026 (USD Billion)
    3. 3.3. Cloud-Based
      1. 3.3.1. Global Cloud-Based Team Collaboration Software Market, 2016 – 2026 (USD Billion)
    4. 3.4. On-Premise
      1. 3.4.1. Global On-Premise Team Collaboration Software Market, 2016 – 2026 (USD Billion)
  4. Chapter 4 Team Collaboration Software Market – Enterprise Size Analysis
    1. 4.1. Global Team Collaboration Software Market – Enterprise Size Overview
    2. 4.2. Global Team Collaboration Software Market Share, by Enterprise Size, 2020 & 2026 (USD Billion)
    3. 4.3. SME's
      1. 4.3.1. Global SME's Team Collaboration Software Market, 2016 – 2026 (USD Billion)
    4. 4.4. Large Enterprise
      1. 4.4.1. Global Large Enterprise Team Collaboration Software Market, 2016 – 2026 (USD Billion)
  5. Chapter 5 Team Collaboration Software Market – End-User Analysis
    1. 5.1. Global Team Collaboration Software Market – End-User Overview
    2. 5.2. Global Team Collaboration Software Market Share, by End-User, 2020 & 2026 (USD Billion)
    3. 5.3. BFSI
      1. 5.3.1. Global BFSI Team Collaboration Software Market, 2016 – 2026 (USD Billion)
    4. 5.4. IT & Telecommunications
      1. 5.4.1. Global IT & Telecommunications Team Collaboration Software Market, 2016 – 2026 (USD Billion)
    5. 5.5. Manufacturing
      1. 5.5.1. Global Manufacturing Team Collaboration Software Market, 2016 – 2026 (USD Billion)
    6. 5.6. Retail & Consumer Goods
      1. 5.6.1. Global Retail & Consumer Goods Team Collaboration Software Market, 2016 – 2026 (USD Billion)
    7. 5.7. Healthcare
      1. 5.7.1. Global Healthcare Team Collaboration Software Market, 2016 – 2026 (USD Billion)
    8. 5.8. Transportation & Logistics
      1. 5.8.1. Global Transportation & Logistics Team Collaboration Software Market, 2016 – 2026 (USD Billion)
    9. 5.9. Education
      1. 5.9.1. Global Education Team Collaboration Software Market, 2016 – 2026 (USD Billion)
    10. 5.10. Others
      1. 5.10.1. Global Others Team Collaboration Software Market, 2016 – 2026 (USD Billion)
  6. Chapter 6 Team Collaboration Software Market – Regional Analysis
    1. 6.1. Global Team Collaboration Software Market Regional Overview
    2. 6.2. Global Team Collaboration Software Market Share, by Region, 2020 & 2026 (USD Billion)
    3. 6.3. North America
      1. 6.3.1. North America Team Collaboration Software Market, 2016 – 2026 (USD Billion)
        1. 6.3.1.1. North America Team Collaboration Software Market, by Country, 2016 - 2026 (USD Billion)
      2. 6.3.2. North America Team Collaboration Software Market, by Software Type, 2016 – 2026
        1. 6.3.2.1. North America Team Collaboration Software Market, by Software Type, 2016 – 2026 (USD Billion)
      3. 6.3.3. North America Team Collaboration Software Market, by Deployment Type, 2016 – 2026
        1. 6.3.3.1. North America Team Collaboration Software Market, by Deployment Type, 2016 – 2026 (USD Billion)
      4. 6.3.4. North America Team Collaboration Software Market, by Enterprise Size, 2016 – 2026
        1. 6.3.4.1. North America Team Collaboration Software Market, by Enterprise Size, 2016 – 2026 (USD Billion)
      5. 6.3.5. North America Team Collaboration Software Market, by End-User, 2016 – 2026
        1. 6.3.5.1. North America Team Collaboration Software Market, by End-User, 2016 – 2026 (USD Billion)
      6. 6.3.6. U.S.
        1. 6.3.6.1. U.S. Team Collaboration Software Market, 2016 – 2026 (USD Billion)
      7. 6.3.7. Canada
        1. 6.3.7.1. Canada Team Collaboration Software Market, 2016 – 2026 (USD Billion)
    4. 6.4. Europe
      1. 6.4.1. Europe Team Collaboration Software Market, 2016 – 2026 (USD Billion)
        1. 6.4.1.1. Europe Team Collaboration Software Market, by Country, 2016 - 2026 (USD Billion)
      2. 6.4.2. Europe Team Collaboration Software Market, by Software Type, 2016 – 2026
        1. 6.4.2.1. Europe Team Collaboration Software Market, by Software Type, 2016 – 2026 (USD Billion)
      3. 6.4.3. Europe Team Collaboration Software Market, by Deployment Type, 2016 – 2026
        1. 6.4.3.1. Europe Team Collaboration Software Market, by Deployment Type, 2016 – 2026 (USD Billion)
      4. 6.4.4. Europe Team Collaboration Software Market, by Enterprise Size, 2016 – 2026
        1. 6.4.4.1. Europe Team Collaboration Software Market, by Enterprise Size, 2016 – 2026 (USD Billion)
      5. 6.4.5. Europe Team Collaboration Software Market, by End-User, 2016 – 2026
        1. 6.4.5.1. Europe Team Collaboration Software Market, by End-User, 2016 – 2026 (USD Billion)
      6. 6.4.6. Germany
        1. 6.4.6.1. Germany Team Collaboration Software Market, 2016 – 2026 (USD Billion)
      7. 6.4.7. France
        1. 6.4.7.1. France Team Collaboration Software Market, 2016 – 2026 (USD Billion)
      8. 6.4.8. U.K.
        1. 6.4.8.1. U.K. Team Collaboration Software Market, 2016 – 2026 (USD Billion)
      9. 6.4.9. Italy
        1. 6.4.9.1. Italy Team Collaboration Software Market, 2016 – 2026 (USD Billion)
      10. 6.4.10. Spain
        1. 6.4.10.1. Spain Team Collaboration Software Market, 2016 – 2026 (USD Billion)
      11. 6.4.11. Rest of Europe
        1. 6.4.11.1. Rest of Europe Team Collaboration Software Market, 2016 – 2026 (USD Billion)
    5. 6.5. Asia Pacific
      1. 6.5.1. Asia Pacific Team Collaboration Software Market, 2016 – 2026 (USD Billion)
        1. 6.5.1.1. Asia Pacific Team Collaboration Software Market, by Country, 2016 - 2026 (USD Billion)
      2. 6.5.2. Asia Pacific Team Collaboration Software Market, by Software Type, 2016 – 2026
        1. 6.5.2.1. Asia Pacific Team Collaboration Software Market, by Software Type, 2016 – 2026 (USD Billion)
      3. 6.5.3. Asia Pacific Team Collaboration Software Market, by Deployment Type, 2016 – 2026
        1. 6.5.3.1. Asia Pacific Team Collaboration Software Market, by Deployment Type, 2016 – 2026 (USD Billion)
      4. 6.5.4. Asia Pacific Team Collaboration Software Market, by Enterprise Size, 2016 – 2026
        1. 6.5.4.1. Asia Pacific Team Collaboration Software Market, by Enterprise Size, 2016 – 2026 (USD Billion)
      5. 6.5.5. Asia Pacific Team Collaboration Software Market, by End-User, 2016 – 2026
        1. 6.5.5.1. Asia Pacific Team Collaboration Software Market, by End-User, 2016 – 2026 (USD Billion)
      6. 6.5.6. China
        1. 6.5.6.1. China Team Collaboration Software Market, 2016 – 2026 (USD Billion)
      7. 6.5.7. Japan
        1. 6.5.7.1. Japan Team Collaboration Software Market, 2016 – 2026 (USD Billion)
      8. 6.5.8. India
        1. 6.5.8.1. India Team Collaboration Software Market, 2016 – 2026 (USD Billion)
      9. 6.5.9. South Korea
        1. 6.5.9.1. South Korea Team Collaboration Software Market, 2016 – 2026 (USD Billion)
      10. 6.5.10. South-East Asia
        1. 6.5.10.1. South-East Asia Team Collaboration Software Market, 2016 – 2026 (USD Billion)
      11. 6.5.11. Rest of Asia Pacific
        1. 6.5.11.1. Rest of Asia Pacific Team Collaboration Software Market, 2016 – 2026 (USD Billion)
    6. 6.6. Latin America
      1. 6.6.1. Latin America Team Collaboration Software Market, 2016 – 2026 (USD Billion)
        1. 6.6.1.1. Latin America Team Collaboration Software Market, by Country, 2016 - 2026 (USD Billion)
      2. 6.6.2. Latin America Team Collaboration Software Market, by Software Type, 2016 – 2026
        1. 6.6.2.1. Latin America Team Collaboration Software Market, by Software Type, 2016 – 2026 (USD Billion)
      3. 6.6.3. Latin America Team Collaboration Software Market, by Deployment Type, 2016 – 2026
        1. 6.6.3.1. Latin America Team Collaboration Software Market, by Deployment Type, 2016 – 2026 (USD Billion)
      4. 6.6.4. Latin America Team Collaboration Software Market, by Enterprise Size, 2016 – 2026
        1. 6.6.4.1. Latin America Team Collaboration Software Market, by Enterprise Size, 2016 – 2026 (USD Billion)
      5. 6.6.5. Latin America Team Collaboration Software Market, by End-User, 2016 – 2026
        1. 6.6.5.1. Latin America Team Collaboration Software Market, by End-User, 2016 – 2026 (USD Billion)
      6. 6.6.6. Brazil
        1. 6.6.6.1. Brazil Team Collaboration Software Market, 2016 – 2026 (USD Billion)
      7. 6.6.7. Mexico
        1. 6.6.7.1. Mexico Team Collaboration Software Market, 2016 – 2026 (USD Billion)
      8. 6.6.8. Rest of Latin America
        1. 6.6.8.1. Rest of Latin America Team Collaboration Software Market, 2016 – 2026 (USD Billion)
    7. 6.7. The Middle-East and Africa
      1. 6.7.1. The Middle-East and Africa Team Collaboration Software Market, 2016 – 2026 (USD Billion)
        1. 6.7.1.1. The Middle-East and Africa Team Collaboration Software Market, by Country, 2016 - 2026 (USD Billion)
      2. 6.7.2. The Middle-East and Africa Team Collaboration Software Market, by Software Type, 2016 – 2026
        1. 6.7.2.1. The Middle-East and Africa Team Collaboration Software Market, by Software Type, 2016 – 2026 (USD Billion)
      3. 6.7.3. The Middle-East and Africa Team Collaboration Software Market, by Deployment Type, 2016 – 2026
        1. 6.7.3.1. The Middle-East and Africa Team Collaboration Software Market, by Deployment Type, 2016 – 2026 (USD Billion)
      4. 6.7.4. The Middle-East and Africa Team Collaboration Software Market, by Enterprise Size, 2016 – 2026
        1. 6.7.4.1. The Middle-East and Africa Team Collaboration Software Market, by Enterprise Size, 2016 – 2026 (USD Billion)
      5. 6.7.5. The Middle-East and Africa Team Collaboration Software Market, by End-User, 2016 – 2026
        1. 6.7.5.1. The Middle-East and Africa Team Collaboration Software Market, by End-User, 2016 – 2026 (USD Billion)
      6. 6.7.6. GCC Countries
        1. 6.7.6.1. GCC Countries Team Collaboration Software Market, 2016 – 2026 (USD Billion)
      7. 6.7.7. South Africa
        1. 6.7.7.1. South Africa Team Collaboration Software Market, 2016 – 2026 (USD Billion)
      8. 6.7.8. Rest of Middle-East Africa
        1. 6.7.8.1. Rest of Middle-East Africa Team Collaboration Software Market, 2016 – 2026 (USD Billion)
  7. Chapter 7 Team Collaboration Software Market – Competitive Landscape
    1. 7.1. Competitor Market Share – Revenue
    2. 7.2. Market Concentration Rate Analysis, Top 3 and Top 5 Players
    3. 7.3. Strategic Developments
      1. 7.3.1. Acquisitions and Mergers
      2. 7.3.2. New Products
      3. 7.3.3. Research & Development Activities
  8. Chapter 8 Company Profiles
    1. 8.1. Adobe Systems Incorporated
      1. 8.1.1. Company Overview
      2. 8.1.2. Product/Service Portfolio
      3. 8.1.3. Adobe Systems Incorporated Sales, Revenue, and Gross Margin
      4. 8.1.4. Adobe Systems Incorporated Revenue and Growth Rate
      5. 8.1.5. Adobe Systems Incorporated Market Share
      6. 8.1.6. Recent Initiatives, Funding/VC Activities, and Technological Innovations
    2. 8.2. Asana
      1. 8.2.1. Company Overview
      2. 8.2.2. Product/Service Portfolio
      3. 8.2.3. Asana Sales, Revenue, and Gross Margin
      4. 8.2.4. Asana Revenue and Growth Rate
      5. 8.2.5. Asana Market Share
      6. 8.2.6. Recent Initiatives, Funding/VC Activities, and Technological Innovations
    3. 8.3. Avaya, Inc.
      1. 8.3.1. Company Overview
      2. 8.3.2. Product/Service Portfolio
      3. 8.3.3. Avaya, Inc. Sales, Revenue, and Gross Margin
      4. 8.3.4. Avaya, Inc. Revenue and Growth Rate
      5. 8.3.5. Avaya, Inc. Market Share
      6. 8.3.6. Recent Initiatives, Funding/VC Activities, and Technological Innovations
    4. 8.4. AT&T, Inc.
      1. 8.4.1. Company Overview
      2. 8.4.2. Product/Service Portfolio
      3. 8.4.3. AT&T, Inc. Sales, Revenue, and Gross Margin
      4. 8.4.4. AT&T, Inc. Revenue and Growth Rate
      5. 8.4.5. AT&T, Inc. Market Share
      6. 8.4.6. Recent Initiatives, Funding/VC Activities, and Technological Innovations
    5. 8.5. Blackboard, Inc.
      1. 8.5.1. Company Overview
      2. 8.5.2. Product/Service Portfolio
      3. 8.5.3. Blackboard, Inc. Sales, Revenue, and Gross Margin
      4. 8.5.4. Blackboard, Inc. Revenue and Growth Rate
      5. 8.5.5. Blackboard, Inc. Market Share
      6. 8.5.6. Recent Initiatives, Funding/VC Activities, and Technological Innovations
    6. 8.6. Cisco Systems, Inc.
      1. 8.6.1. Company Overview
      2. 8.6.2. Product/Service Portfolio
      3. 8.6.3. Cisco Systems, Inc. Sales, Revenue, and Gross Margin
      4. 8.6.4. Cisco Systems, Inc. Revenue and Growth Rate
      5. 8.6.5. Cisco Systems, Inc. Market Share
      6. 8.6.6. Recent Initiatives, Funding/VC Activities, and Technological Innovations
    7. 8.7. Citrix Systems, Inc.
      1. 8.7.1. Company Overview
      2. 8.7.2. Product/Service Portfolio
      3. 8.7.3. Citrix Systems, Inc. Sales, Revenue, and Gross Margin
      4. 8.7.4. Citrix Systems, Inc. Revenue and Growth Rate
      5. 8.7.5. Citrix Systems, Inc. Market Share
      6. 8.7.6. Recent Initiatives, Funding/VC Activities, and Technological Innovations
    8. 8.8. IBM Corporation
      1. 8.8.1. Company Overview
      2. 8.8.2. Product/Service Portfolio
      3. 8.8.3. IBM Corporation Sales, Revenue, and Gross Margin
      4. 8.8.4. IBM Corporation Revenue and Growth Rate
      5. 8.8.5. IBM Corporation Market Share
      6. 8.8.6. Recent Initiatives, Funding/VC Activities, and Technological Innovations
    9. 8.9. Microsoft Corporation
      1. 8.9.1. Company Overview
      2. 8.9.2. Product/Service Portfolio
      3. 8.9.3. Microsoft Corporation Sales, Revenue, and Gross Margin
      4. 8.9.4. Microsoft Corporation Revenue and Growth Rate
      5. 8.9.5. Microsoft Corporation Market Share
      6. 8.9.6. Recent Initiatives, Funding/VC Activities, and Technological Innovations
    10. 8.10. Oracle Corporation
      1. 8.10.1. Company Overview
      2. 8.10.2. Product/Service Portfolio
      3. 8.10.3. Oracle Corporation Sales, Revenue, and Gross Margin
      4. 8.10.4. Oracle Corporation Revenue and Growth Rate
      5. 8.10.5. Oracle Corporation Market Share
      6. 8.10.6. Recent Initiatives, Funding/VC Activities, and Technological Innovations
    11. 8.11. Slack Technologies, Inc.
      1. 8.11.1. Company Overview
      2. 8.11.2. Product/Service Portfolio
      3. 8.11.3. Slack Technologies, Inc. Sales, Revenue, and Gross Margin
      4. 8.11.4. Slack Technologies, Inc. Revenue and Growth Rate
      5. 8.11.5. Slack Technologies, Inc. Market Share
      6. 8.11.6. Recent Initiatives, Funding/VC Activities, and Technological Innovations
    12. 8.12. Trello
      1. 8.12.1. Company Overview
      2. 8.12.2. Product/Service Portfolio
      3. 8.12.3. Trello Sales, Revenue, and Gross Margin
      4. 8.12.4. Trello Revenue and Growth Rate
      5. 8.12.5. Trello Market Share
      6. 8.12.6. Recent Initiatives, Funding/VC Activities, and Technological Innovations
    13. 8.13. TeamViewer GmbH
      1. 8.13.1. Company Overview
      2. 8.13.2. Product/Service Portfolio
      3. 8.13.3. TeamViewer GmbH Sales, Revenue, and Gross Margin
      4. 8.13.4. TeamViewer GmbH Revenue and Growth Rate
      5. 8.13.5. TeamViewer GmbH Market Share
      6. 8.13.6. Recent Initiatives, Funding/VC Activities, and Technological Innovations
  9. Chapter 9 Team Collaboration Software — Industry Analysis
    1. 9.1. Introduction and Taxonomy
    2. 9.2. Team Collaboration Software Market – Key Trends
      1. 9.2.1. Market Drivers
      2. 9.2.2. Market Restraints
      3. 9.2.3. Market Opportunities
    3. 9.3. Porter’s Five Forces Model
      1. 9.3.1. Bargaining Power of Buyers
      2. 9.3.2. Bargaining Power of Suppliers
      3. 9.3.3. Threat of Substitute
      4. 9.3.4. Threat of New Entrants
      5. 9.3.5. Rivalry among Existing Competitors
    4. 9.4. PESTEL Analysis
    5. 9.5. Key Mandates and Regulations
    6. 9.6. Technology Roadmap and Timeline
    7. 9.7. Team Collaboration Software Market – Attractiveness Analysis
      1. 9.7.1. By Software Type
      2. 9.7.2. By Deployment Type
      3. 9.7.3. By Enterprise Size
      4. 9.7.4. By End-User
      5. 9.7.5. By Region
  10. Chapter 10 Report Conclusion & Key Insights
    1. 10.1. Key Insights from Primary Interviews & Surveys Respondents
    2. 10.2. Key Takeaways from Analysts, Consultants, and Industry Leaders
  11. Chapter 11 Research Approach & Methodology
    1. 11.1. Report Description
    2. 11.2. Research Scope
    3. 11.3. Research Methodology
      1. 11.3.1. Secondary Research
      2. 11.3.2. Primary Research
      3. 11.3.3. Statistical Models
        1. 11.3.3.1. Company Share Analysis Model
        2. 11.3.3.2. Revenue Based Modeling
      4. 11.3.4. Research Limitations

      List of Figures

      Fig.1	Product Picture of Team Collaboration Software
      Fig.2	Global Team Collaboration Software Market, 2016 – 2026 (USD Billion)
      Fig.3	Global Team Collaboration Software Market Absolute Revenue Opportunity, 2016 – 2026 (USD Billion)
      Fig.4	Global Team Collaboration Software Market Incremental Revenue Opportunity, 2020 – 2026 (USD Billion)
      Fig.5	COVID-19 Impacts on Virtual Communication Market
      Fig.6	COVID-19 Impact on the Players
      Fig.7	Business Strategies and Recommendations
      Fig.8	Global Team Collaboration Software Market Share, by Software Type, 2020 & 2026 (USD Billion)
      Fig.9	Global Communication Team Collaboration Software Market, 2016 – 2026 (USD Billion)
      Fig.10	Global Conferencing Team Collaboration Software Market, 2016 – 2026 (USD Billion)
      Fig.11	Global Coordination Team Collaboration Software Market, 2016 – 2026 (USD Billion)
      Fig.12	Global Team Collaboration Software Market Share, by Deployment Type, 2020 & 2026 (USD Billion)
      Fig.13	Global Cloud-Based Team Collaboration Software Market, 2016 – 2026 (USD Billion)
      Fig.14	Global On-Premise Team Collaboration Software Market, 2016 – 2026 (USD Billion)
      Fig.15	Global Team Collaboration Software Market Share, by Enterprise Size, 2020 & 2026 (USD Billion)
      Fig.16	Global SME's Team Collaboration Software Market, 2016 – 2026 (USD Billion)
      Fig.17	Global Large Enterprise Team Collaboration Software Market, 2016 – 2026 (USD Billion)
      Fig.18	Global Team Collaboration Software Market Share, by End-User, 2020 & 2026 (USD Billion)
      Fig.19	Global BFSI Team Collaboration Software Market, 2016 – 2026 (USD Billion)
      Fig.20	Global IT & Telecommunications Team Collaboration Software Market, 2016 – 2026 (USD Billion)
      Fig.21	Global Manufacturing Team Collaboration Software Market, 2016 – 2026 (USD Billion)
      Fig.22	Global Retail & Consumer Goods Team Collaboration Software Market, 2016 – 2026 (USD Billion)
      Fig.23	Global Healthcare Team Collaboration Software Market, 2016 – 2026 (USD Billion)
      Fig.24	Global Transportation & Logistics Team Collaboration Software Market, 2016 – 2026 (USD Billion)
      Fig.25	Global Education Team Collaboration Software Market, 2016 – 2026 (USD Billion)
      Fig.26	Global Others Team Collaboration Software Market, 2016 – 2026 (USD Billion)
      Fig.27	Global Team Collaboration Software Market Share, by Region, 2020 & 2026 (USD Billion)
      Fig.28	North America Team Collaboration Software Market, 2016 – 2026 (USD Billion)
      Fig.29	U.S. Team Collaboration Software Market, 2016 – 2026 (USD Billion)
      Fig.30	Canada Team Collaboration Software Market, 2016 – 2026 (USD Billion)
      Fig.31	Europe Team Collaboration Software Market, 2016 – 2026 (USD Billion)
      Fig.32	Germany Team Collaboration Software Market, 2016 – 2026 (USD Billion)
      Fig.33	France Team Collaboration Software Market, 2016 – 2026 (USD Billion)
      Fig.34	U.K. Team Collaboration Software Market, 2016 – 2026 (USD Billion)
      Fig.35	Italy Team Collaboration Software Market, 2016 – 2026 (USD Billion)
      Fig.36	Spain Team Collaboration Software Market, 2016 – 2026 (USD Billion)
      Fig.37	Rest of Europe Team Collaboration Software Market, 2016 – 2026 (USD Billion)
      Fig.38	Asia Pacific Team Collaboration Software Market, 2016 – 2026 (USD Billion)
      Fig.39	China Team Collaboration Software Market, 2016 – 2026 (USD Billion)
      Fig.40	Japan Team Collaboration Software Market, 2016 – 2026 (USD Billion)
      Fig.41	India Team Collaboration Software Market, 2016 – 2026 (USD Billion)
      Fig.42	South  Korea Team Collaboration Software Market, 2016 – 2026 (USD Billion)
      Fig.43	South-East Asia Team Collaboration Software Market, 2016 – 2026 (USD Billion)
      Fig.44	Rest of Asia Pacific Team Collaboration Software Market, 2016 – 2026 (USD Billion)
      Fig.45	Latin America Team Collaboration Software Market, 2016 – 2026 (USD Billion)
      Fig.46	Brazil Team Collaboration Software Market, 2016 – 2026 (USD Billion)
      Fig.47	Mexico Team Collaboration Software Market, 2016 – 2026 (USD Billion)
      Fig.48	Rest of Latin America Team Collaboration Software Market, 2016 – 2026 (USD Billion)
      Fig.49	The Middle-East and Africa Team Collaboration Software Market, 2016 – 2026 (USD Billion)
      Fig.50	GCC Countries Team Collaboration Software Market, 2016 – 2026 (USD Billion)
      Fig.51	South Africa Team Collaboration Software Market, 2016 – 2026 (USD Billion)
      Fig.52	Rest of Middle-East Africa Team Collaboration Software Market, 2016 – 2026 (USD Billion)
      Fig.53	Competitor Market Share – Revenue
      Fig.54	Adobe Systems Incorporated Revenue and Growth Rate
      Fig.55	Adobe Systems Incorporated Market Share
      Fig.56	Asana Revenue and Growth Rate
      Fig.57	Asana Market Share
      Fig.58	Avaya, Inc. Revenue and Growth Rate
      Fig.59	Avaya, Inc. Market Share
      Fig.60	AT&T, Inc. Revenue and Growth Rate
      Fig.61	AT&T, Inc. Market Share
      Fig.62	Blackboard, Inc. Revenue and Growth Rate
      Fig.63	Blackboard, Inc. Market Share
      Fig.64	Cisco Systems, Inc. Revenue and Growth Rate
      Fig.65	Cisco Systems, Inc. Market Share
      Fig.66	Citrix Systems, Inc. Revenue and Growth Rate
      Fig.67	Citrix Systems, Inc. Market Share
      Fig.68	IBM Corporation Revenue and Growth Rate
      Fig.69	IBM Corporation Market Share
      Fig.70	Microsoft Corporation Revenue and Growth Rate
      Fig.71	Microsoft Corporation Market Share
      Fig.72	Oracle Corporation Revenue and Growth Rate
      Fig.73	Oracle Corporation Market Share
      Fig.74	Slack Technologies, Inc. Revenue and Growth Rate
      Fig.75	Slack Technologies, Inc. Market Share
      Fig.76	Trello Revenue and Growth Rate
      Fig.77	Trello Market Share
      Fig.78	TeamViewer GmbH Revenue and Growth Rate
      Fig.79	TeamViewer GmbH Market Share
      Fig.80	Market Dynamics
      Fig.81	PESTEL Analysis
      Fig.82	Key Mandates and Regulations
      Fig.83	Technology Roadmap and Timeline
      Fig.84	Market Attractiveness Analysis – By Software Type
      Fig.85	Market Attractiveness Analysis – By Deployment Type
      Fig.86	Market Attractiveness Analysis – By Enterprise Size
      Fig.87	Market Attractiveness Analysis – By End-User
      Fig.88	Market Attractiveness Analysis – By Region
      

      List of Tables

      Table 1	Global Team Collaboration Software Market, 2020 & 2026 (USD Billion)
      Table 2	Global Team Collaboration Software Market, by Software Type, 2016 – 2026 (USD Billion)
      Table 3	Global Team Collaboration Software Market, by Deployment Type, 2016 – 2026 (USD Billion)
      Table 4	Global Team Collaboration Software Market, by Enterprise Size, 2016 – 2026 (USD Billion)
      Table 5	Global Team Collaboration Software Market, by End-User, 2016 – 2026 (USD Billion)
      Table 6	Global Team Collaboration Software Market, by Region, 2016 – 2026 (USD Billion)
      Table 7	North America Team Collaboration Software Market, by Country, 2016 – 2026 (USD Billion)
      Table 8	North America Team Collaboration Software Market, by Software Type, 2016 – 2026 (USD Billion)
      Table 9	North America Team Collaboration Software Market, by Deployment Type, 2016 – 2026 (USD Billion)
      Table 10 North America Team Collaboration Software Market, by Enterprise Size, 2016 – 2026 (USD Billion)
      Table 11 North America Team Collaboration Software Market, by End-User, 2016 – 2026 (USD Billion)
      Table 12 Europe Team Collaboration Software Market, by Country, 2016 – 2026 (USD Billion)
      Table 13 Europe Team Collaboration Software Market, by Software Type, 2016 – 2026 (USD Billion)
      Table 14 Europe Team Collaboration Software Market, by Deployment Type, 2016 – 2026 (USD Billion)
      Table 15 Europe Team Collaboration Software Market, by Enterprise Size, 2016 – 2026 (USD Billion)
      Table 16 Europe Team Collaboration Software Market, by End-User, 2016 – 2026 (USD Billion)
      Table 17 Asia Pacific Team Collaboration Software Market, by Country, 2016 – 2026 (USD Billion)
      Table 18 Asia Pacific Team Collaboration Software Market, by Software Type, 2016 – 2026 (USD Billion)
      Table 19 Asia Pacific Team Collaboration Software Market, by Deployment Type, 2016 – 2026 (USD Billion)
      Table 20 Asia Pacific Team Collaboration Software Market, by Enterprise Size, 2016 – 2026 (USD Billion)
      Table 21 Asia Pacific Team Collaboration Software Market, by End-User, 2016 – 2026 (USD Billion)
      Table 22 Latin America Team Collaboration Software Market, by Country, 2016 – 2026 (USD Billion)
      Table 23 Latin America Team Collaboration Software Market, by Software Type, 2016 – 2026 (USD Billion)
      Table 24 Latin America Team Collaboration Software Market, by Deployment Type, 2016 – 2026 (USD Billion)
      Table 25 Latin America Team Collaboration Software Market, by Enterprise Size, 2016 – 2026 (USD Billion)
      Table 26 Latin America Team Collaboration Software Market, by End-User, 2016 – 2026 (USD Billion)
      Table 27 The Middle-East and Africa Team Collaboration Software Market, by Country, 2016 – 2026 (USD Billion)
      Table 28 The Middle-East and Africa Team Collaboration Software Market, by Software Type, 2016 – 2026 (USD Billion)
      Table 29 The Middle-East and Africa Team Collaboration Software Market, by Deployment Type, 2016 – 2026 (USD Billion)
      Table 30 The Middle-East and Africa Team Collaboration Software Market, by Enterprise Size, 2016 – 2026 (USD Billion)
      Table 31 The Middle-East and Africa Team Collaboration Software Market, by End-User, 2016 – 2026 (USD Billion)
      Table 32 Global Team Collaboration Software Market - Company Revenue Analysis, 2016 – 2019 (USD Billion)
      Table 33 Global Team Collaboration Software Market - Company Revenue Share Analysis, 2016 – 2019 (%)
      Table 34 Acquisitions and Mergers
      Table 35 Market Drivers – Impact Analysis
      Table 36 Market Restraints
      Table 37 Market Opportunities
      

Industry Major Market Players

  • Adobe Systems Incorporated
  • Asana
  • Avaya Inc.
  • AT&T Inc.
  • Blackboard Inc.
  • Cisco Systems Inc.
  • Citrix Systems Inc.
  • IBM Corporation
  • Microsoft Corporation
  • Oracle Corporation
  • Slack Technologies Inc.
  • Trello
  • Team Viewer GmbH