Search Market Research Report

Discover Our Latest Reports
Discover Our Featured Reports
Discover Top Selling Reports

Tanker shipment Market Size, Share Global Analysis Report, 2020–2026

report img

Tanker shipment Market By Shipment Type (Oil Tankers, Chemical Tankers, LNG Tankers And Others), By Tanker Type (Ultra Large Crude Carrier (ULCC), Very Large Crude Carrier (VLCC), Suezmax, Large Range 2 (LR2), Large Range 1 (LR1), Medium Range 2 (MR2), Medium Range 1 (MR1), Intermediate Tanker And Small Tanker) And By Transportation Route (Inland, Coastal And Deep Sea): Global Industry Outlook, Market Size, Business Intelligence, Consumer Preferences, Statistical Surveys, Comprehensive Analysis, Historical Developments, Current Trends, and Forecast 2020–2026

Industry Insights

This specialized and expertise oriented industry research report scrutinizes the technical and commercial business outlook of the Tanker shipment industry. The report analyzes and declares the historical and current trends analysis of the tanker shipment industry and subsequently recommends the projected trends anticipated to be observed in the tanker shipment market during the upcoming years.

The tanker shipment market report analyzes and notifies the industry statistics at the global as well as regional and country levels in order to acquire a thorough perspective of the entire tanker shipment market. The historical and past insights are provided for FY 2016 to FY 2019 whereas projected trends are delivered for FY 2020 to FY 2026. The quantitative and numerical data is represented in terms of value (USD Billion) from FY 2016 – 2026.

Tanker shipment Market Size

To know more about this report | Request Free Sample Copy


logoKey Insights from Primary Research

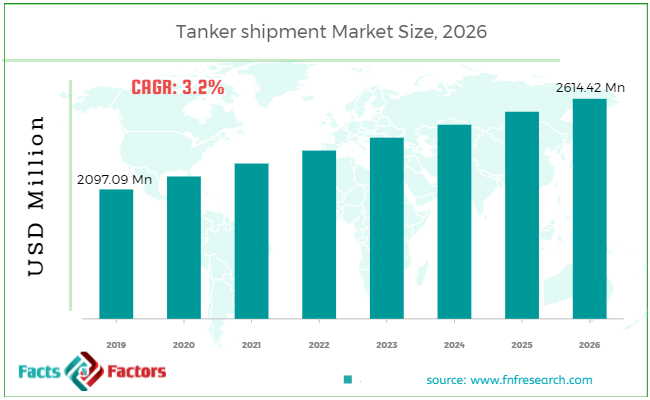
  • Extensive interviews with CXO’s of the major companies operating in the global tanker shipment market, the primary research concludes that the global tanker shipment market to witness a steady growth of nearly 3.2 % over the forecast period.
  • In the year 2019, the market was valued at USD 2097.09 million, in 2019 and is expected to be valued over USD 2614.42 million.
  • On the basis of the shipment type segment, oil tankers dominated the global tanker shipment market in 2019. The chemical tanker shipment is expected to exhibit highest growth rate over the forecast period.
  • The coastal and deep sea are expected to contribute significant transport share in the route based segmentation. The coastal routes are expected to witness rise in tanker shipments especially in the Asia Pacific region and North American region.
  • Asia Pacific market is expected to be the fastest growing region for tanker shipment over the forecast period. Th region is also expected to occupy significant chunk of global tanker shipment market share. The primary growth factor in the region is the strengthening economies and industrial sector in the region.

logoKey Recommendations from Analysts

  • Higher demand for crude oil and chemicals are major factors that are expected to drive the development of the tanker shipment market in the near future.
  • The strategic developments such as regional expansion and product innovations by the major companies is likely to boom the global tanker shipment number over the up-coming years.
  • Our analysts recommend that the Asia Pacific region is predicted to witness a significant growth attributed to the growing demand for tanker shipment from China and India.   
  • Rising economic conditions, growing regional trade especially in emerging market are anticipated to fuel the tanker shipment market growth in the developing regions over the forthcoming years.
  • The Liquified gas transport and chemical transport are expected to remain main stay for global tanker shipment in long distant forecast.

The quantitative data is further underlined and reinforced by comprehensive qualitative data which comprises various across-the-board market dynamics. The rationales which directly or indirectly impact the tanker shipment industry are exemplified through parameters such as growth drivers, restraints, challenges, and opportunities among other impacting factors.

Throughout our research report, we have encompassed all the proven models and tools of industry analysis and extensively illustrated all the key business strategies and business models adopted in the tanker shipment industry. The report provides an all-inclusive and detailed competitive landscape prevalent in the tanker shipment market.

The report utilizes established industry analysis tools and models such as Porter’s Five Forces framework to analyze and recognize critical business strategies adopted by various stakeholders involved in the entire value chain of the tanker shipment industry. The tanker shipment market report additionally employs SWOT analysis and PESTLE analysis models for further in-depth analysis.

The report study further includes an in-depth analysis of industry players' market shares and provides an overview of leading players' market position in the tanker shipment sector. Key strategic developments in the Tanker shipment market competitive landscape such as acquisitions & mergers, inaugurations of different products and services, partnerships & joint ventures, MoU agreements, VC & funding activities, R&D activities, and geographic expansion among other noteworthy activities by key players of the tanker shipment market are appropriately highlighted in the report.

The rising demand for chemicals with the widening application has led to increase in chemical shipments worldwide. In addition to above, expansion of chemical industries in rising economies in the Asia Pacific and the Latin American region has increased the intake of chemicals. These developments have led to increase in volume of chemical shipments which in turn is expected to drive the global tanker shipment market.

Additionally, the crude oil shipment continues to contribute as major shipped liquid. The rise in crude oil production and shipment in different oil extracting countries is expected to fuel the growth of market in foreseeable future. However, long term future of crude oil shipment remains uncertain with the world closely shifting towards ecofriendly energy solutions.

logoReport Scope

Report Attribute

Details

Market Size in 2019

USD 2097.09 Million

Projected Market Size in 2026

USD 2614.42 Million

CAGR Growth Rate

3.2% CAGR

Base Year

2019

Forecast Years

2020-2026

Key Market Players

The Maersk Group, Ship Finance International Limited, Teekay Corp, COSCO, DHT Holdings Inc, Frontline Ltd, Tsakos Energy Navigation, Mitsui O.S.K. Lines, Nordic American Tanker, Orient Overseas Container Line Limited, AET Eastern Pacific Shipping, and Others

Key Segment

By Shipment Type, Tanker Type, Transportation Route, and Region

Major Regions Covered

North America, Europe, Asia Pacific, Latin America, and the Middle East & Africa

Purchase Options

Request customized purchase options to meet your research needs. Explore purchase options

The tanker shipment market research report delivers an acute valuation and taxonomy of the tanker shipment industry by practically splitting the market based on shipment type, tanker type, transportation route and regions. Through the analysis of the historical and projected trends, all the segments and sub-segments were evaluated through the bottom-up approach, and different market sizes have been projected for FY 2020 to FY 2026. The regional segmentation of the tanker shipment industry includes the complete classification of all the major continents including North America, Latin America, Europe, Asia Pacific, and Middle East & Africa. Further, country-wise data for the tanker shipment industry is provided for the leading economies of the world.

The tanker shipment market is segmented based on shipment type, tanker type, transportation route and region. On the basis of shipment type segmentation, the market is classified into oil tankers, chemical tankers, LNG tankers and others. On the basis of tanker type, the market is bifurcated into ultra large crude carrier (ULCC), very large crude carrier (VLCC), suezmax, large range 2 (LR2), large range 1 (LR1), medium range 2 (MR2), medium range 1 (MR1), intermediate tanker and small tanker. On the basis of transportation route, the market is segmented into inland, coastal and deep sea.

logoSome of the essential players operating in the tanker shipment market, but not restricted to include

  • Tsakos Energy Navigation
  • Teekay Corp
  • Frontline Ltd
  • COSCO
  • DHT Holdings Inc
  • Ship Finance International Limited
  • Nordic American Tanker
  • Mitsui O.S.K. Lines
  • Eastern Pacific Shipping
  • The Maersk Group
  • Orient Overseas Container Line Limited and AET.

The taxonomy of the tanker shipment industry by its scope and segmentation is as follow:

logoGlobal Tanker Shipment Market: By Shipment Type Segmentation Analysis

  • Oil Tankers
  • Chemical Tankers
  • LNG Tankers
  • Others

logoGlobal Tanker Shipment Market: By Tanker Type Segmentation Analysis

  • Ultra Large Crude Carrier (ULCC)
  • Very Large Crude Carrier (VLCC)
  • Suezmax
  • Large Range 2 (LR2)
  • Large Range 1 (LR1)
  • Medium Range 2 (MR2)
  • Medium Range 1 (MR1)
  • Intermediate Tanker
  • Small Tanker

logoGlobal Tanker Shipment Market: By Transportation Route Segmentation Analysis

  • Inland
  • Coastal
  • Deep Sea

logoGlobal Tanker Shipment Market: Regional Segmentation Analysis

  • North America
    • The U.S.
    • Canada
  • Europe
    • Germany
    • The UK
    • France
    • Spain
    • Italy
    • Rest of Europe
  • Asia Pacific
    • China
    • Japan
    • India
    • South Korea
    • Southeast Asia
    • Rest of Asia Pacific
  • Latin America
    • Brazil
    • Mexico
    • Rest of Latin America
  • Middle East & Africa
    • GCC
    • South Africa
    • Rest of Middle East & Africa

Table of Content

  1. CHAPTER 1. Executive Summary
  2. CHAPTER 2. Tanker Shipment market – Shipment Type Analysis
    1. 2.1. Global Tanker Shipment Market – Shipment Type Overview
    2. 2.2. Global Tanker Shipment Market Share, by Shipment Type, 2019 & 2026 (USD Billion)
    3. 2.3. Oil Tankers
      1. 2.3.1. Global Oil Tankers Tanker Shipment Market, 2016-2026 (USD Billion)
    4. 2.4. Chemical Tankers,
      1. 2.4.1. Global Chemical Tankers, Tanker Shipment Market, 2016-2026 (USD Billion)
    5. 2.5. LNG Tankers
      1. 2.5.1. Global LNG Tankers Tanker Shipment Market, 2016-2026 (USD Billion)
    6. 2.6. Others
      1. 2.6.1. Global Others Tanker Shipment Market, 2016-2026 (USD Billion)
  3. CHAPTER 3. Tanker Shipment market – Tanker Type Analysis
    1. 3.1. Global Tanker Shipment Market – Tanker Type Overview
    2. 3.2. Global Tanker Shipment Market Share, by Tanker Type, 2019 & 2026 (USD Billion)
    3. 3.3. Ultra Large Crude Carrier (ULCC)
      1. 3.3.1. Global Ultra Large Crude Carrier (ULCC) Tanker Shipment Market, 2016-2026 (USD Billion)
    4. 3.4. Very Large Crude Carrier (VLCC)
      1. 3.4.1. Global Very Large Crude Carrier (VLCC) Tanker Shipment Market, 2016-2026 (USD Billion)
    5. 3.5. Suezmax
      1. 3.5.1. Global Suezmax Tanker Shipment Market, 2016-2026 (USD Billion)
    6. 3.6. Large Range 2 (LR2)
      1. 3.6.1. Global Large Range 2 (LR2) Tanker Shipment Market, 2016-2026 (USD Billion)
    7. 3.7. Large Range 1 (LR1)
      1. 3.7.1. Global Large Range 1 (LR1) Tanker Shipment Market, 2016-2026 (USD Billion)
    8. 3.8. Medium Range 2 (MR2)
      1. 3.8.1. Global Medium Range 2 (MR2) Tanker Shipment Market, 2016-2026 (USD Billion)
    9. 3.9. Medium Range 1 (MR1)
      1. 3.9.1. Global Medium Range 1 (MR1) Tanker Shipment Market, 2016-2026 (USD Billion)
    10. 3.10. Intermediate Tanker
      1. 3.10.1. Global Intermediate Tanker Tanker Shipment Market, 2016-2026 (USD Billion)
    11. 3.11. Small Tanker
      1. 3.11.1. Global Small Tanker Tanker Shipment Market, 2016-2026 (USD Billion)
  4. CHAPTER 4. Tanker Shipment market – Regional Analysis
    1. 4.1. Global Tanker Shipment Market Regional Overview
    2. 4.2. Global Tanker Shipment Market Share, by Region, 2019 & 2026 (Value)
    3. 4.3. North America
      1. 4.3.1. North America Tanker Shipment Market size and forecast, 2016-2026
      2. 4.3.2. North America Tanker Shipment Market, by Country, 2019 & 2026 (USD Billion)
      3. 4.3.3. North America Tanker Shipment Market, by Shipment Type, 2016-2026
        1. 4.3.3.1. North America Tanker Shipment Market, by Shipment Type, 2016-2026 (USD Billion)
      4. 4.3.4. North America Tanker Shipment Market, by Tanker Type, 2016-2026
        1. 4.3.4.1. North America Tanker Shipment Market, by Tanker Type, 2016-2026 (USD Billion)
      5. 4.3.5. U.S.
        1. 4.3.5.1. U.S. Market size and forecast, 2016-2026 (USD Billion)
      6. 4.3.6. Canada
        1. 4.3.6.1. Canada Market size and forecast, 2016-2026 (USD Billion)
    4. 4.4. Europe
      1. 4.4.1. Europe Tanker Shipment Market size and forecast, 2016-2026
      2. 4.4.2. Europe Tanker Shipment Market, by Country, 2019 & 2026 (USD Billion)
      3. 4.4.3. Europe Tanker Shipment Market, by Shipment Type, 2016-2026
        1. 4.4.3.1. Europe Tanker Shipment Market, by Shipment Type, 2016-2026 (USD Billion)
      4. 4.4.4. Europe Tanker Shipment Market, by Tanker Type, 2016-2026
        1. 4.4.4.1. Europe Tanker Shipment Market, by Tanker Type, 2016-2026 (USD Billion)
      5. 4.4.5. Germany
        1. 4.4.5.1. Germany Market size and forecast, 2016-2026 (USD Billion)
      6. 4.4.6. France
        1. 4.4.6.1. France Market size and forecast, 2016-2026 (USD Billion)
      7. 4.4.7. U.K.
        1. 4.4.7.1. U.K. Market size and forecast, 2016-2026 (USD Billion)
      8. 4.4.8. Italy
        1. 4.4.8.1. Italy Market size and forecast, 2016-2026 (USD Billion)
      9. 4.4.9. Spain
        1. 4.4.9.1. Spain Market size and forecast, 2016-2026 (USD Billion)
      10. 4.4.10. Rest of Europe
        1. 4.4.10.1. Rest of Europe Market size and forecast, 2016-2026 (USD Billion)
    5. 4.5. Asia Pacific
      1. 4.5.1. Asia Pacific Tanker Shipment Market size and forecast, 2016-2026
      2. 4.5.2. Asia Pacific Tanker Shipment Market, by Country, 2019 & 2026 (USD Billion)
      3. 4.5.3. Asia Pacific Tanker Shipment Market, by Shipment Type, 2016-2026
        1. 4.5.3.1. Asia Pacific Tanker Shipment Market, by Shipment Type, 2016-2026 (USD Billion)
      4. 4.5.4. Asia Pacific Tanker Shipment Market, by Tanker Type, 2016-2026
        1. 4.5.4.1. Asia Pacific Tanker Shipment Market, by Tanker Type, 2016-2026 (USD Billion)
      5. 4.5.5. China
        1. 4.5.5.1. China Market size and forecast, 2016-2026 (USD Billion)
      6. 4.5.6. Japan
        1. 4.5.6.1. Japan Market size and forecast, 2016-2026 (USD Billion)
      7. 4.5.7. India
        1. 4.5.7.1. India Market size and forecast, 2016-2026 (USD Billion)
      8. 4.5.8. South Korea
        1. 4.5.8.1. South Korea Market size and forecast, 2016-2026 (USD Billion)
      9. 4.5.9. South-East Asia
        1. 4.5.9.1. South-East Asia Market size and forecast, 2016-2026 (USD Billion)
      10. 4.5.10. Rest of Asia Pacific
        1. 4.5.10.1. Rest of Asia Pacific Market size and forecast, 2016-2026 (USD Billion)
    6. 4.6. Latin America
      1. 4.6.1. Latin America Tanker Shipment Market size and forecast, 2016-2026
      2. 4.6.2. Latin America Tanker Shipment Market, by Country, 2019 & 2026 (USD Billion)
      3. 4.6.3. Latin America Tanker Shipment Market, by Shipment Type, 2016-2026
        1. 4.6.3.1. Latin America Tanker Shipment Market, by Shipment Type, 2016-2026 (USD Billion)
      4. 4.6.4. Latin America Tanker Shipment Market, by Tanker Type, 2016-2026
        1. 4.6.4.1. Latin America Tanker Shipment Market, by Tanker Type, 2016-2026 (USD Billion)
      5. 4.6.5. Brazil
        1. 4.6.5.1. Brazil Market size and forecast, 2016-2026 (USD Billion)
      6. 4.6.6. Mexico
        1. 4.6.6.1. Mexico Market size and forecast, 2016-2026 (USD Billion)
      7. 4.6.7. Rest of Latin America
        1. 4.6.7.1. Rest of Latin America Market size and forecast, 2016-2026 (USD Billion)
    7. 4.7. The Middle-East and Africa
      1. 4.7.1. The Middle-East and Africa Tanker Shipment Market size and forecast, 2016-2026
      2. 4.7.2. The Middle-East and Africa Tanker Shipment Market, by Country, 2019 & 2026 (USD Billion)
      3. 4.7.3. The Middle-East and Africa Tanker Shipment Market, by Shipment Type, 2016-2026
        1. 4.7.3.1. The Middle-East and Africa Tanker Shipment Market, by Shipment Type, 2016-2026 (USD Billion)
      4. 4.7.4. The Middle-East and Africa Tanker Shipment Market, by Tanker Type, 2016-2026
        1. 4.7.4.1. The Middle-East and Africa Tanker Shipment Market, by Tanker Type, 2016-2026 (USD Billion)
      5. 4.7.5. GCC Countries
        1. 4.7.5.1. GCC Countries Market size and forecast, 2016-2026 (USD Billion)
      6. 4.7.6. South Africa
        1. 4.7.6.1. South Africa Market size and forecast, 2016-2026 (USD Billion)
      7. 4.7.7. Rest of Middle-East Africa
        1. 4.7.7.1. Rest of Middle-East Africa Market size and forecast, 2016-2026 (USD Billion)
  5. CHAPTER 5. Tanker Shipment market – Competitive Landscape
    1. 5.1. Competitor Market Share – Revenue
    2. 5.2. Market Concentration Rate Analysis, Top 3 and Top 5 Players
    3. 5.3. Strategic Development
      1. 5.3.1. Acquisitions and Mergers
      2. 5.3.2. New Products
      3. 5.3.3. Research & Development Activities
  6. CHAPTER 6. Company Profiles
    1. 6.1. Tsakos Energy Navigation
      1. 6.1.1. Company Overview
      2. 6.1.2. Tsakos Energy Navigation Revenue and Gross Margin
      3. 6.1.3. Product portfolio
      4. 6.1.4. Recent initiatives
    2. 6.2. Teekay Corp
      1. 6.2.1. Company Overview
      2. 6.2.2. Teekay Corp Revenue and Gross Margin
      3. 6.2.3. Product portfolio
      4. 6.2.4. Recent initiatives
    3. 6.3. Frontline Ltd
      1. 6.3.1. Company Overview
      2. 6.3.2. Frontline Ltd Revenue and Gross Margin
      3. 6.3.3. Product portfolio
      4. 6.3.4. Recent initiatives
    4. 6.4. COSCO
      1. 6.4.1. Company Overview
      2. 6.4.2. COSCO Revenue and Gross Margin
      3. 6.4.3. Product portfolio
      4. 6.4.4. Recent initiatives
    5. 6.5. DHT Holdings Inc
      1. 6.5.1. Company Overview
      2. 6.5.2. DHT Holdings Inc Revenue and Gross Margin
      3. 6.5.3. Product portfolio
      4. 6.5.4. Recent initiatives
    6. 6.6. Ship Finance International Limited
      1. 6.6.1. Company Overview
      2. 6.6.2. Ship Finance International Limited Revenue and Gross Margin
      3. 6.6.3. Product portfolio
      4. 6.6.4. Recent initiatives
    7. 6.7. Nordic American Tanker
      1. 6.7.1. Company Overview
      2. 6.7.2. Nordic American Tanker Revenue and Gross Margin
      3. 6.7.3. Product portfolio
      4. 6.7.4. Recent initiatives
    8. 6.8. Mitsui O.S.K. Lines
      1. 6.8.1. Company Overview
      2. 6.8.2. Mitsui O.S.K. Lines Revenue and Gross Margin
      3. 6.8.3. Product portfolio
      4. 6.8.4. Recent initiatives
    9. 6.9. Eastern Pacific Shipping
      1. 6.9.1. Company Overview
      2. 6.9.2. Eastern Pacific Shipping Revenue and Gross Margin
      3. 6.9.3. Product portfolio
      4. 6.9.4. Recent initiatives
    10. 6.10. The Maersk Group
      1. 6.10.1. Company Overview
      2. 6.10.2. The Maersk Group Revenue and Gross Margin
      3. 6.10.3. Product portfolio
      4. 6.10.4. Recent initiatives
    11. 6.11. Orient Overseas Container Line Limited
      1. 6.11.1. Company Overview
      2. 6.11.2. Orient Overseas Container Line Limited Revenue and Gross Margin
      3. 6.11.3. Product portfolio
      4. 6.11.4. Recent initiatives
    12. 6.12. AET
      1. 6.12.1. Company Overview
      2. 6.12.2. AET Revenue and Gross Margin
      3. 6.12.3. Product portfolio
      4. 6.12.4. Recent initiatives
  7. CHAPTER 7. Tanker Shipment — Industry Analysis
    1. 7.1. Tanker Shipment Market – Key Trends
      1. 7.1.1. Market Drivers
      2. 7.1.2. Market Restraints
      3. 7.1.3. Market Opportunities
    2. 7.2. Value Chain Analysis
    3. 7.3. Technology Roadmap and Timeline
    4. 7.4. Tanker Shipment Market – Attractiveness Analysis
      1. 7.4.1. By Shipment Type
      2. 7.4.2. By Tanker Type
      3. 7.4.3. By Region
  8. CHAPTER 8. Marketing Strategy Analysis, Distributors
    1. 8.1. Marketing Channel
    2. 8.2. Direct Marketing
    3. 8.3. Indirect Marketing
    4. 8.4. Marketing Channel Development Trend
    5. 8.5. Economic/Political Environmental Change
  9. CHAPTER 9. Report Conclusion
  10. CHAPTER 10. Research Approach & Methodology
    1. 10.1. Report Description
    2. 10.2. Research Scope
    3. 10.3. Research Methodology
      1. 10.3.1. Secondary Research
      2. 10.3.2. Primary Research
      3. 10.3.3. Models
        1. 10.3.3.1. Company Share Analysis Model
        2. 10.3.3.2. Revenue Based Modeling
        3. 10.3.3.3. Research Limitations

        List of Figures

        FIG. 1 Global Tanker Shipment Market, 2016-2026 (USD Billion)
        FIG. 2 Global Tanker Shipment Market Share, by Shipment Type, 2019 & 2026 (USD Billion)
        FIG. 3 Global Oil Tankers Tanker Shipment Market, 2016-2026 (USD Billion)
        FIG. 4 Global Chemical Tankers,  Tanker Shipment Market, 2016-2026 (USD Billion)
        FIG. 5 Global LNG Tankers  Tanker Shipment Market, 2016-2026 (USD Billion)
        FIG. 6 Global Others Tanker Shipment Market, 2016-2026 (USD Billion)
        FIG. 7 Global Tanker Shipment Market Share, by Tanker Type, 2019 & 2026 (USD Billion)
        FIG. 8 Global Ultra Large Crude Carrier (ULCC) Tanker Shipment Market, 2016-2026 (USD Billion)
        FIG. 9 Global Very Large Crude Carrier (VLCC) Tanker Shipment Market, 2016-2026 (USD Billion)
        FIG. 10 Global Suezmax Tanker Shipment Market, 2016-2026 (USD Billion)
        FIG. 11 Global Large Range 2 (LR2) Tanker Shipment Market, 2016-2026 (USD Billion)
        FIG. 12 Global Large Range 1 (LR1) Tanker Shipment Market, 2016-2026 (USD Billion)
        FIG. 13 Global Medium Range 2 (MR2) Tanker Shipment Market, 2016-2026 (USD Billion)
        FIG. 14 Global Medium Range 1 (MR1) Tanker Shipment Market, 2016-2026 (USD Billion)
        FIG. 15 Global Intermediate Tanker Tanker Shipment Market, 2016-2026 (USD Billion)
        FIG. 16 Global Small Tanker Tanker Shipment Market, 2016-2026 (USD Billion)
        FIG. 17 Global Tanker Shipment Market Share, by Region, 2019 & 2026
        FIG. 18 North America Tanker Shipment Market, 2016-2026
        FIG. 19 U.S. Tanker Shipment Market, 2016-2026
        FIG. 20 Canada Tanker Shipment Market, 2016-2026
        FIG. 21 Europe Tanker Shipment Market, 2016-2026
        FIG. 22 Germany Tanker Shipment Market, 2016-2026
        FIG. 23 France Tanker Shipment Market, 2016-2026
        FIG. 24 U.K. Tanker Shipment Market, 2016-2026
        FIG. 25 Italy Tanker Shipment Market, 2016-2026
        FIG. 26 Spain Tanker Shipment Market, 2016-2026
        FIG. 27 Rest of Europe Tanker Shipment Market, 2016-2026
        FIG. 28 Asia Pacific Tanker Shipment Market, 2016-2026
        FIG. 29 China Tanker Shipment Market, 2016-2026
        FIG. 30 Japan Tanker Shipment Market, 2016-2026
        FIG. 31 India Tanker Shipment Market, 2016-2026
        FIG. 32 South  Korea Tanker Shipment Market, 2016-2026
        FIG. 33 South-East Asia Tanker Shipment Market, 2016-2026
        FIG. 34 Rest of Asia Pacific Tanker Shipment Market, 2016-2026
        FIG. 35 Latin America Tanker Shipment Market, 2016-2026
        FIG. 36 Brazil Tanker Shipment Market, 2016-2026
        FIG. 37 Mexico Tanker Shipment Market, 2016-2026
        FIG. 38 Rest of Latin America Tanker Shipment Market, 2016-2026
        FIG. 39 The Middle-East and Africa Tanker Shipment Market, 2016-2026
        FIG. 40 GCC Countries Tanker Shipment Market, 2016-2026
        FIG. 41 South Africa Tanker Shipment Market, 2016-2026
        FIG. 42 Rest of Middle-East Africa Tanker Shipment Market, 2016-2026
        FIG. 43 Competitor Market Share – Revenue
        FIG. 44 Tsakos Energy Navigation Revenue and Growth Rate
        FIG. 45 Tsakos Energy Navigation Market Share
        FIG. 46 Teekay Corp Revenue and Growth Rate
        FIG. 47 Teekay Corp Market Share
        FIG. 48 Frontline Ltd Revenue and Growth Rate
        FIG. 49 Frontline Ltd Market Share
        FIG. 50 COSCO Revenue and Growth Rate
        FIG. 51 COSCO Market Share
        FIG. 52 DHT Holdings Inc Revenue and Growth Rate
        FIG. 53 DHT Holdings Inc Market Share
        FIG. 54 Ship Finance International Limited Revenue and Growth Rate
        FIG. 55 Ship Finance International Limited Market Share
        FIG. 56 Nordic American Tanker Revenue and Growth Rate
        FIG. 57 Nordic American Tanker Market Share
        FIG. 58 Mitsui O.S.K. Lines Revenue and Growth Rate
        FIG. 59 Mitsui O.S.K. Lines Market Share
        FIG. 60 Eastern Pacific Shipping Revenue and Growth Rate
        FIG. 61 Eastern Pacific Shipping Market Share
        FIG. 62 The Maersk Group Revenue and Growth Rate
        FIG. 63 The Maersk Group Market Share
        FIG. 64 Orient Overseas Container Line Limited Revenue and Growth Rate
        FIG. 65 Orient Overseas Container Line Limited Market Share
        FIG. 66 AET Revenue and Growth Rate
        FIG. 67 AET Market Share
        FIG. 68 Market Dynamics
        FIG. 69 Global Tanker Shipment – Value Chain Analysis
        FIG. 70 Technology Roadmap and Timeline
        FIG. 71 Market Attractiveness Analysis – By Shipment Type
        FIG. 72 Market Attractiveness Analysis – By Tanker Type
        FIG. 73 Market Attractiveness Analysis – By Region
        FIG. 74 Market Channel
        FIG. 75 Marketing Channel Development Trend
        FIG. 76 Growth in World Gross Product, 2008-2019

        List of Tables

        TABLE 1 Global Tanker Shipment Market, 2019 & 2026 (USD Billion)
        TABLE 2 Global Tanker Shipment market, by Shipment Type, 2016-2026 (USD Billion)
        TABLE 3 Global Tanker Shipment market, by Tanker Type, 2016-2026 (USD Billion)
        TABLE 4 Global Tanker Shipment market, by Region, 2016-2026 (USD Billion)
        TABLE 5 North America Tanker Shipment Market, by Shipment Type, 2016-2026 (USD Billion)
        TABLE 6 North America Tanker Shipment Market, by Tanker Type, 2016-2026 (USD Billion)
        TABLE 7 Europe Tanker Shipment Market, by Shipment Type, 2016-2026 (USD Billion)
        TABLE 8 Europe Tanker Shipment Market, by Tanker Type, 2016-2026 (USD Billion)
        TABLE 9 Asia Pacific Tanker Shipment Market, by Shipment Type, 2016-2026 (USD Billion)
        TABLE 10 Asia Pacific Tanker Shipment Market, by Tanker Type, 2016-2026 (USD Billion)
        TABLE 11 Latin America Tanker Shipment Market, by Shipment Type, 2016-2026 (USD Billion)
        TABLE 12 Latin America Tanker Shipment Market, by Tanker Type, 2016-2026 (USD Billion)
        TABLE 13 The Middle-East and Africa Tanker Shipment Market, by Shipment Type, 2016-2026 (USD Billion)
        TABLE 14 The Middle-East and Africa Tanker Shipment Market, by Tanker Type, 2016-2026 (USD Billion)
        TABLE 15 Global Tanker Shipment Market - Company Revenue Analysis 2016-2019 (USD Billion)
        TABLE 16 Global Tanker Shipment Market - Company Revenue Share Analysis 2016-2019(%)
        TABLE 17 Acquisitions and Mergers
        TABLE 18 New Product/Service Launch
        TABLE 19 Research & Development Activities
        TABLE 20 Market Drivers
        TABLE 21 Market Restraints
        TABLE 22 Market Opportunities
        

Industry Major Market Players

  • Tsakos Energy Navigation
  • Teekay Corp
  • Frontline Ltd
  • COSCO
  • DHT Holdings Inc
  • Ship Finance International Limited
  • Nordic American Tanker
  • Mitsui O.S.K. Lines
  • Eastern Pacific Shipping
  • The Maersk Group
  • Orient Overseas Container Line Limited and AET.