Search Market Research Report

Discover Our Latest Reports
Discover Our Featured Reports
Discover Top Selling Reports

Table Saws Market Size, Share Global Analysis Report, 2020–2026

report img

Table Saws Market By Product Type (Bench, Contractor, Cabinet, Sliding, Others); By Application (Industrial, Household); and Sales Channel (Direct Channel, Sales Channel): Global Industry Outlook, Market Size, Business Intelligence, Consumer Preferences, Statistical Surveys, Comprehensive Analysis, Historical Developments, Current Trends, and Forecast 2020–2026

Industry Insights

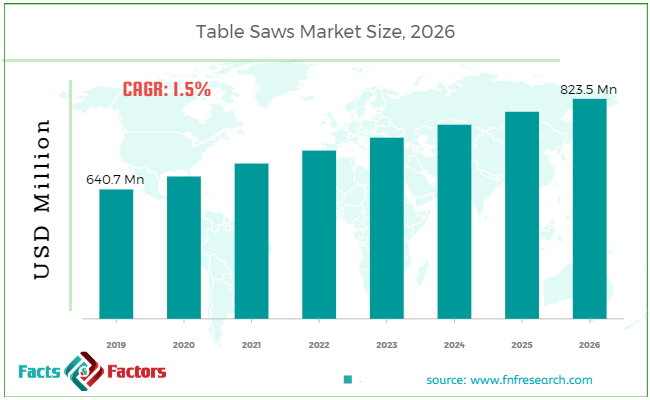
[185+ Pages Report] According to the report published by Facts Factors, the global table saws market size was worth around USD 640.7 million in 2019 and is predicted to grow to around USD 823.5 million by 2026 with a compound annual growth rate (CAGR) of roughly 1.5% between 2020 and 2026. The report analyzes the global table saws market drivers, restraints/challenges, and the effect they have on the demands during the projection period. In addition, the report explores emerging opportunities in the table saws market.

Table Saws Market Size

To know more about this report | Request Free Sample Copy

This specialized and expertise oriented industry research report scrutinizes the technical and commercial business outlook of the table saws industry. The report analyzes and declares the historical and current trends analysis of the table saw market and subsequently recommends the projected trends anticipated to be observed in the table saws market in the upcoming years.

The table saws market report analyzes and notifies the industry statistics at the global as well as regional and country levels in order to acquire a thorough perspective of the entire table saws market. The historical and past insights are provided for FY 2016 to FY 2019 whereas projected trends are delivered for FY 2020 to FY 2026. The quantitative and numerical data is represented in terms of both volumes (Units) and value (USD Million) from FY 2016 – 2026.


logoKey Insights from Primary Research        

  • As per our primary respondents, the global table saws market is set to grow annually at a rate of around 1.5 %
  • It was established through primary research that the global table saws market was valued at around USD 640.7 Million in 2019.
  • North America held the largest market share in 2019.
  • On basis of product type segment, sliding dominated the global table saws market in 2019 owing to rise in the use of decorative and different furniture these days.
  • Based on the application, the global table saws market was led by households in 2019.

logoKey Recommendations from Analysts

  • As per our analysts, the global table saws market is expected to grow significantly over the forecast period.
  • As per analysts, the growth in the construction industry coupled with the rising concept of “Do-It-Yourself” (DIY) is driving the growth of the market.
  • As per our analysts, the outbreak of the COVID-19 pandemic has led down the demand for table saws market.
  • Our team of analysts has identified, that North America is expected to be the fastest-growing market over the estimated period

The quantitative data is further underlined and reinforced by comprehensive qualitative data which comprises various across-the-board market dynamics. The rationales which directly or indirectly impact the table saws industry are exemplified through parameters such as growth drivers, restraints, challenges, and opportunities among other impacting factors.

Throughout our research report, we have encompassed all the proven models and tools of industry analysis and extensively illustrated all the key business strategies and business models adopted in the table saws industry. The report provides an all-inclusive and detailed competitive landscape prevalent in the table saws market.

The report utilizes established industry analysis tools and models such as Porter’s Five Forces framework to analyze and recognize critical business strategies adopted by various stakeholders involved in the entire value chain of the table saws industry. Table saws market report additionally employs SWOT analysis and PESTLE analysis models for further in-depth analysis.

The report study further includes an in-depth analysis of industry players' market shares and provides an overview of leading players' market position in the table saws sector. Key strategic developments in the table saws market competitive landscape such as acquisitions & mergers, inaugurations of different products and services, partnerships & joint ventures, MoU agreements, VC & funding activities, R&D activities, and geographic expansion among other noteworthy activities by key players of the table saws market are appropriately highlighted in the report.

Table Saws Market

To know more about this report | Request Free Sample Copy

A table saw is a woodworking device consisting of a circular saw blade, installed on an arbor, that is pushed by using an electric powered motor (either directly, with the aid of belt, or by gears). The blade protrudes thru the surface of a table, which gives a guide for the material, commonly wood, being cut.

In the forecast years, there is an increasing demand for table saws in the areas of North America and Europe that are anticipated to power the market for more superior table saws. Increasing of woodworking fields expenditures, more-intense competition, launches in introducing new products, growing of spending on the customary industry, retrofitting and renovation of ancient technology, growing adoption of table saws in creating international locations will pressure growth in the world market.

The table saws market research report delivers an acutevaluationand taxonomy of the table saws industry by practically splitting the market on the basis of different types, applications, and regions. Through the analysis of the historical and projected trends, all the segments and sub-segments were evaluated through the bottom-up approach, and different market sizes have been projected for FY 2020 to FY 2026.

logoReport Scope

Report Attribute

Details

Market Size in 2019

USD 640.7 Million

Projected Market Size in 2026

USD 823.5 Million

CAGR Growth Rate

1.5% CAGR

Base Year

2019

Forecast Years

2020-2026

Key Market Players

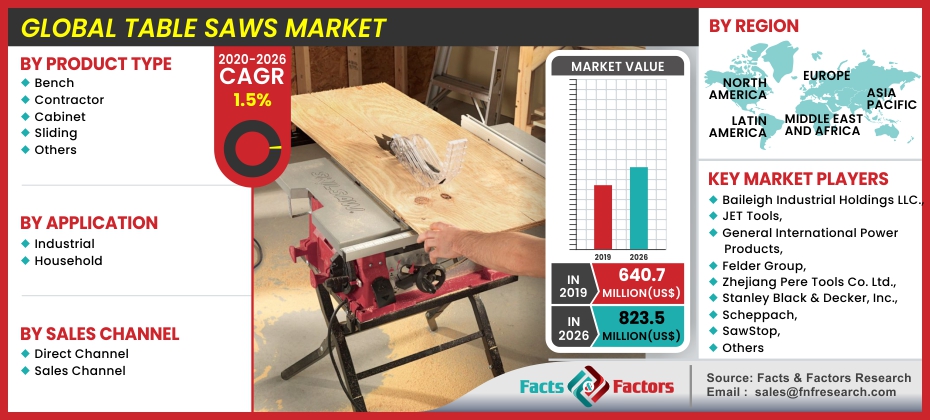
Baileigh Industrial Holdings LLC., JET Tools, General International Power Products, Felder Group, Zhejiang Pere Tools Co. Ltd., Stanley Black & Decker, Inc., Scheppach, SawStop, SCM Group, and Others

Key Segment

By Product, Application, Sales, and Region

Major Regions Covered

North America, Europe, Asia Pacific, Latin America, and the Middle East & Africa

Purchase Options

Request customized purchase options to meet your research needs.Explore purchase options

The regional segmentation of the table saws industry includes the complete classification of all the major continents including North America, Latin America, Europe, Asia Pacific, and Middle East & Africa. Further, country-wise data for the table saws industry is provided for the leading economies of the world.

The table saws market is segmented based on product type, application, sales channel.  On the basis of product type segmentation, the market is classified into Bench, Contractor, Cabinet, Sliding, Others. In terms of application segmentation, the market is bifurcated into the industrial, household. Based on sales channel segmentation, the market is categorized into the direct channels, distribution channels.

logoSome of the essential players operating in the table saws market, but not restricted to include

  • Baileigh Industrial Holdings LLC.
  • JET Tools
  • General International Power Products
  • Felder Group
  • Zhejiang Pere Tools Co.Ltd.
  • Stanley Black & Decker Inc.
  • Scheppach
  • SawStop
  • SCM Group

The taxonomy of the table saws market by its scope and segmentation is as follows:

logoBy Product Type Segmentation Analysis

  • Bench
  • Contractor
  • Cabinet
  • Sliding
  • Others

logoBy Application Segmentation Analysis

  • Industrial
  • Household

logoBy Sales Channel Segmentation Analysis

  • Direct Channel
  • Sales Channel

logoBy Regional Segmentation Analysis

  • North America
    • The U.S.
    • Canada
  • Europe
    • Germany
    • The UK
    • France
    • Spain
    • Italy
    • Rest of Europe
  • Asia Pacific
    • China
    • Japan
    • India
    • South Korea
    • Southeast Asia
    • Rest of Asia Pacific
  • Latin America
    • Brazil
    • Mexico
    • Rest of Latin America
  • Middle East & Africa
    • GCC
    • South Africa
    • Rest of Middle East & Africa

Table of Content

  1. CHAPTER 1. Executive Summary
  2. CHAPTER 2. Table Saws market – Product Type Analysis
    1. 2.1. Global Table Saws Market – Product Type Overview
    2. 2.2. Global Table Saws Market Share, by Product Type, 2019 & 2026 (USD Million)
    3. 2.3. Global Table Saws Market share, by Product Type, 2019 & 2026 (M Units)
    4. 2.4. Bench
      1. 2.4.1. Global BenchTable Saws Market, 2016-2026 (USD Million)
      2. 2.4.2. Global BenchTable Saws Market, 2016-2026 (M Units)
    5. 2.5. Contractor
      1. 2.5.1. Global ContractorTable Saws Market, 2016-2026 (USD Million)
      2. 2.5.2. Global ContractorTable Saws Market, 2016-2026 (M Units)
    6. 2.6. Cabinet
      1. 2.6.1. Global CabinetTable Saws Market, 2016-2026 (USD Million)
      2. 2.6.2. Global CabinetTable Saws Market, 2016-2026 (M Units)
    7. 2.7. Sliding
      1. 2.7.1. Global SlidingTable Saws Market, 2016-2026 (USD Million)
      2. 2.7.2. Global SlidingTable Saws Market, 2016-2026 (M Units)
    8. 2.8. Others
      1. 2.8.1. Global Others Table Saws Market, 2016-2026 (USD Million)
      2. 2.8.2. Global Others Table Saws Market, 2016-2026 (M Units)
  3. CHAPTER 3. Table Saws market – Application Analysis
    1. 3.1. Global Table Saws Market – Application Overview
    2. 3.2. Global Table Saws Market Share, by Application, 2019 & 2026 (USD Million)
    3. 3.3. Global Table Saws Market share, by Application, 2019 & 2026 (M Units)
    4. 3.4. Industrial
      1. 3.4.1. Global IndustrialTable Saws Market, 2016-2026 (USD Million)
      2. 3.4.2. Global IndustrialTable Saws Market, 2016-2026 (M Units)
    5. 3.5. Household
      1. 3.5.1. Global HouseholdTable Saws Market, 2016-2026 (USD Million)
      2. 3.5.2. Global HouseholdTable Saws Market, 2016-2026 (M Units)
  4. CHAPTER 4. Table Saws market – Sales Channel Analysis
    1. 4.1. Global Table Saws Market – Sales Channel Overview
    2. 4.2. Global Table Saws Market Share, by Sales Channel, 2019 & 2026 (USD Million)
    3. 4.3. Global Table Saws Market share, by Sales Channel, 2019 & 2026 (M Units)
    4. 4.4. Direct Channel
      1. 4.4.1. Global Direct ChannelTable Saws Market, 2016-2026 (USD Million)
      2. 4.4.2. Global Direct ChannelTable Saws Market, 2016-2026 (M Units)
    5. 4.5. Distribution Channel
      1. 4.5.1. Global Distribution ChannelTable Saws Market, 2016-2026 (USD Million)
      2. 4.5.2. Global Distribution ChannelTable Saws Market, 2016-2026 (M Units)
  5. CHAPTER 5. Table Saws market – Regional Analysis
    1. 5.1. Global Table Saws Market Regional Overview
    2. 5.2. Global Table Saws Market Share, by Region, 2019 & 2026 (Value)
    3. 5.3. Global Table Saws Market Share, by Region, 2019 & 2026 (Volume)
    4. 5.4. North America
      1. 5.4.1. North America Table Saws Market size and forecast, 2016-2026
      2. 5.4.2. North America Table Saws Market, by Country, 2016 - 2026 (USD Million)
      3. 5.4.3. North America Market size and forecast, 2016-2026 (M Units)
      4. 5.4.4. North America Table Saws Market, by Country, 2016 - 2026 (M Units)
      5. 5.4.5. North America Table Saws Market, by Product Type, 2016-2026
        1. 5.4.5.1. North America Table Saws Market, by Product Type, 2016-2026 (USD Million)
        2. 5.4.5.2. North America Table Saws Market, by Product Type, 2016-2026 (M Units)
      6. 5.4.6. North America Table Saws Market, by Application, 2016-2026
        1. 5.4.6.1. North America Table Saws Market, by Application, 2016-2026 (USD Million)
        2. 5.4.6.2. North America Table Saws Market, by Application, 2016-2026 (M Units)
      7. 5.4.7. North America Table Saws Market, by Sales Channel, 2016-2026
        1. 5.4.7.1. North America Table Saws Market, by Sales Channel, 2016-2026 (USD Million)
        2. 5.4.7.2. North America Table Saws Market, by Sales Channel, 2016-2026 (M Units)
      8. 5.4.8. U.S.
        1. 5.4.8.1. U.S. Market size and forecast, 2016-2026 (USD Million)
        2. 5.4.8.2. U.S. Market size and forecast, 2016-2026 (M Units)
      9. 5.4.9. Canada
        1. 5.4.9.1. Canada Market size and forecast, 2016-2026 (USD Million)
        2. 5.4.9.2. Canada Market size and forecast, 2016-2026 (M Units)
      10. 5.4.10. Mexico
        1. 5.4.10.1. Mexico Market size and forecast, 2016-2026 (USD Million)
        2. 5.4.10.2. Mexico Market size and forecast, 2016-2026 (M Units)
    5. 5.5. Europe
      1. 5.5.1. Europe Table Saws Market size and forecast, 2016-2026
      2. 5.5.2. Europe Table Saws Market, by Country, 2016 - 2026 (USD Million)
      3. 5.5.3. Europe Market size and forecast, 2016-2026 (M Units)
      4. 5.5.4. Europe Table Saws Market, by Country, 2016 - 2026 (M Units)
      5. 5.5.5. Europe Table Saws Market, by Product Type, 2016-2026
        1. 5.5.5.1. Europe Table Saws Market, by Product Type, 2016-2026 (USD Million)
        2. 5.5.5.2. Europe Table Saws Market, by Product Type, 2016-2026 (M Units)
      6. 5.5.6. Europe Table Saws Market, by Application, 2016-2026
        1. 5.5.6.1. Europe Table Saws Market, by Application, 2016-2026 (USD Million)
        2. 5.5.6.2. Europe Table Saws Market, by Application, 2016-2026 (M Units)
      7. 5.5.7. Europe Table Saws Market, by Sales Channel, 2016-2026
        1. 5.5.7.1. Europe Table Saws Market, by Sales Channel, 2016-2026 (USD Million)
        2. 5.5.7.2. Europe Table Saws Market, by Sales Channel, 2016-2026 (M Units)
      8. 5.5.8. Germany
        1. 5.5.8.1. Germany Market size and forecast, 2016-2026 (USD Million)
        2. 5.5.8.2. Germany Market size and forecast, 2016-2026 (M Units)
      9. 5.5.9. France
        1. 5.5.9.1. France Market size and forecast, 2016-2026 (USD Million)
        2. 5.5.9.2. France Market size and forecast, 2016-2026 (M Units)
          1. 5.5.10. U.K.
        3. 5.5.10.1. U.K. Market size and forecast, 2016-2026 (USD Million)
        4. 5.5.10.2. U.K. Market size and forecast, 2016-2026 (M Units)
      10. 5.5.11. Italy
        1. 5.5.11.1. Italy Market size and forecast, 2016-2026 (USD Million)
        2. 5.5.11.2. Italy Market size and forecast, 2016-2026 (M Units)
      11. 5.5.12. Spain
        1. 5.5.12.1. Spain Market size and forecast, 2016-2026 (USD Million)
        2. 5.5.12.2. Spain Market size and forecast, 2016-2026 (M Units)
      12. 5.5.13. Nordic Countries
        1. 5.5.13.1. Nordic Countries Market size and forecast, 2016-2026 (USD Million)
        2. 5.5.13.2. Nordic Countries Market size and forecast, 2016-2026 (M Units)
      13. 5.5.14. Benelux Union
        1. 5.5.14.1. Benelux Union Market size and forecast, 2016-2026 (USD Million)
        2. 5.5.14.2. Benelux Union Market size and forecast, 2016-2026 (M Units)
      14. 5.5.15. Rest of Europe
        1. 5.5.15.1. Rest of Europe Market size and forecast, 2016-2026 (USD Million)
        2. 5.5.15.2. Rest of Europe Market size and forecast, 2016-2026 (M Units)
    6. 5.6. Asia Pacific
      1. 5.6.1. Asia Pacific Table Saws Market size and forecast, 2016-2026
      2. 5.6.2. Asia Pacific Table Saws Market, by Country, 2016 - 2026 (USD Million)
      3. 5.6.3. Asia Pacific Market size and forecast, 2016-2026 (M Units)
      4. 5.6.4. Asia Pacific Table Saws Market, by Country, 2016 - 2026 (M Units)
      5. 5.6.5. Asia Pacific Table Saws Market, by Product Type, 2016-2026
        1. 5.6.5.1. Asia Pacific Table Saws Market, by Product Type, 2016-2026 (USD Million)
        2. 5.6.5.2. Asia Pacific Table Saws Market, by Product Type, 2016-2026 (M Units)
      6. 5.6.6. Asia Pacific Table Saws Market, by Application, 2016-2026
        1. 5.6.6.1. Asia Pacific Table Saws Market, by Application, 2016-2026 (USD Million)
        2. 5.6.6.2. Asia Pacific Table Saws Market, by Application, 2016-2026 (M Units)
      7. 5.6.7. Asia Pacific Table Saws Market, by Sales Channel, 2016-2026
        1. 5.6.7.1. Asia Pacific Table Saws Market, by Sales Channel, 2016-2026 (USD Million)
        2. 5.6.7.2. Asia Pacific Table Saws Market, by Sales Channel, 2016-2026 (M Units)
      8. 5.6.8. China
        1. 5.6.8.1. China Market size and forecast, 2016-2026 (USD Million)
        2. 5.6.8.2. China Market size and forecast, 2016-2026 (M Units)
      9. 5.6.9. Japan
        1. 5.6.9.1. Japan Market size and forecast, 2016-2026 (USD Million)
        2. 5.6.9.2. Japan Market size and forecast, 2016-2026 (M Units)
      10. 5.6.10. India
        1. 5.6.10.1. India Market size and forecast, 2016-2026 (USD Million)
        2. 5.6.10.2. India Market size and forecast, 2016-2026 (M Units)
      11. 5.6.11. New Zealand
        1. 5.6.11.1. New Zealand Market size and forecast, 2016-2026 (USD Million)
        2. 5.6.11.2. New Zealand Market size and forecast, 2016-2026 (M Units)
      12. 5.6.12. Australia
        1. 5.6.12.1. Australia Market size and forecast, 2016-2026 (USD Million)
        2. 5.6.12.2. Australia Market size and forecast, 2016-2026 (M Units)
      13. 5.6.13. South Korea
        1. 5.6.13.1. South Korea Market size and forecast, 2016-2026 (USD Million)
        2. 5.6.13.2. South Korea Market size and forecast, 2016-2026 (M Units)
      14. 5.6.14. South-East Asia
        1. 5.6.14.1. South-East Asia Market size and forecast, 2016-2026 (USD Million)
        2. 5.6.14.2. South-East Asia Market size and forecast, 2016-2026 (M Units)
      15. 5.6.15. Rest of Asia Pacific
        1. 5.6.15.1. Rest of Asia Pacific Market size and forecast, 2016-2026 (USD Million)
        2. 5.6.15.2. Rest of Asia Pacific Market size and forecast, 2016-2026 (M Units)
    7. 5.7. Latin America
      1. 5.7.1. Latin America Table Saws Market size and forecast, 2016-2026
      2. 5.7.2. Latin America Table Saws Market, by Country, 2016 - 2026 (USD Million)
      3. 5.7.3. Latin America Market size and forecast, 2016-2026 (M Units)
      4. 5.7.4. Latin America Table Saws Market, by Country, 2016 - 2026 (M Units)
      5. 5.7.5. Latin America Table Saws Market, by Product Type, 2016-2026
        1. 5.7.5.1. Latin America Table Saws Market, by Product Type, 2016-2026 (USD Million)
        2. 5.7.5.2. Latin America Table Saws Market, by Product Type, 2016-2026 (M Units)
      6. 5.7.6. Latin America Table Saws Market, by Application, 2016-2026
        1. 5.7.6.1. Latin America Table Saws Market, by Application, 2016-2026 (USD Million)
        2. 5.7.6.2. Latin America Table Saws Market, by Application, 2016-2026 (M Units)
      7. 5.7.7. Latin America Table Saws Market, by Sales Channel, 2016-2026
        1. 5.7.7.1. Latin America Table Saws Market, by Sales Channel, 2016-2026 (USD Million)
        2. 5.7.7.2. Latin America Table Saws Market, by Sales Channel, 2016-2026 (M Units)
      8. 5.7.8. Brazil
        1. 5.7.8.1. Brazil Market size and forecast, 2016-2026 (USD Million)
        2. 5.7.8.2. Brazil Market size and forecast, 2016-2026 (M Units)
      9. 5.7.9. Argentina
        1. 5.7.9.1. Argentina Market size and forecast, 2016-2026 (USD Million)
        2. 5.7.9.2. Argentina Market size and forecast, 2016-2026 (M Units)
      10. 5.7.10. Rest of Latin America
        1. 5.7.10.1. Rest of Latin America Market size and forecast, 2016-2026 (USD Million)
        2. 5.7.10.2. Rest of Latin America Market size and forecast, 2016-2026 (M Units)
    8. 5.8. The Middle-East and Africa
      1. 5.8.1. The Middle-East and Africa Table Saws Market size and forecast, 2016-2026
      2. 5.8.2. The Middle-East and Africa Table Saws Market, by Country, 2016 - 2026 (USD Million)
      3. 5.8.3. The Middle-East and Africa Market size and forecast, 2016-2026 (M Units)
      4. 5.8.4. The Middle-East and Africa Table Saws Market, by Country, 2016- 2026 (M Units)
      5. 5.8.5. The Middle-East and Africa Table Saws Market, by Product Type, 2016-2026
        1. 5.8.5.1. The Middle-East and Africa Table Saws Market, by Product Type, 2016-2026 (USD Million)
        2. 5.8.5.2. The Middle-East and Africa Table Saws Market, by Product Type, 2016-2026 (M Units)
      6. 5.8.6. The Middle-East and Africa Table Saws Market, by Application, 2016-2026
        1. 5.8.6.1. The Middle-East and Africa Table Saws Market, by Application, 2016-2026 (USD Million)
        2. 5.8.6.2. The Middle-East and Africa Table Saws Market, by Application, 2016-2026 (M Units)
      7. 5.8.7. The Middle-East and Africa Table Saws Market, by Sales Channel, 2016-2026
        1. 5.8.7.1. The Middle-East and Africa Table Saws Market, by Sales Channel, 2016-2026 (USD Million)
        2. 5.8.7.2. The Middle-East and Africa Table Saws Market, by Sales Channel, 2016-2026 (M Units)
      8. 5.8.8. Saudi Arabia
        1. 5.8.8.1. Saudi Arabia Market size and forecast, 2016-2026 (USD Million)
        2. 5.8.8.2. Saudi Arabia Market size and forecast, 2016-2026 (M Units)
      9. 5.8.9. UAE
        1. 5.8.9.1. UAE Market size and forecast, 2016-2026 (USD Million)
        2. 5.8.9.2. UAE Market size and forecast, 2016-2026 (M Units)
      10. 5.8.10. Egypt
        1. 5.8.10.1. Egypt Market size and forecast, 2016-2026 (USD Million)
        2. 5.8.10.2. Egypt Market size and forecast, 2016-2026 (M Units)
      11. 5.8.11. Kuwait
        1. 5.8.11.1. Kuwait Market size and forecast, 2016-2026 (USD Million)
        2. 5.8.11.2. Kuwait Market size and forecast, 2016-2026 (M Units)
      12. 5.8.12. South Africa
        1. 5.8.12.1. South Africa Market size and forecast, 2016-2026 (USD Million)
        2. 5.8.12.2. South Africa Market size and forecast, 2016-2026 (M Units)
      13. 5.8.13. Rest of Middle-East Africa
        1. 5.8.13.1. Rest of Middle-East Africa Market size and forecast, 2016-2026 (USD Million)
        2. 5.8.13.2. Rest of Middle-East Africa Market size and forecast, 2016-2026 (M Units)
  6. CHAPTER 6. Table Saws Production, Consumption, Export, Import by Regions
    1. 6.1. Global Table Saws production and revenue, 2016-2026 (USD Million) (M Units)
    2. 6.2. Global Import and Export Analysis, by Region
  7. CHAPTER 7. Table Saws market – Competitive Landscape
    1. 7.1. Competitor Market Share – Revenue
    2. 7.2. Market Concentration Rate Analysis, Top 3 and Top 5 Players
    3. 7.3. Competitor Market Share – Volume
    4. 7.4. Strategic Development
      1. 7.4.1. Acquisitions and Mergers
      2. 7.4.2. New Products
      3. 7.4.3. Research & Development Activities
  8. CHAPTER 8. Company Profiles
    1. 8.1. Baileigh Industrial Holdings LLC.
      1. 8.1.1. Company Overview
      2. 8.1.2. Baileigh Industrial Holdings LLC. Sales, Revenue, Price, and Gross Margin
      3. 8.1.3. Product portfolio
      4. 8.1.4. Recent initiatives
    2. 8.2. JET Tools
      1. 8.2.1. Company Overview
      2. 8.2.2. JET Tools Sales, Revenue, Price, and Gross Margin
      3. 8.2.3. Product portfolio
      4. 8.2.4. Recent initiatives
    3. 8.3. General International Power Products
      1. 8.3.1. Company Overview
      2. 8.3.2. General International Power Products Sales, Revenue, Price, and Gross Margin
      3. 8.3.3. Product portfolio
      4. 8.3.4. Recent initiatives
    4. 8.4. Felder Group
      1. 8.4.1. Company Overview
      2. 8.4.2. Felder Group Sales, Revenue, Price, and Gross Margin
      3. 8.4.3. Product portfolio
      4. 8.4.4. Recent initiatives
    5. 8.5. Zhejiang Pere Tools Co. Ltd.
      1. 8.5.1. Company Overview
      2. 8.5.2. Zhejiang Pere Tools Co. Ltd. Sales, Revenue, Price, and Gross Margin
      3. 8.5.3. Product portfolio
      4. 8.5.4. Recent initiatives
    6. 8.6. Stanley Black & Decker, Inc
      1. 8.6.1. Company Overview
      2. 8.6.2. Stanley Black & Decker, Inc Sales, Revenue, Price, and Gross Margin
      3. 8.6.3. Product portfolio
      4. 8.6.4. Recent initiatives
    7. 8.7. Scheppach
      1. 8.7.1. Company Overview
      2. 8.7.2. Scheppach Sales, Revenue, Price, and Gross Margin
      3. 8.7.3. Product portfolio
      4. 8.7.4. Recent initiatives
    8. 8.8. SawStop
      1. 8.8.1. Company Overview
      2. 8.8.2. SawStop Sales, Revenue, Price, and Gross Margin
      3. 8.8.3. Product portfolio
      4. 8.8.4. Recent initiatives
    9. 8.9. SCM Group
      1. 8.9.1. Company Overview
      2. 8.9.2. SCM Group Sales, Revenue, Price, and Gross Margin
      3. 8.9.3. Product portfolio
      4. 8.9.4. Recent initiatives
  9. CHAPTER 9. Table Saws — Industry Analysis
    1. 9.1. Introduction and Taxonomy
    2. 9.2. Table Saws Market – Key Trends
      1. 9.2.1. Market Drivers
      2. 9.2.2. Market Restraints
      3. 9.2.3. Market Opportunities
    3. 9.3. Value Chain Analysis
    4. 9.4. Key Mandates and Regulations
    5. 9.5. Technology Roadmap and Timeline
    6. 9.6. Table Saws market – Attractiveness Analysis
      1. 9.6.1. By Product Type
      2. 9.6.2. By Application
      3. 9.6.3. By Sales Channel
      4. 9.6.4. By Region
  10. CHAPTER 10. Raw Material analysis
    1. 10.1. Table Saws Key Raw Material Analysis
      1. 10.1.1. Key Raw Materials
      2. 10.1.2. Price Trend of Key Raw Materials
    2. 10.2. Key Suppliers of Raw Materials
    3. 10.3. Proportion of Manufacturing Cost Structure
      1. 10.3.1. Raw Materials
      2. 10.3.2. Labor Cost
    4. 10.4. Manufacturing Expenses Analysis of Table Saws
  11. CHAPTER 11. Industrial Chain, Sourcing Strategy and Downstream Buyers
    1. 11.1. Table Saws Industrial Chain Analysis
    2. 11.2. Upstream Raw Materials Sourcing
      1. 11.2.1. Risk Mitigation:
      2. 11.2.2. Supplier Relationships:
      3. 11.2.3. Business Processes:
      4. 11.2.4. Securing the Product:
    3. 11.3. Raw Materials Sources of Table Saws Major Manufacturers in 2016
    4. 11.4. Downstream Buyers
    5. 11.5. Distributors/Traders List
  12. CHAPTER 12. Marketing Strategy Analysis, Distributors
    1. 12.1. Marketing Channel
    2. 12.2. Direct Marketing
    3. 12.3. Indirect Marketing
    4. 12.4. Marketing Channel Development Trend
    5. 12.5. Economic/Political Environmental Change
  13. CHAPTER 13. Report Conclusion
  14. CHAPTER 14. Research Approach & Methodology
    1. 14.1. Report Description
    2. 14.2. Research Scope
    3. 14.3. Research Methodology
      1. 14.3.1. Secondary Research
      2. 14.3.2. Primary Research
      3. 14.3.3. Models
        1. 14.3.3.1. Company Share Analysis Model
        2. 14.3.3.2. Revenue Based Modeling
        3. 14.3.3.3. Research Limitations

        List of Figures

        FIG. 1 Global Table Saws Market, 2016-2026 (USD Million)
        FIG. 2 Global Table Saws Market Share, by Product Type, 2019 & 2026 (USD Million)
        FIG. 3 Global Table Saws Market share, by Product Type, 2019 & 2026 (M Units)
        FIG. 4 Global BenchTable Saws Market, 2016-2026 (USD Million)
        FIG. 5 Global BenchTable Saws Market, 2016-2026 (M Units)
        FIG. 6 Global ContractorTable Saws Market, 2016-2026 (USD Million)
        FIG. 7 Global ContractorTable Saws Market, 2016-2026 (M Units)
        FIG. 8 Global CabinetTable Saws Market, 2016-2026 (USD Million)
        FIG. 9 Global CabinetTable Saws Market, 2016-2026 (M Units)
        FIG. 10 Global SlidingTable Saws Market, 2016-2026 (USD Million)
        FIG. 11 Global SlidingTable Saws Market, 2016-2026 (M Units)
        FIG. 12 Global Others Table Saws Market, 2016-2026 (USD Million)
        FIG. 13 Global Others Table Saws Market, 2016-2026 (M Units)
        FIG. 14 Global Table Saws Market Share, by Application, 2019 & 2026 (USD Million)
        FIG. 15 Global Table Saws Market share, by Application, 2019 & 2026 (M Units)
        FIG. 16 Global IndustrialTable Saws Market, 2016-2026 (USD Million)
        FIG. 17 Global IndustrialTable Saws Market, 2016-2026 (M Units)
        FIG. 18 Global HouseholdTable Saws Market, 2016-2026 (USD Million)
        FIG. 19 Global HouseholdTable Saws Market, 2016-2026 (M Units)
        FIG. 28 Global Table Saws Market Share, by Sales Channel, 2019 & 2026 (USD Million)
        FIG. 29 Global Table Saws Market share, by Sales Channel, 2019 & 2026 (M Units)
        FIG. 30 Global Direct ChannelTable Saws Market, 2016-2026 (USD Million)
        FIG. 31 Global Direct ChannelTable Saws Market, 2016-2026 (M Units)
        FIG. 32 Global Distribution ChannelTable Saws Market, 2016-2026 (USD Million)
        FIG. 33 Global Distribution ChannelTable Saws Market, 2016-2026 (M Units)
        FIG. 34 Global Table Saws Market Share, by Region, 2019 & 2026
        FIG. 35 Global Table Saws Market Share, by Region, 2019 & 2026
        FIG. 36 North America Table Saws Market, 2016-2026
        FIG. 37 North America Table Saws Market, 2016-2026 (M Units)
        FIG. 38 U.S. Table Saws Market, 2016-2026
        FIG. 39 U.S. Table Saws Market, 2016-2026 (M Units)
        FIG. 40 Canada Table Saws Market, 2016-2026
        FIG. 41 Canada Table Saws Market, 2016-2026 (M Units)
        FIG. 42 Mexico Table Saws Market, 2016-2026
        FIG. 43 Mexico Table Saws Market, 2016-2026 (M Units)
        FIG. 44 Europe Table Saws Market, 2016-2026
        FIG. 45 Europe Table Saws Market, 2016-2026 (M Units)
        FIG. 46 Germany Table Saws Market, 2016-2026
        FIG. 47 Germany Table Saws Market, 2016-2026 (M Units)
        FIG. 48 France Table Saws Market, 2016-2026
        FIG. 49 France Table Saws Market, 2016-2026 (M Units)
        FIG. 50 U.K. Table Saws Market, 2016-2026
        FIG. 51 U.K. Table Saws Market, 2016-2026 (M Units)
        FIG. 52 Italy Table Saws Market, 2016-2026
        FIG. 53 Italy Table Saws Market, 2016-2026 (M Units)
        FIG. 54 Spain Table Saws Market, 2016-2026
        FIG. 55 Spain Table Saws Market, 2016-2026 (M Units)
        FIG. 56 Nordic Countries Table Saws Market, 2016-2026
        FIG. 57 Nordic Countries Table Saws Market, 2016-2026 (M Units)
        FIG. 58 Benelux Union Table Saws Market, 2016-2026
        FIG. 59 Benelux Union Table Saws Market, 2016-2026 (M Units)
        FIG. 60 Rest of Europe Table Saws Market, 2016-2026
        FIG. 61 Rest of Europe Table Saws Market, 2016-2026 (M Units)
        FIG. 62 Asia Pacific Table Saws Market, 2016-2026
        FIG. 63 Asia Pacific Table Saws Market, 2016-2026 (M Units)
        FIG. 64 China Table Saws Market, 2016-2026
        FIG. 65 China Table Saws Market, 2016-2026 (M Units)
        FIG. 66 Japan Table Saws Market, 2016-2026
        FIG. 67 Japan Table Saws Market, 2016-2026 (M Units)
        FIG. 68 India Table Saws Market, 2016-2026
        FIG. 69 India Table Saws Market, 2016-2026 (M Units)
        FIG. 70 New Zealand Table Saws Market, 2016-2026
        FIG. 71 New Zealand Table Saws Market, 2016-2026 (M Units)
        FIG. 72 Australia Table Saws Market, 2016-2026
        FIG. 73 Australia Table Saws Market, 2016-2026 (M Units)
        FIG. 74 South KoreaTable Saws Market, 2016-2026
        FIG. 75 South KoreaTable Saws Market, 2016-2026 (M Units)
        FIG. 76 South-East Asia Table Saws Market, 2016-2026
        FIG. 77 South-East Asia Table Saws Market, 2016-2026 (M Units)
        FIG. 78 Rest of Asia Pacific Table Saws Market, 2016-2026
        FIG. 79 Rest of Asia Pacific Table Saws Market, 2016-2026 (M Units)
        FIG. 80 Latin America Table Saws Market, 2016-2026
        FIG. 81 Latin America Table Saws Market, 2016-2026 (M Units)
        FIG. 82 Brazil Table Saws Market, 2016-2026
        FIG. 83 Brazil Table Saws Market, 2016-2026 (M Units)
        FIG. 84 Argentina Table Saws Market, 2016-2026
        FIG. 85 Argentina Table Saws Market, 2016-2026 (M Units)
        FIG. 86 Rest of Latin America Table Saws Market, 2016-2026
        FIG. 87 Rest of Latin America Table Saws Market, 2016-2026 (M Units)
        FIG. 88 The Middle-East and Africa Table Saws Market, 2016-2026
        FIG. 89 The Middle-East and Africa Table Saws Market, 2016-2026 (M Units)
        FIG. 90 Saudi Arabia Table Saws Market, 2016-2026
        FIG. 91 Saudi Arabia Table Saws Market, 2016-2026 (M Units)
        FIG. 92 UAE Table Saws Market, 2016-2026
        FIG. 93 UAE Table Saws Market, 2016-2026 (M Units)
        FIG. 94 Egypt Table Saws Market, 2016-2026
        FIG. 95 Egypt Table Saws Market, 2016-2026 (M Units)
        FIG. 96 Kuwait Table Saws Market, 2016-2026
        FIG. 97 Kuwait Table Saws Market, 2016-2026 (M Units)
        FIG. 98 South Africa Table Saws Market, 2016-2026
        FIG. 99 South Africa Table Saws Market, 2016-2026 (M Units)
        FIG. 100 Rest of Middle-East Africa Table Saws Market, 2016-2026
        FIG. 101 Rest of Middle-East Africa Table Saws Market, 2016-2026 (M Units)
        FIG. 102 Global Table Saws production and revenue, 2016-2026 (USD Million) (M Units)
        FIG. 103 North America Table Saws production and revenue, 2016-2026 (USD Million) (M Units)
        FIG. 104 Europe Table Saws production and revenue, 2016-2026 (USD Million) (M Units)
        FIG. 105 Asia Pacific Table Saws production and revenue, 2016-2026 (USD Million) (M Units)
        FIG. 106 Latin America Table Saws production and revenue, 2016-2026 (USD Million) (M Units)
        FIG. 107 Middle East and Africa Table Saws production and revenue, 2016-2026 (USD Million) (M Units)
        FIG. 108 Competitor Market Share – Revenue
        FIG. 109 Competitor Market Share – Volume
        FIG. 110 Baileigh Industrial Holdings LLC. Revenue and Growth Rate
        FIG. 111 Baileigh Industrial Holdings LLC. Market Share
        FIG. 112 JET Tools Revenue and Growth Rate
        FIG. 113 JET Tools Market Share
        FIG. 114 General International Power Products Revenue and Growth Rate
        FIG. 115 General International Power Products Market Share
        FIG. 116 Felder Group Revenue and Growth Rate
        FIG. 117 Felder Group Market Share
        FIG. 118 Zhejiang Pere Tools Co. Ltd Revenue and Growth Rate
        FIG. 119 Zhejiang Pere Tools Co. Ltd Market Share
        FIG. 120 Stanley Black & Decker, Inc. Revenue and Growth Rate
        FIG. 121 Stanley Black & Decker, Inc. Market Share
        FIG. 122 Scheppach Revenue and Growth Rate
        FIG. 123 Scheppach Market Share
        FIG. 124 SawStop Revenue and Growth Rate
        FIG. 125 SawStop Market Share
        FIG. 126 SCM Group Revenue and Growth Rate
        FIG. 127 SCM Group Market Share
        FIG. 130 Market Dynamics
        FIG. 131 Global Table Saws – Value Chain Analysis
        FIG. 132 Key Mandates and Regulations
        FIG. 133 Technology Roadmap and Timeline
        FIG. 134 Market Attractiveness Analysis – By Product Type
        FIG. 135 Market Attractiveness Analysis – By Application
        FIG. 136 Market Attractiveness Analysis – By Sales Channel
        FIG. 137 Market Attractiveness Analysis – By Region
        FIG. 138 Manufacturing Cost Structure of Table Saws
        FIG. 139 Table Saws Industrial Chain Analysis
        FIG. 140 Market Channel
        FIG. 141 Marketing Channel Development Trend
        FIG. 142 Growth in World Gross Product, 2008-2018
        

        List of Tables

        TABLE 1 Global Table Saws market, 2019 & 2026 (USD Million)
        TABLE 2 Global Table Saws market, by Product Type, 2016-2026 (USD Million)
        TABLE 3 Global Table Saws market, by Product Type, 2016-2026 (M Units)
        TABLE 4 Global Table Saws market, by Application, 2016-2026 (USD Million)
        TABLE 5 Global Table Saws market, by Application, 2016-2026 (M Units)
        TABLE 6 Global Table Saws market, by Sales Channel, 2016-2026 (USD Million)
        TABLE 7 Global Table Saws market, by Sales Channel, 2016-2026 (M Units)
        TABLE 8 Global Table Saws market, by region, 2016-2026 (USD Million)
        TABLE 9 Global Table Saws market, by region, 2016-2026 (M Units)
        TABLE 10 North America Table Saws Market, by Product Type, 2016-2026 (USD Million)
        TABLE 11 North America Table Saws Market, by Product Type, 2016-2026 (M Units)
        TABLE 12 North America Table Saws Market, by Application, 2016-2026 (USD Million)
        TABLE 13 North America Table Saws Market, by Application, 2016-2026 (M Units)
        TABLE 14 North America Table Saws Market, by Sales Channel, 2016-2026 (USD Million)
        TABLE 15 North America Table Saws Market, by Sales Channel, 2016-2026 (M Units)
        TABLE 16 Europe Table Saws Market, by Product Type, 2016-2026 (USD Million)
        TABLE 17 Europe Table Saws Market, by Product Type, 2016-2026 (M Units)
        TABLE 18 Europe Table Saws Market, by Application, 2016-2026 (USD Million)
        TABLE 19 Europe Table Saws Market, by Application, 2016-2026 (M Units)
        TABLE 20 Europe Table Saws Market, by Sales Channel, 2016-2026 (USD Million)
        TABLE 21 Europe Table Saws Market, by Sales Channel, 2016-2026 (M Units)
        TABLE 22 Asia Pacific Table Saws Market, by Product Type, 2016-2026 (USD Million)
        TABLE 23 Asia Pacific Table Saws Market, by Product Type, 2016-2026 (M Units)
        TABLE 24 Asia Pacific Table Saws Market, by Application, 2016-2026 (USD Million)
        TABLE 25 Asia Pacific Table Saws Market, by Application, 2016-2026 (M Units)
        TABLE 26 Asia Pacific Table Saws Market, by Sales Channel, 2016-2026 (USD Million)
        TABLE 27 Asia Pacific Table Saws Market, by Sales Channel, 2016-2026 (M Units)
        TABLE 28 Latin America Table Saws Market, by Product Type, 2016-2026 (USD Million)
        TABLE 29 Latin America Table Saws Market, by Product Type, 2016-2026 (M Units)
        TABLE 30 Latin America Table Saws Market, by Application, 2016-2026 (USD Million)
        TABLE 31 Latin America Table Saws Market, by Application, 2016-2026 (M Units)
        TABLE 32 Latin America Table Saws Market, by Sales Channel, 2016-2026 (USD Million)
        TABLE 33 Latin America Table Saws Market, by Sales Channel, 2016-2026 (M Units)
        TABLE 34 The Middle-East and Africa Table Saws Market, by Product Type, 2016-2026 (USD Million)
        TABLE 35 The Middle-East and Africa Table Saws Market, by Product Type, 2016-2026 (M Units)
        TABLE 36 The Middle-East and Africa Table Saws Market, by Application, 2016-2026 (USD Million)
        TABLE 37 The Middle-East and Africa Table Saws Market, by Application, 2016-2026 (M Units)
        TABLE 38 The Middle-East and Africa Table Saws Market, by Sales Channel, 2016-2026 (USD Million)
        TABLE 39 The Middle-East and Africa Table Saws Market, by Sales Channel, 2016-2026 (M Units)
        TABLE 40 North America Table Saws Production, Consumption, Export, Import, 2016-2026
        TABLE 41 Europe Table Saws Production, Consumption, Export, Import, 2016-2026
        TABLE 42 Asia Pacific Table Saws Production, Consumption, Export, Import, 2016-2026
        TABLE 43 Latin America Table Saws Production, Consumption, Export, Import, 2016-2026
        TABLE 44 Middle East & Africa Table Saws Production, Consumption, Export, Import, 2016-2026
        TABLE 45 Global Table Saws Market - Company Revenue Analysis 2016-2026 (USD Million)
        TABLE 46 Global Table Saws Market - Company Revenue Share Analysis 2016-2026(%)
        TABLE 47 Global Table Saws Market - Company Volume Analysis 2016-2026 (M Units)
        TABLE 48 Global Table Saws Market - Company Volume Share Analysis 2016-2026(%)
        TABLE 49 Acquisitions and Mergers
        TABLE 50 New Product/Service Launch
        TABLE 51 Research & Development Activities
        TABLE 52 Market Drivers
        TABLE 53 Market Restraints
        TABLE 54 Market Opportunities
        TABLE 55 Production Base and Market Concentration Rate of Raw Material
        TABLE 56 Key Suppliers of Raw Materials
        TABLE 57 Raw Materials Sources of Table Saws Major Manufacturers in 2016
        TABLE 58 Major Buyers of Table Saws
        TABLE 59 Distributors/Traders of Table Saws by Region
        

Industry Major Market Players

  • Baileigh Industrial Holdings LLC.
  • JET Tools
  • General International Power Products
  • Felder Group
  • Zhejiang Pere Tools Co.Ltd.
  • Stanley Black & Decker Inc.
  • Scheppach
  • SawStop
  • SCM Group