Table of Content
- Chapter 1 Executive Summary
- 1.1. Introduction of Synthetic Fiber
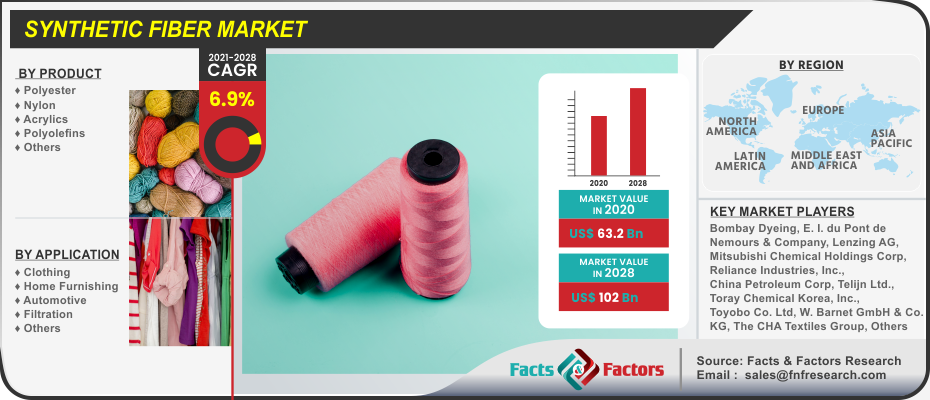
- 1.2. Global Synthetic Fiber Market, 2019 & 2028 (USD Billion)
- 1.3. Global Synthetic Fiber Market, 2016 – 2028 (USD Billion)
- 1.4. Global Synthetic Fiber Market Absolute Revenue Opportunity, 2016 – 2028 (USD Billion)
- 1.5. Global Synthetic Fiber Market Incremental Revenue Opportunity, 2020 – 2028 (USD Billion)
- Chapter 2 Synthetic Fiber Market – Product Analysis
- 2.1. Global Synthetic Fiber Market – Product Overview
- 2.2. Global Synthetic Fiber Market Share, by Product, 2019 & 2028 (USD Billion)
- 2.3. Polyester
- 2.3.1. Global Polyester Synthetic Fiber Market, 2016 – 2028 (USD Billion)
- 2.4. Nylon
- 2.4.1. Global Nylon Synthetic Fiber Market, 2016 – 2028 (USD Billion)
- 2.5. Acrylics
- 2.5.1. Global Acrylics Synthetic Fiber Market, 2016 – 2028 (USD Billion)
- 2.6. Polyolefins
- 2.6.1. Global Polyolefins Synthetic Fiber Market, 2016 – 2028 (USD Billion)
- 2.7. Others
- 2.7.1. Global Others Synthetic Fiber Market, 2016 – 2028 (USD Billion)
- Chapter 3 Synthetic Fiber Market – Application Analysis
- 3.1. Global Synthetic Fiber Market – Application Overview
- 3.2. Global Synthetic Fiber Market Share, by Application, 2019 & 2028 (USD Billion)
- 3.3. Clothing
- 3.3.1. Global Clothing Synthetic Fiber Market, 2016 – 2028 (USD Billion)
- 3.4. Home Furnishing
- 3.4.1. Global Home Furnishing Synthetic Fiber Market, 2016 – 2028 (USD Billion)
- 3.5. Automotive
- 3.5.1. Global Automotive Synthetic Fiber Market, 2016 – 2028 (USD Billion)
- 3.6. Filtration
- 3.6.1. Global Filtration Synthetic Fiber Market, 2016 – 2028 (USD Billion)
- 3.7. Others
- 3.7.1. Global Others Synthetic Fiber Market, 2016 – 2028 (USD Billion)
- Chapter 4 Synthetic Fiber Market – Regional Analysis
- 4.1. Global Synthetic Fiber Market Regional Overview
- 4.2. Global Synthetic Fiber Market Share, by Region, 2019 & 2028 (USD Billion)
- 4.3. North America
- 4.3.1. North America Synthetic Fiber Market, 2016 – 2028 (USD Billion)
- 4.3.1.1. North America Synthetic Fiber Market, by Country, 2016 - 2028 (USD Billion)
- 4.3.2. North America Synthetic Fiber Market, by Product, 2016 – 2028
- 4.3.2.1. North America Synthetic Fiber Market, by Product, 2016 – 2028 (USD Billion)
- 4.3.3. North America Synthetic Fiber Market, by Application, 2016 – 2028
- 4.3.3.1. North America Synthetic Fiber Market, by Application, 2016 – 2028 (USD Billion)
- 4.3.4. U.S.
- 4.3.4.1. U.S. Synthetic Fiber Market, 2016 – 2028 (USD Billion)
- 4.3.5. Canada
- 4.3.5.1. Canada Synthetic Fiber Market, 2016 – 2028 (USD Billion)
- 4.4. Europe
- 4.4.1. Europe Synthetic Fiber Market, 2016 – 2028 (USD Billion)
- 4.4.1.1. Europe Synthetic Fiber Market, by Country, 2016 - 2028 (USD Billion)
- 4.4.2. Europe Synthetic Fiber Market, by Product, 2016 – 2028
- 4.4.2.1. Europe Synthetic Fiber Market, by Product, 2016 – 2028 (USD Billion)
- 4.4.3. Europe Synthetic Fiber Market, by Application, 2016 – 2028
- 4.4.3.1. Europe Synthetic Fiber Market, by Application, 2016 – 2028 (USD Billion)
- 4.4.4. Germany
- 4.4.4.1. Germany Synthetic Fiber Market, 2016 – 2028 (USD Billion)
- 4.4.5. France
- 4.4.5.1. France Synthetic Fiber Market, 2016 – 2028 (USD Billion)
- 4.4.6. U.K.
- 4.4.6.1. U.K. Synthetic Fiber Market, 2016 – 2028 (USD Billion)
- 4.4.7. Italy
- 4.4.7.1. Italy Synthetic Fiber Market, 2016 – 2028 (USD Billion)
- 4.4.8. Spain
- 4.4.8.1. Spain Synthetic Fiber Market, 2016 – 2028 (USD Billion)
- 4.4.9. Rest of Europe
- 4.4.9.1. Rest of Europe Synthetic Fiber Market, 2016 – 2028 (USD Billion)
- 4.5. Asia Pacific
- 4.5.1. Asia Pacific Synthetic Fiber Market, 2016 – 2028 (USD Billion)
- 4.5.1.1. Asia Pacific Synthetic Fiber Market, by Country, 2016 - 2028 (USD Billion)
- 4.5.2. Asia Pacific Synthetic Fiber Market, by Product, 2016 – 2028
- 4.5.2.1. Asia Pacific Synthetic Fiber Market, by Product, 2016 – 2028 (USD Billion)
- 4.5.3. Asia Pacific Synthetic Fiber Market, by Application, 2016 – 2028
- 4.5.3.1. Asia Pacific Synthetic Fiber Market, by Application, 2016 – 2028 (USD Billion)
- 4.5.4. China
- 4.5.4.1. China Synthetic Fiber Market, 2016 – 2028 (USD Billion)
- 4.5.5. Japan
- 4.5.5.1. Japan Synthetic Fiber Market, 2016 – 2028 (USD Billion)
- 4.5.6. India
- 4.5.6.1. India Synthetic Fiber Market, 2016 – 2028 (USD Billion)
- 4.5.7. South Korea
- 4.5.7.1. South Korea Synthetic Fiber Market, 2016 – 2028 (USD Billion)
- 4.5.8. South-East Asia
- 4.5.8.1. South-East Asia Synthetic Fiber Market, 2016 – 2028 (USD Billion)
- 4.5.9. Rest of Asia Pacific
- 4.5.9.1. Rest of Asia Pacific Synthetic Fiber Market, 2016 – 2028 (USD Billion)
- 4.6. Latin America
- 4.6.1. Latin America Synthetic Fiber Market, 2016 – 2028 (USD Billion)
- 4.6.1.1. Latin America Synthetic Fiber Market, by Country, 2016 - 2028 (USD Billion)
- 4.6.2. Latin America Synthetic Fiber Market, by Product, 2016 – 2028
- 4.6.2.1. Latin America Synthetic Fiber Market, by Product, 2016 – 2028 (USD Billion)
- 4.6.3. Latin America Synthetic Fiber Market, by Application, 2016 – 2028
- 4.6.3.1. Latin America Synthetic Fiber Market, by Application, 2016 – 2028 (USD Billion)
- 4.6.4. Brazil
- 4.6.4.1. Brazil Synthetic Fiber Market, 2016 – 2028 (USD Billion)
- 4.6.5. Mexico
- 4.6.5.1. Mexico Synthetic Fiber Market, 2016 – 2028 (USD Billion)
- 4.6.6. Rest of Latin America
- 4.6.6.1. Rest of Latin America Synthetic Fiber Market, 2016 – 2028 (USD Billion)
- 4.7. The Middle-East and Africa
- 4.7.1. The Middle-East and Africa Synthetic Fiber Market, 2016 – 2028 (USD Billion)
- 4.7.1.1. The Middle-East and Africa Synthetic Fiber Market, by Country, 2016 - 2028 (USD Billion)
- 4.7.2. The Middle-East and Africa Synthetic Fiber Market, by Product, 2016 – 2028
- 4.7.2.1. The Middle-East and Africa Synthetic Fiber Market, by Product, 2016 – 2028 (USD Billion)
- 4.7.3. The Middle-East and Africa Synthetic Fiber Market, by Application, 2016 – 2028
- 4.7.3.1. The Middle-East and Africa Synthetic Fiber Market, by Application, 2016 – 2028 (USD Billion)
- 4.7.4. GCC Countries
- 4.7.4.1. GCC Countries Synthetic Fiber Market, 2016 – 2028 (USD Billion)
- 4.7.5. South Africa
- 4.7.5.1. South Africa Synthetic Fiber Market, 2016 – 2028 (USD Billion)
- 4.7.6. Rest of Middle-East Africa
- 4.7.6.1. Rest of Middle-East Africa Synthetic Fiber Market, 2016 – 2028 (USD Billion)
- Chapter 5 Synthetic Fiber Market – Competitive Landscape
- 5.1. Competitor Market Share – Revenue
- 5.2. Market Concentration Rate Analysis, Top 3 and Top 5 Players
- 5.3. Strategic Developments
- 5.3.1. Acquisitions and Mergers
- 5.3.2. New Products
- 5.3.3. Research & Development Activities
- Chapter 6 Company Profiles
- 6.1. Bombay Dyeing
- 6.1.1. Company Overview
- 6.1.2. Product/Service Portfolio
- 6.1.3. Bombay Dyeing Sales, Revenue, and Gross Margin
- 6.1.4. Bombay Dyeing Revenue and Growth Rate
- 6.1.5. Bombay Dyeing Market Share
- 6.1.6. Recent Initiatives, Funding/VC Activities, and Technological Innovations
- 6.2. E. I. du Pont de Nemours & Company
- 6.2.1. Company Overview
- 6.2.2. Product/Service Portfolio
- 6.2.3. E. I. du Pont de Nemours & Company Sales, Revenue, and Gross Margin
- 6.2.4. E. I. du Pont de Nemours & Company Revenue and Growth Rate
- 6.2.5. E. I. du Pont de Nemours & Company Market Share
- 6.2.6. Recent Initiatives, Funding/VC Activities, and Technological Innovations
- 6.3. Lenzing AG
- 6.3.1. Company Overview
- 6.3.2. Product/Service Portfolio
- 6.3.3. Lenzing AG Sales, Revenue, and Gross Margin
- 6.3.4. Lenzing AG Revenue and Growth Rate
- 6.3.5. Lenzing AG Market Share
- 6.3.6. Recent Initiatives, Funding/VC Activities, and Technological Innovations
- 6.4. Mitsubishi Chemical Holdings Corp
- 6.4.1. Company Overview
- 6.4.2. Product/Service Portfolio
- 6.4.3. Mitsubishi Chemical Holdings Corp Sales, Revenue, and Gross Margin
- 6.4.4. Mitsubishi Chemical Holdings Corp Revenue and Growth Rate
- 6.4.5. Mitsubishi Chemical Holdings Corp Market Share
- 6.4.6. Recent Initiatives, Funding/VC Activities, and Technological Innovations
- 6.5. Reliance Industries Inc
- 6.5.1. Company Overview
- 6.5.2. Product/Service Portfolio
- 6.5.3. Reliance Industries Inc Sales, Revenue, and Gross Margin
- 6.5.4. Reliance Industries Inc Revenue and Growth Rate
- 6.5.5. Reliance Industries Inc Market Share
- 6.5.6. Recent Initiatives, Funding/VC Activities, and Technological Innovations
- 6.6. China Petroleum Corp
- 6.6.1. Company Overview
- 6.6.2. Product/Service Portfolio
- 6.6.3. China Petroleum Corp Sales, Revenue, and Gross Margin
- 6.6.4. China Petroleum Corp Revenue and Growth Rate
- 6.6.5. China Petroleum Corp Market Share
- 6.6.6. Recent Initiatives, Funding/VC Activities, and Technological Innovations
- 6.7. Telijn Ltd
- 6.7.1. Company Overview
- 6.7.2. Product/Service Portfolio
- 6.7.3. Telijn Ltd Sales, Revenue, and Gross Margin
- 6.7.4. Telijn Ltd Revenue and Growth Rate
- 6.7.5. Telijn Ltd Market Share
- 6.7.6. Recent Initiatives, Funding/VC Activities, and Technological Innovations
- 6.8. Toray Chemical Korea Inc
- 6.8.1. Company Overview
- 6.8.2. Product/Service Portfolio
- 6.8.3. Toray Chemical Korea Inc Sales, Revenue, and Gross Margin
- 6.8.4. Toray Chemical Korea Inc Revenue and Growth Rate
- 6.8.5. Toray Chemical Korea Inc Market Share
- 6.8.6. Recent Initiatives, Funding/VC Activities, and Technological Innovations
- 6.9. Toyobo Co. Ltd
- 6.9.1. Company Overview
- 6.9.2. Product/Service Portfolio
- 6.9.3. Toyobo Co. Ltd Sales, Revenue, and Gross Margin
- 6.9.4. Toyobo Co. Ltd Revenue and Growth Rate
- 6.9.5. Toyobo Co. Ltd Market Share
- 6.9.6. Recent Initiatives, Funding/VC Activities, and Technological Innovations
- 6.10. W. Barnet GmbH & Co. KG
- 6.10.1. Company Overview
- 6.10.2. Product/Service Portfolio
- 6.10.3. W. Barnet GmbH & Co. KG Sales, Revenue, and Gross Margin
- 6.10.4. W. Barnet GmbH & Co. KG Revenue and Growth Rate
- 6.10.5. W. Barnet GmbH & Co. KG Market Share
- 6.10.6. Recent Initiatives, Funding/VC Activities, and Technological Innovations
- 6.11. The CHA Textiles Group
- 6.11.1. Company Overview
- 6.11.2. Product/Service Portfolio
- 6.11.3. The CHA Textiles Group Sales, Revenue, and Gross Margin
- 6.11.4. The CHA Textiles Group Revenue and Growth Rate
- 6.11.5. The CHA Textiles Group Market Share
- 6.11.6. Recent Initiatives, Funding/VC Activities, and Technological Innovations
- 6.12. Eastman Chemical Company
- 6.12.1. Company Overview
- 6.12.2. Product/Service Portfolio
- 6.12.3. Eastman Chemical Company Sales, Revenue, and Gross Margin
- 6.12.4. Eastman Chemical Company Revenue and Growth Rate
- 6.12.5. Eastman Chemical Company Market Share
- 6.12.6. Recent Initiatives, Funding/VC Activities, and Technological Innovations
- Chapter 7 Synthetic Fiber — Industry Analysis
- 7.1. Introduction and Taxonomy
- 7.2. Synthetic Fiber Market – Key Trends
- 7.2.1. Market Drivers
- 7.2.2. Market Restraints
- 7.2.3. Market Opportunities
- 7.3. Value Chain Analysis
- 7.4. Key Mandates and Regulations
- 7.5. Technology Roadmap and Timeline
- 7.6. Synthetic Fiber Market – Attractiveness Analysis
- 7.6.1. By Product
- 7.6.2. By Application
- 7.6.3. By Region
- Chapter 8 Industrial Chain, Sourcing Strategy, and Downstream Buyers
- 8.1. Synthetic Fiber Industrial Chain Analysis
- 8.2. Downstream Buyers
- 8.3. Distributors/Traders List
- Chapter 9 Marketing Strategy Analysis
- 9.1. Marketing Channel
- 9.2. Direct Marketing
- 9.3. Indirect Marketing
- 9.4. Marketing Channel Development Trends
- 9.5. Economic/Political Environmental Change
- Chapter 10 Report Conclusion & Key Insights
- 10.1. Key Insights from Primary Interviews & Surveys Respondents
- 10.2. Key Takeaways from Analysts, Consultants, and Industry Leaders
- Chapter 11 Research Approach & Methodology
- 11.1. Report Description
- 11.2. Research Scope
- 11.3. Research Methodology
- 11.3.1. Secondary Research
- 11.3.2. Primary Research
- 11.3.3. Statistical Models
- 11.3.3.1. Company Share Analysis Model
- 11.3.3.2. Revenue Based Modeling
- 11.3.4. Research Limitations
List of Figures
List of Figures
Fig.1 Product Picture of Synthetic Fiber
Fig.2 Global Synthetic Fiber Market, 2016 – 2028 (USD Billion)
Fig.3 Global Synthetic Fiber Market Absolute Revenue Opportunity, 2016 – 2028 (USD Billion)
Fig.4 Global Synthetic Fiber Market Incremental Revenue Opportunity, 2020 – 2028 (USD Billion)
Fig.5 Global Synthetic Fiber Market Share, by Product, 2019 & 2028 (USD Billion)
Fig.6 Global Polyester Synthetic Fiber Market, 2016 – 2028 (USD Billion)
Fig.7 Global Nylon Synthetic Fiber Market, 2016 – 2028 (USD Billion)
Fig.8 Global Acrylics Synthetic Fiber Market, 2016 – 2028 (USD Billion)
Fig.9 Global Polyolefins Synthetic Fiber Market, 2016 – 2028 (USD Billion)
Fig.10 Global Others Synthetic Fiber Market, 2016 – 2028 (USD Billion)
Fig.11 Global Synthetic Fiber Market Share, by Application, 2019 & 2028 (USD Billion)
Fig.12 Global Clothing Synthetic Fiber Market, 2016 – 2028 (USD Billion)
Fig.13 Global Home Furnishing Synthetic Fiber Market, 2016 – 2028 (USD Billion)
Fig.14 Global Automotive Synthetic Fiber Market, 2016 – 2028 (USD Billion)
Fig.15 Global Filtration Synthetic Fiber Market, 2016 – 2028 (USD Billion)
Fig.16 Global Others Synthetic Fiber Market, 2016 – 2028 (USD Billion)
Fig.17 Global Synthetic Fiber Market Share, by Region, 2019 & 2028 (USD Billion)
Fig.18 North America Synthetic Fiber Market, 2016 – 2028 (USD Billion)
Fig.19 U.S. Synthetic Fiber Market, 2016 – 2028 (USD Billion)
Fig.20 Canada Synthetic Fiber Market, 2016 – 2028 (USD Billion)
Fig.21 Europe Synthetic Fiber Market, 2016 – 2028 (USD Billion)
Fig.22 Germany Synthetic Fiber Market, 2016 – 2028 (USD Billion)
Fig.23 France Synthetic Fiber Market, 2016 – 2028 (USD Billion)
Fig.24 U.K. Synthetic Fiber Market, 2016 – 2028 (USD Billion)
Fig.25 Italy Synthetic Fiber Market, 2016 – 2028 (USD Billion)
Fig.26 Spain Synthetic Fiber Market, 2016 – 2028 (USD Billion)
Fig.27 Rest of Europe Synthetic Fiber Market, 2016 – 2028 (USD Billion)
Fig.28 Asia Pacific Synthetic Fiber Market, 2016 – 2028 (USD Billion)
Fig.29 China Synthetic Fiber Market, 2016 – 2028 (USD Billion)
Fig.30 Japan Synthetic Fiber Market, 2016 – 2028 (USD Billion)
Fig.31 India Synthetic Fiber Market, 2016 – 2028 (USD Billion)
Fig.32 South Korea Synthetic Fiber Market, 2016 – 2028 (USD Billion)
Fig.33 South-East Asia Synthetic Fiber Market, 2016 – 2028 (USD Billion)
Fig.34 Rest of Asia Pacific Synthetic Fiber Market, 2016 – 2028 (USD Billion)
Fig.35 Latin America Synthetic Fiber Market, 2016 – 2028 (USD Billion)
Fig.36 Brazil Synthetic Fiber Market, 2016 – 2028 (USD Billion)
Fig.37 Mexico Synthetic Fiber Market, 2016 – 2028 (USD Billion)
Fig.38 Rest of Latin America Synthetic Fiber Market, 2016 – 2028 (USD Billion)
Fig.39 The Middle-East and Africa Synthetic Fiber Market, 2016 – 2028 (USD Billion)
Fig.40 GCC Countries Synthetic Fiber Market, 2016 – 2028 (USD Billion)
Fig.41 South Africa Synthetic Fiber Market, 2016 – 2028 (USD Billion)
Fig.42 Rest of Middle-East Africa Synthetic Fiber Market, 2016 – 2028 (USD Billion)
Fig.43 Competitor Market Share – Revenue
Fig.44 Bombay Dyeing Revenue and Growth Rate
Fig.45 Bombay Dyeing Market Share
Fig.46 E. I. du Pont de Nemours & Company Revenue and Growth Rate
Fig.47 E. I. du Pont de Nemours & Company Market Share
Fig.48 Lenzing AG Revenue and Growth Rate
Fig.49 Lenzing AG Market Share
Fig.50 Mitsubishi Chemical Holdings Corp Revenue and Growth Rate
Fig.51 Mitsubishi Chemical Holdings Corp Market Share
Fig.52 Reliance Industries Inc Revenue and Growth Rate
Fig.53 Reliance Industries Inc Market Share
Fig.54 China Petroleum Corp Revenue and Growth Rate
Fig.55 China Petroleum Corp Market Share
Fig.56 Telijn Ltd Revenue and Growth Rate
Fig.57 Telijn Ltd Market Share
Fig.58 Toray Chemical Korea Inc Revenue and Growth Rate
Fig.59 Toray Chemical Korea Inc Market Share
Fig.60 Toyobo Co. Ltd Revenue and Growth Rate
Fig.61 Toyobo Co. Ltd Market Share
Fig.62 W. Barnet GmbH & Co. KG Revenue and Growth Rate
Fig.63 W. Barnet GmbH & Co. KG Market Share
Fig.64 The CHA Textiles Group Revenue and Growth Rate
Fig.65 The CHA Textiles Group Market Share
Fig.66 Eastman Chemical Company Revenue and Growth Rate
Fig.67 Eastman Chemical Company Market Share
Fig.68 Market Dynamics
Fig.69 Global Synthetic Fiber – Value Chain Analysis
Fig.70 Key Mandates and Regulations
Fig.71 Technology Roadmap and Timeline
Fig.72 Market Attractiveness Analysis – By Product
Fig.73 Market Attractiveness Analysis – By Application
Fig.74 Market Attractiveness Analysis – By Region
Fig.75 Synthetic Fiber Industrial Chain Analysis
Fig.76 Market Channels
Fig.77 Marketing Channel Development Trend
Fig.78 Growth in World Gross Product, 2008-2018
List of Tables
List of Tables
Table 1 Global Synthetic Fiber Market, 2019 & 2028 (USD Billion)
Table 2 Global Synthetic Fiber Market, by Product, 2016 – 2028 (USD Billion)
Table 3 Global Synthetic Fiber Market, by Application, 2016 – 2028 (USD Billion)
Table 4 Global Synthetic Fiber Market, by Region, 2016 – 2028 (USD Billion)
Table 5 North America Synthetic Fiber Market, by Country, 2016 – 2028 (USD Billion)
Table 6 North America Synthetic Fiber Market, by Product, 2016 – 2028 (USD Billion)
Table 7 North America Synthetic Fiber Market, by Application, 2016 – 2028 (USD Billion)
Table 8 Europe Synthetic Fiber Market, by Country, 2016 – 2028 (USD Billion)
Table 9 Europe Synthetic Fiber Market, by Product, 2016 – 2028 (USD Billion)
Table 10 Europe Synthetic Fiber Market, by Application, 2016 – 2028 (USD Billion)
Table 11 Asia Pacific Synthetic Fiber Market, by Country, 2016 – 2028 (USD Billion)
Table 12 Asia Pacific Synthetic Fiber Market, by Product, 2016 – 2028 (USD Billion)
Table 13 Asia Pacific Synthetic Fiber Market, by Application, 2016 – 2028 (USD Billion)
Table 14 Latin America Synthetic Fiber Market, by Country, 2016 – 2028 (USD Billion)
Table 15 Latin America Synthetic Fiber Market, by Product, 2016 – 2028 (USD Billion)
Table 16 Latin America Synthetic Fiber Market, by Application, 2016 – 2028 (USD Billion)
Table 17 The Middle-East and Africa Synthetic Fiber Market, by Country, 2016 – 2028 (USD Billion)
Table 18 The Middle-East and Africa Synthetic Fiber Market, by Product, 2016 – 2028 (USD Billion)
Table 19 The Middle-East and Africa Synthetic Fiber Market, by Application, 2016 – 2028 (USD Billion)
Table 20 Global Synthetic Fiber Market - Company Revenue Analysis, 2016 – 2019 (USD Billion)
Table 21 Global Synthetic Fiber Market - Company Revenue Share Analysis, 2016 – 2019 (%)
Table 22 Acquisitions and Mergers
Table 23 Market Drivers – Impact Analysis
Table 24 Market Restraints
Table 25 Market Opportunities
Table 26 Major Buyers of Synthetic Fiber
Table 27 Distributors/Traders of Synthetic Fiber by Region

 Market Overview