![]()
Search Market Research Report
Sustainable Supply Chain Finance Market Size, Share Global Analysis Report, 2018 – 2027

Sustainable Supply Chain Finance Market By Type (Financial Institution, Buyer Financed, Multiple Source, and Supplier Financed), By Organization Size (Large Enterprises and Small & Medium-Sized enterprises), and By End-User (Footwear & Apparel, Food & Beverage, Automobile, Power & Energy, Chemicals & Materials, and Manufacturing): Global Industry Perspective, Comprehensive Analysis, and Forecast 2018 – 2027
Industry Insights
The report covers the forecast and analysis of the Sustainable Supply Chain Finance market on a global and regional level. The study provides historical data from 2015 to 2018 along with a forecast from 2019 to 2027 based on revenue (USD Million). The study includes drivers and restraints of the Sustainable Supply Chain Finance market along with the impact they have on the demand over the forecast period. Additionally, the report includes the study of opportunities available in the Sustainable Supply Chain Finance market on a global level.
In order to give the users of this report a comprehensive view of the Sustainable Supply Chain Finance market, we have included a competitive landscape and an analysis of Porter’s Five Forces model for the market. The study encompasses a market attractiveness analysis, wherein all the segments are benchmarked based on their market size, growth rate, and general attractiveness.
The report provides company market share analysis to give a broader overview of the key players in the market. In addition, the report also covers key strategic developments of the market including acquisitions & mergers, new service & product launches, agreements, partnerships, collaborations & joint ventures, research & development, and regional expansion of major participants involved in the market on a global and regional basis.
 Report Scope
Report Attributes |
Details |
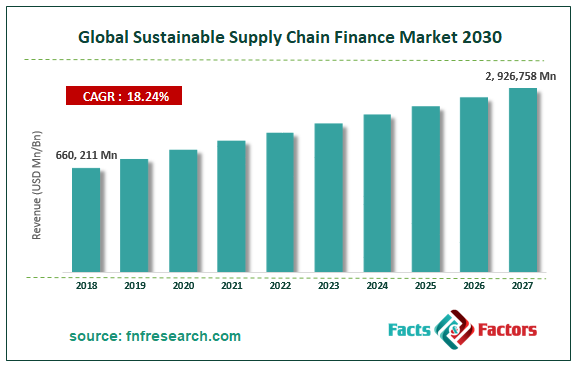
Market Size in 2018 |
USD 660, 211 Million |
Projected Market Size in 2027 |
USD 2, 926,758 Million |
Growth Rate |
CAGR 18.24 % |
Base Year |
2018 |
Forecast Years |
2019 – 2027 |
Key Market Players |
BNP Paribas, DBS Bank Ltd., Citigroup, Inc., First Abu Dhabi Bank, ING Bank N.V., FMO, Standard Chartered, HSBC Group, and TIER Sustainable Supply Chain Finance. |
Key Segment |
By Type, By Organization Size, By End-User, By Regional |
Major Regions Covered |
North America, Europe, Asia Pacific, Latin America, and the Middle East & Africa |
Purchase Options |
Request customized purchase options to meet your research needs. Explore purchase options |
The study provides a decisive view of the Sustainable Supply Chain Finance market by segmenting the market based on type, organization size, end-user, and regions. All the segments have been analyzed based on present and future trends and the market is estimated from 2019 to 2027. The regional segmentation includes the current and forecast demand for North America, Europe, Asia Pacific, Latin America, and the Middle East and Africa.
The rapid expansion of the supply chain finance ecosystem for sustaining the operational efficiency of banks and FinTech players will further steer the market expansion during the forecast timeline. Nevertheless, complications involved in the supply chain activities and automation can pose a threat to the expansion of the sustainable supply chain finance industry during the period from 2019 to 2027. Moreover, new technologies like telemedicine, digital communication equipment, and remote charting are prone to vulnerabilities. Additionally, lack of system consistency can also pose a challenge to the industry growth. However, the presence of a large number of online firms will help in enhancing the functionalities of traditional processes, thereby creating lucrative growth avenues for the market over the forecast period.
Based on the type, the industry is sectored into Financial Institution, Buyer Financed, Multiple Source, and Supplier Financed. On the basis of organization size, the market is divided into Large Enterprises and Small & Medium-Sized enterprises. In terms of end-user, the sustainable supply chain finance industry is divided into Footwear & Apparel, Food & Beverage, Automobile, Power & Energy, Chemicals & Materials, and Manufacturing.
Some of the key players in the market include
- BNP Paribas
- DBS Bank Ltd.
- Citigroup Inc.
- First Abu Dhabi Bank
- ING Bank N.V.
- FMO
- Standard Chartered
- HSBC Group
- TIER Sustainable Supply Chain Finance.
Table of Content
Industry Major Market Players
- BNP Paribas
- DBS Bank Ltd.
- Citigroup Inc.
- First Abu Dhabi Bank
- ING Bank N.V.
- FMO
- Standard Chartered
- HSBC Group
- TIER Sustainable Supply Chain Finance


Copyright © 2025 - 2026, All Rights Reserved, Facts and Factors