Search Market Research Report

Discover Our Latest Reports
Discover Our Featured Reports
Discover Top Selling Reports

Surfactant EOR Market Size, Share Global Analysis Report, 2020–2026

report img

Surfactant EOR Market By Type (Anionic Surfactants, Zwitterionic, Non Ionics and Others) and By Application (Onshore and Offshore): Global Industry Outlook, Market Size, Business Intelligence, Consumer Preferences, Statistical Surveys, Comprehensive Analysis, Historical Developments, Current Trends, and Forecast 2020–2026

Industry Insights

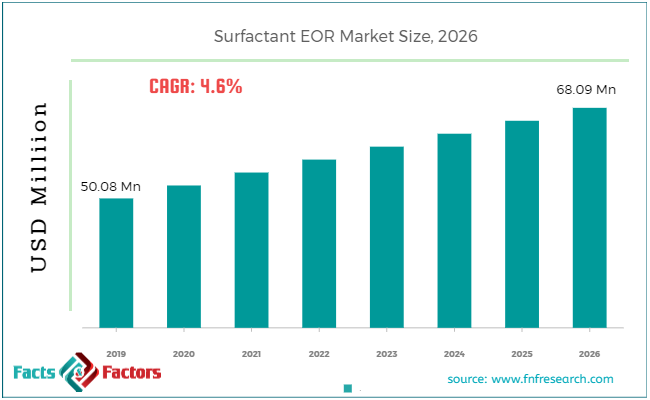
According to the report published by Facts & Factors, the global Surfactant EOR market size was worth around USD 50.08 million in 2019 and is predicted to grow around USD 68.09 million by 2026 with a compound annual growth rate (CAGR) of roughly 4.6% between 2020 and 2026. The report analyzes the global Surfactant EOR market drivers, restraints/challenges, and the effect they have on the demands during the projection period. In addition, the report explores emerging opportunities in the Surfactant EOR market.

The surfactant EOR market report analyzes and notifies the industry statistics at the global as well as regional and country levels in order to acquire a thorough perspective of the entire surfactant EOR market. The historical and past insights are provided for FY 2016 to FY 2019 whereas projected trends are delivered for FY 2020 to FY 2026. The quantitative and numerical data is represented in terms of both volume (Units) and value (USD Million) from FY 2016 – 2026.

This specialized and expertise-oriented industry research report scrutinizes the technical and commercial business outlook of the surfactant EOR industry. The report analyzes and declares the historical and current trends analysis of the surfactant industry and subsequently recommends the projected trends anticipated to be observed in the surfactant EOR market during the upcoming years.

Surfactant EOR Market Size

To know more about this report | Request Free Sample Copy

logoKey Insights from Primary Research

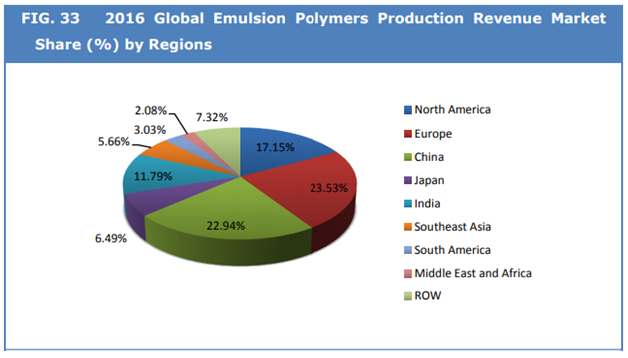
  • As per our primary respondents, North America dominated the global surfactant EOR market and it accounted for around 40% of the total value of global surfactant EORin 2019.
  • It was established through the primary interview that the global emulsion polymers market has been accounted for around USD 50 Million in 2019.
  • In future years ahead, Asia Pacific is predicted to be one of the fastest-growing markets for surfactant EOR products.
  • On the basis of the product segment, acrylics dominated the global emulsion polymers market in 2019.
  • Based on various applications, the global emulsion polymer market was led by paints and coatings in 2019.

logoKey Recommendations from Analysts

  • As per our analysts, the global emulsion polymers market is expected to grow significantly over the forecast period.
  • The strategic and competitive advantage provided by acrylic polymers is anticipated to be the key factor driving this market globally.
  • Our team of analysts has identified, growing construction and automotive sectors especially in China, India, Thailand and Indonesia will fuel the growth of the market.
  • In recent years, the painting and coating industry will offer lucrative opportunities for the market players operating in the market.
  • Overall, the global market has the potential to grow owing to its overall globalization phase.

logoEmulsion Polymers Production Market Share – By Region

Surfactant EOR Market

To know more about this report | Request Free Sample Copy

The quantitative data is further underlined and reinforced by comprehensive qualitative data which comprises various across-the-board market dynamics. The rationales which directly or indirectly impact the surfactant EOR industry are exemplified through parameters such as growth drivers, restraints, challenges, and opportunities among other impacting factors.

Throughout our research report, we have encompassed all the proven models and tools of industry analysis and extensively illustrated all the key business strategies and business models adopted in the surfactant EOR industry. The report provides an all-inclusive and detailed competitive landscape prevalent in the surfactant EOR market.

The report utilizes established industry analysis tools and models such as Porter’s Five Forces framework to analyze and recognize critical business strategies adopted by various stakeholders involved in the entire value chain of the surfactant EOR industry. The surfactant EOR market report additionally employs SWOT analysis and PESTLE analysis models for further in-depth analysis.

The report study further includes an in-depth analysis of industry players' market shares and provides an overview of leading players' market position in the surfactant EOR sector. Key strategic developments in the surfactant EOR market competitive landscape such as acquisitions & mergers, inaugurations of different products and services, partnerships & joint ventures, MoU agreements, VC & funding activities, R&D activities, and geographic expansion among other noteworthy activities by key players of the surfactant EOR market are appropriately highlighted in the report.

A rise in oil & gas prices has significantly increased the need for EOR processes and materials. This has stimulated higher market demand for specialty, higher-cost surfactants, such as cationic and amphoteric, which are more expensive than nonionic and anionics but perform better.

Moreover, a decrease in oil reserves has raised the requirement for horizontal and deeper drilling activities in tough terrains to increase. As a result, carrying out EOR techniques will grow the demand for surfactants.

For oil production, mostly onshore activities are carried out so that surfactants could be used widely to recover a huge quantity of oil from onshore reserves in comparison to offshore reserves. Thereby, enhanced oil recovery production has been implemented by oil field companies and has witnessed a significant increase in enhanced oil recovery output. Therefore, it indicates that the high adoption of EOR methods will grow the surfactant EOR market globally.

The surfactant EOR market research report delivers an acute evaluation and taxonomy of the surfactant EOR industry by practically splitting the market on the basis of different types, applications, and regions. Through the analysis of the historical and projected trends, all the segments and sub-segments were evaluated through the bottom-up approach, and different market sizes have been projected for FY 2020 to FY 2026.

The regional segmentation of the surfactant EOR industry includes the complete classification of all the major continents including North America, Latin America, Europe, Asia Pacific, and the Middle East & Africa. Further, country-wise data for the surfactant EOR industry is provided for the leading economies of the world.

logoReport Scope

Report Attribute

Details

Market Size in 2019

USD 50.08 Million

Projected Market Size in 2026

USD 68.09 Million

CAGR Growth Rate

4.6% CAGR

Base Year

2019

Forecast Years

2020-2026

Key Market Players

Stepan Company. Nalco Champion, BASF, Baker Hughes, Solvay, Dow Inc., Clariant, Schlumberger, Shell Chemicals, Huntsman, Halliburton, Oil Chem Technologies, Akzo Nobel, and China National Petroleum Corporation and others.

Key Segment

By , Type , Application ,and Region

Major Regions Covered

North America, Europe, Asia Pacific, Latin America, and the Middle East &, Africa

Purchase Options

Request customized purchase options to meet your research needs. Explore purchase options

The surfactant EOR market is segmented based on type and application.  On the basis of type segmentation, the market is classified into anionic surfactants, zwitterionic, and non-ionics among others. In terms of application segmentation, the market is bifurcated into onshore and offshore.

logoSome of the essential players operating in the surfactant EOR market, but not restricted to include

  • Stepan Company. Nalco Champion
  •  BASF
  •  Baker Hughes
  •  Solvay
  •  Dow Inc.
  •  Clariant
  •  Schlumberger
  •  Shell Chemicals
  •  Huntsman
  •  Halliburton
  •  Oil Chem Technologies
  •  Akzo Nobel
  •  China National Petroleum Corporation

The taxonomy of the surfactant EOR industry by its scope and segmentation is as follows:

logo By Type Segmentation Analysis

  • Type
    • Anionic Surfactants
      • Internal olefin Sulfonates
      • Alkylbenzene Sulfonates
      • Alkyl Glycerol Ether Sulfonates
      • Sulfates
      • Carboxylates
      • Phosphoric Acid Esters Sulfosuccinates
      • Others
    • Zwitterionic
      • Cocamidopropyl Betaine
      • Hydroxysultaines
      • Phospholipids
      • Other
    • Non Ionics
      • Ethoxy Propoxy Alcools
      • Others

logo By Application Segmentation Analysis

  • Onshore
  • Offshore

logoGlobal Surfactant EOR Market: Regional Segmentation Analysis

  • North America
    • The U.S.
    • Canada
  • Europe
    • Germany
    • The UK
    • France
    • Spain
    • Italy
    • Rest of Europe
  • Asia Pacific
    • China
    • Japan
    • India
    • South Korea
    • Southeast Asia
    • Rest of Asia Pacific
  • Latin America
    • Brazil
    • Mexico
    • Rest of Latin America
  • Middle East & Africa
    • GCC
    • South Africa
    • Rest of Middle East & Africa

Table of Content

  1. CHAPTER 1. Executive Summary
  2. CHAPTER 2. Surfactant EOR market – Type Analysis
    1. 2.1. Global Surfactant EOR Market – Type Overview
    2. 2.2. Global Surfactant EOR Market Share, by Type, 2018 & 2025 (USD Million)
    3. 2.3. Global Surfactant EOR Market share, by Type, 2018 & 2025 (Kilo Tons)
    4. 2.4. Anionic Surfactants
      1. 2.4.1. Global Anionic Surfactants Surfactant EOR Market, 2016-2026 (USD Million)
      2. 2.4.2. Global Anionic Surfactants Surfactant EOR Market, 2016-2026 (Kilo Tons)
    5. 2.5. Zwitterionics
      1. 2.5.1. Global Zwitterionics Surfactant EOR Market, 2016-2026 (USD Million)
      2. 2.5.2. Global Zwitterionics Surfactant EOR Market, 2016-2026 (Kilo Tons)
    6. 2.6. Non Ionics
      1. 2.6.1. Global Non Ionics Surfactant EOR Market, 2016-2026 (USD Million)
      2. 2.6.2. Global Non Ionics Surfactant EOR Market, 2016-2026 (Kilo Tons)
    7. 2.7. Others
      1. 2.7.1. Global Others Surfactant EOR Market, 2016-2026 (USD Million)
      2. 2.7.2. Global Others Surfactant EOR Market, 2016-2026 (Kilo Tons)
  3. CHAPTER 3. Surfactant EOR market – Application Analysis
    1. 3.1. Global Surfactant EOR Market – Application Overview
    2. 3.2. Global Surfactant EOR Market Share, by Application, 2018 & 2025 (USD Million)
    3. 3.3. Global Surfactant EOR Market share, by Application, 2018 & 2025 (Kilo Tons)
    4. 3.4. Onshore
      1. 3.4.1. Global Onshore Surfactant EOR Market, 2016-2026 (USD Million)
      2. 3.4.2. Global Onshore Surfactant EOR Market, 2016-2026 (Kilo Tons)
    5. 3.5. Offshore
      1. 3.5.1. Global Offshore Surfactant EOR Market, 2016-2026 (USD Million)
      2. 3.5.2. Global Offshore Surfactant EOR Market, 2016-2026 (Kilo Tons)
  4. CHAPTER 4. Surfactant EOR market – Regional Analysis
    1. 4.1. Global Surfactant EOR Market Regional Overview
    2. 4.2. Global Surfactant EOR Market Share, by Region, 2018 & 2025 (Value)
    3. 4.3. Global Surfactant EOR Market Share, by Region, 2018 & 2025 (Volume)
    4. 4.4. North America
      1. 4.4.1. North America Surfactant EOR Market size and forecast, 2016-2026
      2. 4.4.2. North America Surfactant EOR Market, by Country, 2018 - 2025 (USD Million)
      3. 4.4.3. North America Market size and forecast, 2016-2026 (Kilo Tons)
      4. 4.4.4. North America Surfactant EOR Market, by Country, 2018 - 2025 (Kilo Tons)
      5. 4.4.5. North America Surfactant EOR Market, by Type, 2016-2026
        1. 4.4.5.1. North America Surfactant EOR Market, by Type, 2016-2026 (USD Million)
        2. 4.4.5.2. North America Surfactant EOR Market, by Type, 2016-2026 (Kilo Tons)
      6. 4.4.6. North America Surfactant EOR Market, by Application, 2016-2026
        1. 4.4.6.1. North America Surfactant EOR Market, by Application, 2016-2026 (USD Million)
        2. 4.4.6.2. North America Surfactant EOR Market, by Application, 2016-2026 (Kilo Tons)
      7. 4.4.7. U.S.
        1. 4.4.7.1. U.S. Market size and forecast, 2016-2026 (USD Million)
        2. 4.4.7.2. U.S. Market size and forecast, 2016-2026 (Kilo Tons)
      8. 4.4.8. Canada
        1. 4.4.8.1. Canada Market size and forecast, 2016-2026 (USD Million)
        2. 4.4.8.2. Canada Market size and forecast, 2016-2026 (Kilo Tons)
    5. 4.5. Europe
      1. 4.5.1. Europe Surfactant EOR Market size and forecast, 2016-2026
      2. 4.5.2. Europe Surfactant EOR Market, by Country, 2018 - 2025 (USD Million)
      3. 4.5.3. Europe Market size and forecast, 2016-2026 (Kilo Tons)
      4. 4.5.4. Europe Surfactant EOR Market, by Country, 2018 - 2025 (Kilo Tons)
      5. 4.5.5. Europe Surfactant EOR Market, by Type, 2016-2026
        1. 4.5.5.1. Europe Surfactant EOR Market, by Type, 2016-2026 (USD Million)
        2. 4.5.5.2. Europe Surfactant EOR Market, by Type, 2016-2026 (Kilo Tons)
      6. 4.5.6. Europe Surfactant EOR Market, by Application, 2016-2026
        1. 4.5.6.1. Europe Surfactant EOR Market, by Application, 2016-2026 (USD Million)
        2. 4.5.6.2. Europe Surfactant EOR Market, by Application, 2016-2026 (Kilo Tons)
      7. 4.5.7. Germany
        1. 4.5.7.1. Germany Market size and forecast, 2016-2026 (USD Million)
        2. 4.5.7.2. Germany Market size and forecast, 2016-2026 (Kilo Tons)
      8. 4.5.8. France
        1. 4.5.8.1. France Market size and forecast, 2016-2026 (USD Million)
        2. 4.5.8.2. France Market size and forecast, 2016-2026 (Kilo Tons)
      9. 4.5.9. U.K.
        1. 4.5.9.1. U.K. Market size and forecast, 2016-2026 (USD Million)
        2. 4.5.9.2. U.K. Market size and forecast, 2016-2026 (Kilo Tons)
      10. 4.5.10. Italy
        1. 4.5.10.1. Italy Market size and forecast, 2016-2026 (USD Million)
        2. 4.5.10.2. Italy Market size and forecast, 2016-2026 (Kilo Tons)
      11. 4.5.11. Spain
        1. 4.5.11.1. Spain Market size and forecast, 2016-2026 (USD Million)
        2. 4.5.11.2. Spain Market size and forecast, 2016-2026 (Kilo Tons)
      12. 4.5.12. Rest of Europe
        1. 4.5.12.1. Rest of Europe Market size and forecast, 2016-2026 (USD Million)
        2. 4.5.12.2. Rest of Europe Market size and forecast, 2016-2026 (Kilo Tons)
    6. 4.6. Asia Pacific
      1. 4.6.1. Asia Pacific Surfactant EOR Market size and forecast, 2016-2026
      2. 4.6.2. Asia Pacific Surfactant EOR Market, by Country, 2018 - 2025 (USD Million)
      3. 4.6.3. Asia Pacific Market size and forecast, 2016-2026 (Kilo Tons)
      4. 4.6.4. Asia Pacific Surfactant EOR Market, by Country, 2018 - 2025 (Kilo Tons)
      5. 4.6.5. Asia Pacific Surfactant EOR Market, by Type, 2016-2026
        1. 4.6.5.1. Asia Pacific Surfactant EOR Market, by Type, 2016-2026 (USD Million)
        2. 4.6.5.2. Asia Pacific Surfactant EOR Market, by Type, 2016-2026 (Kilo Tons)
      6. 4.6.6. Asia Pacific Surfactant EOR Market, by Application, 2016-2026
        1. 4.6.6.1. Asia Pacific Surfactant EOR Market, by Application, 2016-2026 (USD Million)
        2. 4.6.6.2. Asia Pacific Surfactant EOR Market, by Application, 2016-2026 (Kilo Tons)
      7. 4.6.7. China
        1. 4.6.7.1. China Market size and forecast, 2016-2026 (USD Million)
        2. 4.6.7.2. China Market size and forecast, 2016-2026 (Kilo Tons)
      8. 4.6.8. Japan
        1. 4.6.8.1. Japan Market size and forecast, 2016-2026 (USD Million)
        2. 4.6.8.2. Japan Market size and forecast, 2016-2026 (Kilo Tons)
      9. 4.6.9. India
        1. 4.6.9.1. India Market size and forecast, 2016-2026 (USD Million)
        2. 4.6.9.2. India Market size and forecast, 2016-2026 (Kilo Tons)
      10. 4.6.10. South Korea
        1. 4.6.10.1. South Korea Market size and forecast, 2016-2026 (USD Million)
        2. 4.6.10.2. South Korea Market size and forecast, 2016-2026 (Kilo Tons)
      11. 4.6.11. South-East Asia
        1. 4.6.11.1. South-East Asia Market size and forecast, 2016-2026 (USD Million)
        2. 4.6.11.2. South-East Asia Market size and forecast, 2016-2026 (Kilo Tons)
      12. 4.6.12. Rest of Asia Pacific
        1. 4.6.12.1. Rest of Asia Pacific Market size and forecast, 2016-2026 (USD Million)
        2. 4.6.12.2. Rest of Asia Pacific Market size and forecast, 2016-2026 (Kilo Tons)
    7. 4.7. Latin America
      1. 4.7.1. Latin America Surfactant EOR Market size and forecast, 2016-2026
      2. 4.7.2. Latin America Surfactant EOR Market, by Country, 2018 - 2025 (USD Million)
      3. 4.7.3. Latin America Market size and forecast, 2016-2026 (Kilo Tons)
      4. 4.7.4. Latin America Surfactant EOR Market, by Country, 2018 - 2025 (Kilo Tons)
      5. 4.7.5. Latin America Surfactant EOR Market, by Type, 2016-2026
        1. 4.7.5.1. Latin America Surfactant EOR Market, by Type, 2016-2026 (USD Million)
        2. 4.7.5.2. Latin America Surfactant EOR Market, by Type, 2016-2026 (Kilo Tons)
      6. 4.7.6. Latin America Surfactant EOR Market, by Application, 2016-2026
        1. 4.7.6.1. Latin America Surfactant EOR Market, by Application, 2016-2026 (USD Million)
        2. 4.7.6.2. Latin America Surfactant EOR Market, by Application, 2016-2026 (Kilo Tons)
      7. 4.7.7. Brazil
        1. 4.7.7.1. Brazil Market size and forecast, 2016-2026 (USD Million)
        2. 4.7.7.2. Brazil Market size and forecast, 2016-2026 (Kilo Tons)
      8. 4.7.8. Mexico
        1. 4.7.8.1. Mexico Market size and forecast, 2016-2026 (USD Million)
        2. 4.7.8.2. Mexico Market size and forecast, 2016-2026 (Kilo Tons)
      9. 4.7.9. Rest of Latin America
        1. 4.7.9.1. Rest of Latin America Market size and forecast, 2016-2026 (USD Million)
        2. 4.7.9.2. Rest of Latin America Market size and forecast, 2016-2026 (Kilo Tons)
    8. 4.8. The Middle-East and Africa
      1. 4.8.1. The Middle-East and Africa Surfactant EOR Market size and forecast, 2016-2026
      2. 4.8.2. The Middle-East and Africa Surfactant EOR Market, by Country, 2018 - 2025 (USD Million)
      3. 4.8.3. The Middle-East and Africa Market size and forecast, 2016-2026 (Kilo Tons)
      4. 4.8.4. The Middle-East and Africa Surfactant EOR Market, by Country, 2018 - 2025 (Kilo Tons)
      5. 4.8.5. The Middle-East and Africa Surfactant EOR Market, by Type, 2016-2026
        1. 4.8.5.1. The Middle-East and Africa Surfactant EOR Market, by Type, 2016-2026 (USD Million)
        2. 4.8.5.2. The Middle-East and Africa Surfactant EOR Market, by Type, 2016-2026 (Kilo Tons)
      6. 4.8.6. The Middle-East and Africa Surfactant EOR Market, by Application, 2016-2026
        1. 4.8.6.1. The Middle-East and Africa Surfactant EOR Market, by Application, 2016-2026 (USD Million)
        2. 4.8.6.2. The Middle-East and Africa Surfactant EOR Market, by Application, 2016-2026 (Kilo Tons)
      7. 4.8.7. GCC Countries
        1. 4.8.7.1. GCC Countries Market size and forecast, 2016-2026 (USD Million)
        2. 4.8.7.2. GCC Countries Market size and forecast, 2016-2026 (Kilo Tons)
      8. 4.8.8. South Africa
        1. 4.8.8.1. South Africa Market size and forecast, 2016-2026 (USD Million)
        2. 4.8.8.2. South Africa Market size and forecast, 2016-2026 (Kilo Tons)
      9. 4.8.9. Rest of Middle-East Africa
        1. 4.8.9.1. Rest of Middle-East Africa Market size and forecast, 2016-2026 (USD Million)
        2. 4.8.9.2. Rest of Middle-East Africa Market size and forecast, 2016-2026 (Kilo Tons)
  5. CHAPTER 5. Surfactant EOR Production, Consumption, Export, Import by Regions
    1. 5.1. Global Surfactant EOR production and revenue, 2015-2025 (USD Million) (Kilo Tons)
    2. 5.2. Global Import and Export Analysis, by Region
  6. CHAPTER 6. Surfactant EOR market – Competitive Landscape
    1. 6.1. Competitor Market Share – Revenue
    2. 6.2. Market Concentration Rate Analysis, Top 3 and Top 5 Players
    3. 6.3. Competitor Market Share – Volume
    4. 6.4. Strategic Development
      1. 6.4.1. Acquisitions and Mergers
      2. 6.4.2. New Products
      3. 6.4.3. Research & Development Activities
  7. CHAPTER 7. Company Profiles
    1. 7.1. Stepan Company
      1. 7.1.1. Company Overview
      2. 7.1.2. Stepan Company Sales, Revenue, Price, and Gross Margin
      3. 7.1.3. Product portfolio
      4. 7.1.4. Recent initiatives
    2. 7.2. Nalco Champion
      1. 7.2.1. Company Overview
      2. 7.2.2. Nalco Champion Sales, Revenue, Price, and Gross Margin
      3. 7.2.3. Product portfolio
      4. 7.2.4. Recent initiatives
    3. 7.3. BASF
      1. 7.3.1. Company Overview
      2. 7.3.2. BASF Sales, Revenue, Price, and Gross Margin
      3. 7.3.3. Product portfolio
      4. 7.3.4. Recent initiatives
    4. 7.4. Baker Hughes
      1. 7.4.1. Company Overview
      2. 7.4.2. Baker Hughes Sales, Revenue, Price, and Gross Margin
      3. 7.4.3. Product portfolio
      4. 7.4.4. Recent initiatives
    5. 7.5. Solvay
      1. 7.5.1. Company Overview
      2. 7.5.2. Solvay Sales, Revenue, Price, and Gross Margin
      3. 7.5.3. Product portfolio
      4. 7.5.4. Recent initiatives
    6. 7.6. Dow Inc.
      1. 7.6.1. Company Overview
      2. 7.6.2. Dow Inc. Sales, Revenue, Price, and Gross Margin
      3. 7.6.3. Product portfolio
      4. 7.6.4. Recent initiatives
    7. 7.7. Clariant
      1. 7.7.1. Company Overview
      2. 7.7.2. Clariant Sales, Revenue, Price, and Gross Margin
      3. 7.7.3. Product portfolio
      4. 7.7.4. Recent initiatives
    8. 7.8. Schlumberger
      1. 7.8.1. Company Overview
      2. 7.8.2. Schlumberger Sales, Revenue, Price, and Gross Margin
      3. 7.8.3. Product portfolio
      4. 7.8.4. Recent initiatives
    9. 7.9. Shell Chemicals
      1. 7.9.1. Company Overview
      2. 7.9.2. Shell Chemicals Sales, Revenue, Price, and Gross Margin
      3. 7.9.3. Product portfolio
      4. 7.9.4. Recent initiatives
    10. 7.10. Huntsman
      1. 7.10.1. Company Overview
      2. 7.10.2. Huntsman Sales, Revenue, Price, and Gross Margin
      3. 7.10.3. Product portfolio
      4. 7.10.4. Recent initiatives
    11. 7.11. Halliburton
      1. 7.11.1. Company Overview
      2. 7.11.2. Halliburton Sales, Revenue, Price, and Gross Margin
      3. 7.11.3. Product portfolio
      4. 7.11.4. Recent initiatives
    12. 7.12. Oil Chem Technologies
      1. 7.12.1. Company Overview
      2. 7.12.2. Oil Chem Technologies Sales, Revenue, Price, and Gross Margin
      3. 7.12.3. Product portfolio
      4. 7.12.4. Recent initiatives
    13. 7.13. Akzo Nobel
      1. 7.13.1. Company Overview
      2. 7.13.2. Akzo Nobel Sales, Revenue, Price, and Gross Margin
      3. 7.13.3. Product portfolio
      4. 7.13.4. Recent initiatives
    14. 7.14. China National Petroleum Corporation
      1. 7.14.1. Company Overview
      2. 7.14.2. China National Petroleum Corporation Sales, Revenue, Price, and Gross Margin
      3. 7.14.3. Product portfolio
      4. 7.14.4. Recent initiatives
    15. 7.15. C-KOE Metals
      1. 7.15.1. Company Overview
      2. 7.15.2. C-KOE Metals Sales, Revenue, Price, and Gross Margin
      3. 7.15.3. Product portfolio
      4. 7.15.4. Recent initiatives
    16. 7.16. Nippon Light Metal
      1. 7.16.1. Company Overview
      2. 7.16.2. Nippon Light Metal Sales, Revenue, Price, and Gross Margin
      3. 7.16.3. Product portfolio
      4. 7.16.4. Recent initiatives
    17. 7.17. Columbia Specialty Metals.
      1. 7.17.1. Company Overview
      2. 7.17.2. Columbia Specialty Metals. Sales, Revenue, Price, and Gross Margin
      3. 7.17.3. Product portfolio
      4. 7.17.4. Recent initiatives
  8. CHAPTER 8. Surfactant EOR — Industry Analysis
    1. 8.1. Introduction and Taxonomy
    2. 8.2. Surfactant EOR Market – Key Trends
      1. 8.2.1. Market Drivers
      2. 8.2.2. Market Restraints
      3. 8.2.3. Market Opportunities
    3. 8.3. Value Chain Analysis
    4. 8.4. Key Mandates and Regulations
    5. 8.5. Technology Roadmap and Timeline
    6. 8.6. Surfactant EOR market – Attractiveness Analysis
      1. 8.6.1. By Type
      2. 8.6.2. By Application
      3. 8.6.3. By Region
  9. CHAPTER 9. Raw Material analysis
    1. 9.1. Surfactant EOR Key Raw Material Analysis
      1. 9.1.1. Key Raw Materials
      2. 9.1.2. Price Trend of Key Raw Materials
    2. 9.2. Key Suppliers of Raw Materials
    3. 9.3. Proportion of Manufacturing Cost Structure
      1. 9.3.1. Raw Materials
      2. 9.3.2. Labor Cost
    4. 9.4. Manufacturing Expenses Analysis of Surfactant EOR
  10. CHAPTER 10. Industrial Chain, Sourcing Strategy and Downstream Buyers
    1. 10.1. Surfactant EOR Industrial Chain Analysis
    2. 10.2. Upstream Raw Materials Sourcing
      1. 10.2.1. Risk Mitigation:
      2. 10.2.2. Supplier Relationships:
      3. 10.2.3. Business Processes:
      4. 10.2.4. Securing the Product:
    3. 10.3. Raw Materials Sources of Surfactant EOR Major Manufacturers in 2016
    4. 10.4. Downstream Buyers
    5. 10.5. Distributors/Traders List
  11. CHAPTER 11. Marketing Strategy Analysis, Distributors
    1. 11.1. Marketing Channel
    2. 11.2. Direct Marketing
    3. 11.3. Indirect Marketing
    4. 11.4. Marketing Channel Development Trend
    5. 11.5. Economic/Political Environmental Change
  12. CHAPTER 12. Report Conclusion
  13. CHAPTER 13. Research Approach & Methodology
    1. 13.1. Report Description
    2. 13.2. Research Scope
    3. 13.3. Research Methodology
      1. 13.3.1. Secondary Research
      2. 13.3.2. Primary Research
      3. 13.3.3. Models
        1. 13.3.3.1. Company Share Analysis Model
        2. 13.3.3.2. Revenue Based Modeling
        3. 13.3.3.3. Research Limitations

        List of Figures

        FIG. 1 Global Surfactant EOR Market, 2016-2026 (USD Million)
        FIG. 2 Global Surfactant EOR Market Share, by Type, 2018 & 2025 (USD Million)
        FIG. 3 Global Surfactant EOR Market share, by Type, 2018 & 2025 (Kilo Tons)
        FIG. 4 Global Anionic Surfactants Surfactant EOR Market, 2016-2026 (USD Million)
        FIG. 5 Global Anionic Surfactants Surfactant EOR  Market, 2016-2026 (Kilo Tons)
        FIG. 6 Global Zwitterionics Surfactant EOR Market, 2016-2026 (USD Million)
        FIG. 7 Global Zwitterionics Surfactant EOR  Market, 2016-2026 (Kilo Tons)
        FIG. 8 Global Non Ionics Surfactant EOR Market, 2016-2026 (USD Million)
        FIG. 9 Global Non Ionics Surfactant EOR  Market, 2016-2026 (Kilo Tons)
        FIG. 10 Global Others Surfactant EOR Market, 2016-2026 (USD Million)
        FIG. 11 Global Others Surfactant EOR  Market, 2016-2026 (Kilo Tons)
        FIG. 12 Global Surfactant EOR Market Share, by Application, 2018 & 2025 (USD Million)
        FIG. 13 Global Surfactant EOR Market share, by Application, 2018 & 2025 (Kilo Tons)
        FIG. 14 Global Onshore Surfactant EOR Market, 2016-2026 (USD Million)
        FIG. 15 Global Onshore Surfactant EOR  Market, 2016-2026 (Kilo Tons)
        FIG. 16 Global Offshore Surfactant EOR Market, 2016-2026 (USD Million)
        FIG. 17 Global Offshore Surfactant EOR  Market, 2016-2026 (Kilo Tons)
        FIG. 18 Global Surfactant EOR Market Share, by Region, 2018 & 2025
        FIG. 19 Global Surfactant EOR Market Share, by Region, 2018 & 2025
        FIG. 20 North America Surfactant EOR Market, 2016-2026
        FIG. 21 North America Surfactant EOR  Market, 2016-2026 (Kilo Tons)
        FIG. 22 U.S. Surfactant EOR Market, 2016-2026
        FIG. 23 U.S. Surfactant EOR  Market, 2016-2026 (Kilo Tons)
        FIG. 24 Canada Surfactant EOR Market, 2016-2026
        FIG. 25 Canada Surfactant EOR  Market, 2016-2026 (Kilo Tons)
        FIG. 26 Europe Surfactant EOR Market, 2016-2026
        FIG. 27 Europe Surfactant EOR  Market, 2016-2026 (Kilo Tons)
        FIG. 28 Germany Surfactant EOR Market, 2016-2026
        FIG. 29 Germany Surfactant EOR  Market, 2016-2026 (Kilo Tons)
        FIG. 30 France Surfactant EOR Market, 2016-2026
        FIG. 31 France Surfactant EOR  Market, 2016-2026 (Kilo Tons)
        FIG. 32 U.K. Surfactant EOR Market, 2016-2026
        FIG. 33 U.K. Surfactant EOR  Market, 2016-2026 (Kilo Tons)
        FIG. 34 Italy Surfactant EOR Market, 2016-2026
        FIG. 35 Italy Surfactant EOR  Market, 2016-2026 (Kilo Tons)
        FIG. 36 Spain Surfactant EOR Market, 2016-2026
        FIG. 37 Spain Surfactant EOR  Market, 2016-2026 (Kilo Tons)
        FIG. 38 Rest of Europe Surfactant EOR Market, 2016-2026
        FIG. 39 Rest of Europe Surfactant EOR  Market, 2016-2026 (Kilo Tons)
        FIG. 40 Asia Pacific Surfactant EOR Market, 2016-2026
        FIG. 41 Asia Pacific Surfactant EOR  Market, 2016-2026 (Kilo Tons)
        FIG. 42 China Surfactant EOR Market, 2016-2026
        FIG. 43 China Surfactant EOR  Market, 2016-2026 (Kilo Tons)
        FIG. 44 Japan Surfactant EOR Market, 2016-2026
        FIG. 45 Japan Surfactant EOR  Market, 2016-2026 (Kilo Tons)
        FIG. 46 India Surfactant EOR Market, 2016-2026
        FIG. 47 India Surfactant EOR  Market, 2016-2026 (Kilo Tons)
        FIG. 48 South  Korea Surfactant EOR Market, 2016-2026
        FIG. 49 South  Korea Surfactant EOR  Market, 2016-2026 (Kilo Tons)
        FIG. 50 South-East Asia Surfactant EOR Market, 2016-2026
        FIG. 51 South-East Asia Surfactant EOR  Market, 2016-2026 (Kilo Tons)
        FIG. 52 Rest of Asia Pacific Surfactant EOR Market, 2016-2026
        FIG. 53 Rest of Asia Pacific Surfactant EOR  Market, 2016-2026 (Kilo Tons)
        FIG. 54 Latin America Surfactant EOR Market, 2016-2026
        FIG. 55 Latin America Surfactant EOR  Market, 2016-2026 (Kilo Tons)
        FIG. 56 Brazil Surfactant EOR Market, 2016-2026
        FIG. 57 Brazil Surfactant EOR  Market, 2016-2026 (Kilo Tons)
        FIG. 58 Mexico Surfactant EOR Market, 2016-2026
        FIG. 59 Mexico Surfactant EOR  Market, 2016-2026 (Kilo Tons)
        FIG. 60 Rest of Latin America Surfactant EOR Market, 2016-2026
        FIG. 61 Rest of Latin America Surfactant EOR  Market, 2016-2026 (Kilo Tons)
        FIG. 62 The Middle-East and Africa Surfactant EOR Market, 2016-2026
        FIG. 63 The Middle-East and Africa Surfactant EOR  Market, 2016-2026 (Kilo Tons)
        FIG. 64 GCC Countries Surfactant EOR Market, 2016-2026
        FIG. 65 GCC Countries Surfactant EOR  Market, 2016-2026 (Kilo Tons)
        FIG. 66 South Africa Surfactant EOR Market, 2016-2026
        FIG. 67 South Africa Surfactant EOR  Market, 2016-2026 (Kilo Tons)
        FIG. 68 Rest of Middle-East Africa Surfactant EOR Market, 2016-2026
        FIG. 69 Rest of Middle-East Africa Surfactant EOR  Market, 2016-2026 (Kilo Tons)
        FIG. 70 Global Surfactant EOR production and revenue, 2015-2025 (USD Million) (Kilo Tons)
        FIG. 71 North America Surfactant EOR production and revenue, 2015-2025 (USD Million) (Kilo Tons)
        FIG. 72 Europe Surfactant EOR production and revenue, 2015-2025 (USD Million) (Kilo Tons)
        FIG. 73 Asia Pacific Surfactant EOR production and revenue, 2015-2025 (USD Million) (Kilo Tons)
        FIG. 74 Latin America Surfactant EOR production and revenue, 2015-2025 (USD Million) (Kilo Tons)
        FIG. 75 Middle East and Africa Surfactant EOR production and revenue, 2015-2025 (USD Million) (Kilo Tons)
        FIG. 76 Competitor Market Share – Revenue
        FIG. 77 Competitor Market Share – Volume
        FIG. 78 Stepan Company Revenue and Growth Rate
        FIG. 79 Stepan Company Market Share
        FIG. 80 Nalco Champion Revenue and Growth Rate
        FIG. 81 Nalco Champion Market Share
        FIG. 82 BASF Revenue and Growth Rate
        FIG. 83 BASF Market Share
        FIG. 84 Baker Hughes Revenue and Growth Rate
        FIG. 85 Baker Hughes Market Share
        FIG. 86 Solvay Revenue and Growth Rate
        FIG. 87 Solvay Market Share
        FIG. 88 Dow Inc. Revenue and Growth Rate
        FIG. 89 Dow Inc. Market Share
        FIG. 90 Clariant Revenue and Growth Rate
        FIG. 91 Clariant Market Share
        FIG. 92 Schlumberger Revenue and Growth Rate
        FIG. 93 Schlumberger Market Share
        FIG. 94 Shell Chemicals Revenue and Growth Rate
        FIG. 95 Shell Chemicals Market Share
        FIG. 96 Huntsman Revenue and Growth Rate
        FIG. 97 Huntsman Market Share
        FIG. 98 Halliburton Revenue and Growth Rate
        FIG. 99 Halliburton Market Share
        FIG. 100 Oil Chem Technologies Revenue and Growth Rate
        FIG. 101 Oil Chem Technologies Market Share
        FIG. 102 Akzo Nobel Revenue and Growth Rate
        FIG. 103 Akzo Nobel Market Share
        FIG. 104 China National Petroleum Corporation Revenue and Growth Rate
        FIG. 105 China National Petroleum Corporation Market Share
        FIG. 106 C-KOE Metals Revenue and Growth Rate
        FIG. 107 C-KOE Metals Market Share
        FIG. 108 Nippon Light Metal Revenue and Growth Rate
        FIG. 109 Nippon Light Metal Market Share
        FIG. 110 Columbia Specialty Metals. Revenue and Growth Rate
        FIG. 111 Columbia Specialty Metals. Market Share
        FIG. 112 Market Dynamics
        FIG. 113 Global Surfactant EOR – Value Chain Analysis
        FIG. 114 Key Mandates and Regulations
        FIG. 115 Technology Roadmap and Timeline
        FIG. 116 Market Attractiveness Analysis – By Type
        FIG. 117 Market Attractiveness Analysis – By Application
        FIG. 118 Market Attractiveness Analysis – By Region
        FIG. 119 Manufacturing Cost Structure of Surfactant EOR
        FIG. 120 Surfactant EOR Industrial Chain Analysis
        FIG. 121 Market Channel
        FIG. 122 Marketing Channel Development Trend
        FIG. 123 Growth in World Gross Product, 2008-2018

        List of Tables

        TABLE 1 Global Surfactant EOR market, 2018 & 2025 (USD Million)
        TABLE 2 Global Surfactant EOR market, by Type, 2016-2026 (USD Million)
        TABLE 3 Global Surfactant EOR market, by Type, 2016-2026 (Kilo Tons)
        TABLE 4 Global Surfactant EOR market, by Application, 2016-2026 (USD Million)
        TABLE 5 Global Surfactant EOR market, by Application, 2016-2026 (Kilo Tons)
        TABLE 6 Global Surfactant EOR market, by region, 2016-2026 (USD Million)
        TABLE 7 Global Surfactant EOR market, by region, 2016-2026 (Kilo Tons)
        TABLE 8 North America Surfactant EOR Market, by Type, 2016-2026 (USD Million)
        TABLE 9 North America Surfactant EOR Market, by Type, 2016-2026 (Kilo Tons)
        TABLE 10 North America Surfactant EOR Market, by Application, 2016-2026 (USD Million)
        TABLE 11 North America Surfactant EOR Market, by Application, 2016-2026 (Kilo Tons)
        TABLE 12 Europe Surfactant EOR Market, by Type, 2016-2026 (USD Million)
        TABLE 13 Europe Surfactant EOR Market, by Type, 2016-2026 (Kilo Tons)
        TABLE 14 Europe Surfactant EOR Market, by Application, 2016-2026 (USD Million)
        TABLE 15 Europe Surfactant EOR Market, by Application, 2016-2026 (Kilo Tons)
        TABLE 16 Asia Pacific Surfactant EOR Market, by Type, 2016-2026 (USD Million)
        TABLE 17 Asia Pacific Surfactant EOR Market, by Type, 2016-2026 (Kilo Tons)
        TABLE 18 Asia Pacific Surfactant EOR Market, by Application, 2016-2026 (USD Million)
        TABLE 19 Asia Pacific Surfactant EOR Market, by Application, 2016-2026 (Kilo Tons)
        TABLE 20 Latin America Surfactant EOR Market, by Type, 2016-2026 (USD Million)
        TABLE 21 Latin America Surfactant EOR Market, by Type, 2016-2026 (Kilo Tons)
        TABLE 22 Latin America Surfactant EOR Market, by Application, 2016-2026 (USD Million)
        TABLE 23 Latin America Surfactant EOR Market, by Application, 2016-2026 (Kilo Tons)
        TABLE 24 The Middle-East and Africa Surfactant EOR Market, by Type, 2016-2026 (USD Million)
        TABLE 25 The Middle-East and Africa Surfactant EOR Market, by Type, 2016-2026 (Kilo Tons)
        TABLE 26 The Middle-East and Africa Surfactant EOR Market, by Application, 2016-2026 (USD Million)
        TABLE 27 The Middle-East and Africa Surfactant EOR Market, by Application, 2016-2026 (Kilo Tons)
        TABLE 28 North America Surfactant EOR Production, Consumption, Export, Import, 2016-2019
        TABLE 29 Europe Surfactant EOR Production, Consumption, Export, Import, 2016-2019
        TABLE 30 Asia Pacific Surfactant EOR Production, Consumption, Export, Import, 2016-2019
        TABLE 31 Latin America Surfactant EOR Production, Consumption, Export, Import, 2016-2019
        TABLE 32 Middle East & Africa Surfactant EOR Production, Consumption, Export, Import, 2016-2019
        TABLE 33 Global Surfactant EOR Market - Company Revenue Analysis 2016-2019 (USD Million)
        TABLE 34 Global Surfactant EOR Market - Company Revenue Share Analysis 2016-2019(%)
        TABLE 35 Global Surfactant EOR Market - Company Volume Analysis 2016-2019 (Kilo Tons)
        TABLE 36 Global Surfactant EOR Market - Company Volume Share Analysis 2016-2019(%)
        TABLE 37 Acquisitions and Mergers
        TABLE 38 New Product/Service Launch
        TABLE 39 Research & Development Activities
        TABLE 40 Market Drivers
        TABLE 41 Market Restraints
        TABLE 42 Market Opportunities
        TABLE 43 Production Base and Market Concentration Rate of Raw Material
        TABLE 44 Key Suppliers of Raw Materials
        TABLE 45 Raw Materials Sources of Surfactant EOR Major Manufacturers in 2016
        TABLE 46 Major Buyers of Surfactant EOR
        TABLE 47 Distributors/Traders of Surfactant EOR by Region
        

Industry Major Market Players

  • Stepan Company. Nalco Champion
  •  BASF
  •  Baker Hughes
  •  Solvay
  •  Dow Inc.
  •  Clariant
  •  Schlumberger
  •  Shell Chemicals
  •  Huntsman
  •  Halliburton
  •  Oil Chem Technologies
  •  Akzo Nobel
  •  China National Petroleum Corporation