Search Market Research Report

Discover Our Latest Reports
Discover Our Featured Reports
Discover Top Selling Reports

Structural Adhesive Market Size, Share Global Analysis Report, 2020–2026

report img

Structural Adhesive Market By Product (Acrylic, rethanes, Epoxy, Cyanoacrylic and Others (Silicone, Anaerobic, Methacrylates)), By Technology(Solvent-based, Water-based and Others), and By Application (Furniture, Transportation, Consumer Appliances, Construction and Others (Medical Devices, Industrial Machinery, and Packaging): Global Industry Outlook, Market Size, Business Intelligence, Consumer Preferences, Statistical Surveys, Comprehensive Analysis, Historical Developments, Current Trends, and Forecast 2020–2026

Industry Insights

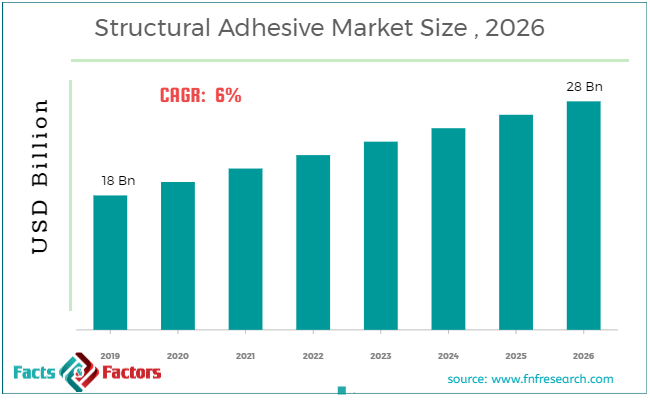
According to the report published by Facts & Factors, the global Structural Adhesive Market size was worth around USD 18 billion in 2019 and is predicted to grow around USD 28 billion by 2026 with a compound annual growth rate (CAGR) of roughly 6% between 2020 and 2026. The report analyzes the global Structural Adhesive Market drivers, restraints/challenges, and the effect they have on the demands during the projection period. In addition, the report explores emerging opportunities in the Structural Adhesive Market.

This specialized and expertise oriented industry research report scrutinizes the technical and commercial business outlook of the Structural Adhesive industry. The report analyzes and declares the historical and current trends analysis of the Structural Adhesiveindustry and subsequently recommends the projected trends anticipated to be observed in the Structural Adhesive market during the upcoming years.

The Structural Adhesive market report analyzes and notifies the industry statistics at the global as well as regional and country levels in order to acquire a thorough perspective of the entire structural Adhesive market. The historical and past insights are provided forFY 2016 to FY 2019 whereas projected trends are delivered for FY 2020 to FY 2026. The quantitative and numerical data is represented in terms of both volume (Kilo Tons) and value (USD Million) from FY 2016 – 2026.

Structural Adhesive Market Size

To know more about this report | Request Free Sample Copy

logoKey Insights from Primary Research

  • As per our primary respondents, the structural adhesive market is set to grow annually at a rate of around 6%.
  • It was established through primary research that the structural adhesive market was valued at around USD 18 billion in 2019.
  • The “Urethanes” category, on the basis of type segmentation, was the leading revenue-generating category accounting for around 50% share, in 2019.
  • On the basis of end-user segmentation, the “Transportation” category held the leading share, in 2019.
  • The Asia Pacific is a prominent revenue-generating region that accounted for around 50% of the total market in 2019.

logoKey Recommendations from Analysts

  • As per our Analysts, The stringent regulations in North America and Europe by the government authorities are limiting the growth of solvent-based adhesives. In order to keep a cope with the existing regulations, manufacturers are likely to get shifted to the water-based adhesives.
  • The major demand for the structural adhesive is expected to generate from the transportation owing to demand generated from the automotive and shipbuilding manufacturers.
  • Growing at a CAGR around 6%, the structural adhesive market offers a number of opportunities for all of the involved stakeholders across the entire value chain.
  • Our analysts have identified “Urethanes” and “Transportation” categories as the prominent investment options for a structural adhesive market in terms of type and end-user segmentation respectively.
  • The growing construction industry is projected to create demand for furniture, roofing, and flooring. These applications would need structural adhesives which will create demand for the structural adhesives.

The quantitative data is further underlined and reinforced by comprehensive qualitative data which comprises various across-the-board market dynamics. The rationales which directly or indirectly impact the Structural Adhesiveindustry are exemplified through parameters such as growth drivers, restraints, challenges, and opportunities among other impacting factors.

Throughout our research report, we have encompassed all the proven models and tools of industry analysis and extensively illustrated all the key business strategies and business models adopted in the Structural Adhesive industry. The report provides an all-inclusive and detailed competitive landscape prevalent in the Structural Adhesive market.

The report utilizes established industry analysis tools and models such as Porter’s Five Forces framework to analyze and recognize critical business strategies adopted by various stakeholders involved in the entire value chain of the Structural Adhesive industry. The Structural Adhesive market report additionally employs SWOT analysis and PESTLE analysis models for further in-depth analysis.

The report study further includes an in-depth analysis of industry players' market shares and provides an overview of leading players' market position in the Structural Adhesive sector. Key strategic developments in the Structural Adhesive market competitive landscape such as acquisitions & mergers, inaugurations of different products and services, partnerships & joint ventures, MoU agreements, VC & funding activities, R&D activities, and geographic expansion among other noteworthy activities by key players of the Structural Adhesive market are appropriately highlighted in the report.

logoReport Scope

Report Attribute

Details

Market Size in 2019

USD 18 Billion

Projected Market Size in 2026

USD 28 Billion

CAGR Growth Rate

CAGR 6%

Base Year

2019

Forecast Years

2020-2026

Key Market Players

H.B. Fuller, Ashland Inc., Sika AG, Ried BV, Illinois tool works, Henkel AG & Co., Scott Bade Company, Lord Corporation, 3M Company, and Others

Key Segment

By MechanismSegmentation, Distribution Channel, and Region

Major Regions Covered

North America, Europe, Asia Pacific, Latin America, and the Middle East &, Africa

Purchase Options

Request customized purchase options to meet your research needs. Explore purchase options

The Structural Adhesive market research report delivers an acute valuation and taxonomy of the Structural Adhesive industry by practically splitting the market on the basis of different types, applications, and regions. Through the analysis of the historical and projected trends, all the segments and sub-segments were evaluated through the bottom-up approach, and different market sizes have been projected for FY 2020 to FY 2026. The regional segmentation of the Structural Adhesive industry includes the complete classification of all the major continents including North America, Latin America, Europe, Asia Pacific, and Middle East & Africa. Further, country-wise data for the Structural Adhesive industry is provided for the leading economies of the world.

The Structural Adhesive market is segmented based on Product, Technology, and Application.  On the basis of product segmentation, the market is classified into acrylic, urethanes, epoxy, cyanoacrylic and others (silicone, anaerobic, methacrylates). According to Technology, the market is bifurcated as solvent-based, water-based and others. In terms of Application segmentation, the market is bifurcated into furniture, transportation, consumer appliances, construction and others (medical devices, industrial machinery, packaging).

logoSome of the essential players operating in the Structural Adhesive market, but not restricted to include

  • H.B. Fuller
  •  Ashland Inc.
  •  Sika AG
  •  Ried BV
  •  Illinois tool works
  • Henkel AG & Co.
  • Scott Bade Company
  • Lord Corporation
  • 3M Company

The taxonomy of the Structural Adhesive Market by its scope and segmentation is as follows:

logo By Product Segmentation Analysis (Customizable)

  • Acrylic
  • Urethanes
  • Epoxy
  • Cyanoacrylic
  • Others (Silicone, Anaerobic, Methacrylates)

logo By Technology Segmentation Analysis (Customizable)

  • Solvent-based
  • Water-based
  • Others

logo By Application Segmentation Analysis (Customizable)

  • Furniture
  • Transportation
  • Consumer Appliances
  • Construction
  • Others (Medical Devices, Industrial Machinery, Packaging)

logo Regional Segmentation Analysis (Customizable)

  • North America
    • The U.S.
    • Canada
  • Europe
    • Germany
    • The UK
    • France
    • Spain
    • Italy
    • Rest of Europe
  • Asia Pacific
    • China
    • Japan
    • India
    • South Korea
    • Southeast Asia
    • Rest of Asia Pacific
  • Latin America
    • Brazil
    • Mexico
    • Rest of Latin America
  • Middle East & Africa
    • GCC
    • South Africa
    • Rest of Middle East & Africa

Table of Content

  1. CHAPTER 1. Executive Summary
  2. CHAPTER 2. Structural Adhesive market – Product Analysis
    1. 2.1. Global Structural Adhesive Market – Product Overview
    2. 2.2. Global Structural Adhesive Market Share, by Product, 2019 & 2026 (USD Million)
    3. 2.3. Global Structural Adhesive Market share, by Product, 2019 & 2026 (Kilo Tons)
    4. 2.4. Acrylic
      1. 2.4.1. Global Acrylic Structural Adhesive Market, 2016-2026 (USD Million)
      2. 2.4.2. Global Acrylic Structural Adhesive Market, 2016-2026 (Kilo Tons)
    5. 2.5. Urethanes
      1. 2.5.1. Global Urethanes Structural Adhesive Market, 2016-2026 (USD Million)
      2. 2.5.2. Global Urethanes Structural Adhesive Market, 2016-2026 (Kilo Tons)
    6. 2.6. Epoxy
      1. 2.6.1. Global Epoxy Structural Adhesive Market, 2016-2026 (USD Million)
      2. 2.6.2. Global Epoxy Structural Adhesive Market, 2016-2026 (Kilo Tons)
    7. 2.7. Cyanoacrylic
      1. 2.7.1. Global Cyanoacrylic Structural Adhesive Market, 2016-2026 (USD Million)
      2. 2.7.2. Global Cyanoacrylic Structural Adhesive Market, 2016-2026 (Kilo Tons)
    8. 2.8. Others (Silicone, Anaerobic, Methacrylates)
      1. 2.8.1. Global Others (Silicone, Anaerobic, Methacrylates) Structural Adhesive Market, 2016-2026 (USD Million)
      2. 2.8.2. Global Others (Silicone, Anaerobic, Methacrylates) Structural Adhesive Market, 2016-2026 (Kilo Tons)
  3. CHAPTER 3. Structural Adhesive market – Technology Analysis
    1. 3.1. Global Structural Adhesive Market – Technology Overview
    2. 3.2. Global Structural Adhesive Market Share, by Technology, 2019 & 2026 (USD Million)
    3. 3.3. Global Structural Adhesive Market share, by Technology, 2019 & 2026 (Kilo Tons)
    4. 3.4. Solvent-based
      1. 3.4.1. Global Solvent-based Structural Adhesive Market, 2016-2026 (USD Million)
      2. 3.4.2. Global Solvent-based Structural Adhesive Market, 2016-2026 (Kilo Tons)
    5. 3.5. Water-based
      1. 3.5.1. Global Water-based Structural Adhesive Market, 2016-2026 (USD Million)
      2. 3.5.2. Global Water-based Structural Adhesive Market, 2016-2026 (Kilo Tons)
    6. 3.6. Others
      1. 3.6.1. Global Others Structural Adhesive Market, 2016-2026 (USD Million)
      2. 3.6.2. Global Others Structural Adhesive Market, 2016-2026 (Kilo Tons)
  4. CHAPTER 4. Structural Adhesive market – Application Analysis
    1. 4.1. Global Structural Adhesive Market – Application Overview
    2. 4.2. Global Structural Adhesive Market Share, by Application, 2019 & 2026 (USD Million)
    3. 4.3. Global Structural Adhesive Market share, by Application, 2019 & 2026 (Kilo Tons)
    4. 4.4. Furniture
      1. 4.4.1. Global Furniture Structural Adhesive Market, 2016-2026 (USD Million)
      2. 4.4.2. Global Furniture Structural Adhesive Market, 2016-2026 (Kilo Tons)
    5. 4.5. Transportation
      1. 4.5.1. Global Transportation Structural Adhesive Market, 2016-2026 (USD Million)
      2. 4.5.2. Global Transportation Structural Adhesive Market, 2016-2026 (Kilo Tons)
    6. 4.6. Consumer Appliances
      1. 4.6.1. Global Consumer Appliances Structural Adhesive Market, 2016-2026 (USD Million)
      2. 4.6.2. Global Consumer Appliances Structural Adhesive Market, 2016-2026 (Kilo Tons)
    7. 4.7. Construction
      1. 4.7.1. Global Construction Structural Adhesive Market, 2016-2026 (USD Million)
      2. 4.7.2. Global Construction Structural Adhesive Market, 2016-2026 (Kilo Tons)
    8. 4.8. Others (Medical Devices, Industrial Machinery, Packaging)
      1. 4.8.1. Global Others (Medical Devices, Industrial Machinery, Packaging) Structural Adhesive Market, 2016-2026 (USD Million)
      2. 4.8.2. Global Others (Medical Devices, Industrial Machinery, Packaging) Structural Adhesive Market, 2016-2026 (Kilo Tons)
  5. CHAPTER 5. Structural Adhesive market – Regional Analysis
    1. 5.1. Global Structural Adhesive Market Regional Overview
    2. 5.2. Global Structural Adhesive Market Share, by Region, 2019 & 2026 (Value)
    3. 5.3. Global Structural Adhesive Market Share, by Region, 2019 & 2026 (Volume)
    4. 5.4. North America
      1. 5.4.1. North America Structural Adhesive Market size and forecast, 2016-2026
      2. 5.4.2. North America Structural Adhesive Market, by Country, 2019 - 2026 (USD Million)
      3. 5.4.3. North America Market size and forecast, 2016-2026 (Kilo Tons)
      4. 5.4.4. North America Structural Adhesive Market, by Country, 2019 - 2026 (Kilo Tons)
      5. 5.4.5. North America Structural Adhesive Market, by Product, 2016-2026
      6. 5.4.6. North America Structural Adhesive Market, by Technology, 2016-2026
      7. 5.4.7. North America Structural Adhesive Market, by Application, 2016-2026
      8. 5.4.8. U.S.
      9. 5.4.9. Canada
    5. 5.5. Europe
      1. 5.5.1. Europe Structural Adhesive Market size and forecast, 2016-2026
      2. 5.5.2. Europe Structural Adhesive Market, by Country, 2019 - 2026 (USD Million)
      3. 5.5.3. Europe Market size and forecast, 2016-2026 (Kilo Tons)
      4. 5.5.4. Europe Structural Adhesive Market, by Country, 2019 - 2026 (Kilo Tons)
      5. 5.5.5. Europe Structural Adhesive Market, by Product, 2016-2026
      6. 5.5.6. Europe Structural Adhesive Market, by Technology, 2016-2026
      7. 5.5.7. Europe Structural Adhesive Market, by Application, 2016-2026
      8. 5.5.8. Germany
      9. 5.5.9. France
      10. 5.5.10. U.K.
      11. 5.5.11. Italy
      12. 5.5.12. Spain
      13. 5.5.13. Rest of Europe
    6. 5.6. Asia Pacific
      1. 5.6.1. Asia Pacific Structural Adhesive Market size and forecast, 2016-2026
      2. 5.6.2. Asia Pacific Structural Adhesive Market, by Country, 2019 - 2026 (USD Million)
      3. 5.6.3. Asia Pacific Market size and forecast, 2016-2026 (Kilo Tons)
      4. 5.6.4. Asia Pacific Structural Adhesive Market, by Country, 2019 - 2026 (Kilo Tons)
      5. 5.6.5. Asia Pacific Structural Adhesive Market, by Product, 2016-2026
      6. 5.6.6. Asia Pacific Structural Adhesive Market, by Technology, 2016-2026
      7. 5.6.7. Asia Pacific Structural Adhesive Market, by Application, 2016-2026
      8. 5.6.8. China
      9. 5.6.9. Japan
      10. 5.6.10. India
      11. 5.6.11. South Korea
      12. 5.6.12. South-East Asia
      13. 5.6.13. Rest of Asia Pacific
    7. 5.7. Latin America
      1. 5.7.1. Latin America Structural Adhesive Market size and forecast, 2016-2026
      2. 5.7.2. Latin America Structural Adhesive Market, by Country, 2019 - 2026 (USD Million)
      3. 5.7.3. Latin America Market size and forecast, 2016-2026 (Kilo Tons)
      4. 5.7.4. Latin America Structural Adhesive Market, by Country, 2019 - 2026 (Kilo Tons)
      5. 5.7.5. Latin America Structural Adhesive Market, by Product, 2016-2026
      6. 5.7.6. Latin America Structural Adhesive Market, by Technology, 2016-2026
      7. 5.7.7. Latin America Structural Adhesive Market, by Application, 2016-2026
      8. 5.7.8. Brazil
      9. 5.7.9. Mexico
      10. 5.7.10. Rest of Latin America
    8. 5.8. The Middle-East and Africa
      1. 5.8.1. The Middle-East and Africa Structural Adhesive Market size and forecast, 2016-2026
      2. 5.8.2. The Middle-East and Africa Structural Adhesive Market, by Country, 2019 - 2026 (USD Million)
      3. 5.8.3. The Middle-East and Africa Market size and forecast, 2016-2026 (Kilo Tons)
      4. 5.8.4. The Middle-East and Africa Structural Adhesive Market, by Country, 2019 - 2026 (Kilo Tons)
      5. 5.8.5. The Middle-East and Africa Structural Adhesive Market, by Product, 2016-2026
      6. 5.8.6. The Middle-East and Africa Structural Adhesive Market, by Technology, 2016-2026
      7. 5.8.7. The Middle-East and Africa Structural Adhesive Market, by Application, 2016-2026
      8. 5.8.8. GCC Countries
      9. 5.8.9. South Africa
      10. 5.8.10. Rest of Middle-East Africa
  6. CHAPTER 6. Structural Adhesive Production, Consumption, Export, Import by Regions
    1. 6.1. Global Structural Adhesive production and revenue, 2015-2025 (USD Million) (Kilo Tons)
    2. 6.2. Global Import and Export Analysis, by Region
  7. CHAPTER 7. Structural Adhesive market – Competitive Landscape
    1. 7.1. Competitor Market Share – Revenue
    2. 7.2. Market Concentration Rate Analysis, Top 3 and Top 5 Players
    3. 7.3. Competitor Market Share – Volume
    4. 7.4. Strategic Development
      1. 7.4.1. Acquisitions and Mergers
      2. 7.4.2. New Products
      3. 7.4.3. Research & Development Activities
  8. CHAPTER 8. Company Profiles
    1. 8.1. H.B. Fuller
      1. 8.1.1. Company Overview
      2. 8.1.2. H.B. Fuller Sales, Revenue, Price, and Gross Margin
      3. 8.1.3. Product portfolio
      4. 8.1.4. Recent initiatives
    2. 8.2. Ashland Inc.
      1. 8.2.1. Company Overview
      2. 8.2.2. Ashland Inc. Sales, Revenue, Price, and Gross Margin
      3. 8.2.3. Product portfolio
      4. 8.2.4. Recent initiatives
    3. 8.3. Sika AG
      1. 8.3.1. Company Overview
      2. 8.3.2. Sika AG Sales, Revenue, Price, and Gross Margin
      3. 8.3.3. Product portfolio
      4. 8.3.4. Recent initiatives
    4. 8.4. Ried BV
      1. 8.4.1. Company Overview
      2. 8.4.2. Ried BV Sales, Revenue, Price, and Gross Margin
      3. 8.4.3. Product portfolio
      4. 8.4.4. Recent initiatives
    5. 8.5. Illinois tool works
      1. 8.5.1. Company Overview
      2. 8.5.2. Illinois tool works Sales, Revenue, Price, and Gross Margin
      3. 8.5.3. Product portfolio
      4. 8.5.4. Recent initiatives
    6. 8.6. Henkel AG & Co.
      1. 8.6.1. Company Overview
      2. 8.6.2. Henkel AG & Co. Sales, Revenue, Price, and Gross Margin
      3. 8.6.3. Product portfolio
      4. 8.6.4. Recent initiatives
    7. 8.7. Scott Bade Company
      1. 8.7.1. Company Overview
      2. 8.7.2. Scott Bade Company Sales, Revenue, Price, and Gross Margin
      3. 8.7.3. Product portfolio
      4. 8.7.4. Recent initiatives
    8. 8.8. Lord Corporation
      1. 8.8.1. Company Overview
      2. 8.8.2. Lord Corporation Sales, Revenue, Price, and Gross Margin
      3. 8.8.3. Product portfolio
      4. 8.8.4. Recent initiatives
    9. 8.9. 3M Company
      1. 8.9.1. Company Overview
      2. 8.9.2. 3M Company Sales, Revenue, Price, and Gross Margin
      3. 8.9.3. Product portfolio
      4. 8.9.4. Recent initiatives
    10. 8.10. Others
      1. 8.10.1. Company Overview
      2. 8.10.2. Others Sales, Revenue, Price, and Gross Margin
      3. 8.10.3. Product portfolio
      4. 8.10.4. Recent initiatives
  9. CHAPTER 9. Structural Adhesive — Industry Analysis
    1. 9.1. Introduction and Taxonomy
    2. 9.2. Structural Adhesive Market – Key Trends
      1. 9.2.1. Market Drivers
      2. 9.2.2. Market Restraints
      3. 9.2.3. Market Opportunities
    3. 9.3. Value Chain Analysis
    4. 9.4. Key Mandates and Regulations
    5. 9.5. Technology Roadmap and Timeline
    6. 9.6. Structural Adhesive market – Attractiveness Analysis
      1. 9.6.1. By Product
      2. 9.6.2. By Technology
      3. 9.6.3. By Application
      4. 9.6.4. By Region
  10. CHAPTER 10. Raw Material analysis
    1. 10.1. Structural Adhesive Key Raw Material Analysis
      1. 10.1.1. Key Raw Materials
      2. 10.1.2. Price Trend of Key Raw Materials
    2. 10.2. Key Suppliers of Raw Materials
    3. 10.3. Proportion of Manufacturing Cost Structure
      1. 10.3.1. Raw Materials
      2. 10.3.2. Labor Cost
    4. 10.4. Manufacturing Expenses Analysis of Structural Adhesive
  11. CHAPTER 11. Industrial Chain, Sourcing Strategy and Downstream Buyers
    1. 11.1. Structural Adhesive Industrial Chain Analysis
    2. 11.2. Upstream Raw Materials Sourcing
      1. 11.2.1. Risk Mitigation:
      2. 11.2.2. Supplier Relationships:
      3. 11.2.3. Business Processes:
      4. 11.2.4. Securing the Product:
    3. 11.3. Raw Materials Sources of Structural Adhesive Major Manufacturers in 2016
    4. 11.4. Downstream Buyers
    5. 11.5. Distributors/Traders List
  12. CHAPTER 12. Marketing Strategy Analysis, Distributors
    1. 12.1. Marketing Channel
    2. 12.2. Direct Marketing
    3. 12.3. Indirect Marketing
    4. 12.4. Marketing Channel Development Trend
    5. 12.5. Economic/Political Environmental Change
  13. CHAPTER 13. Report Conclusion
  14. CHAPTER 14. Research Approach & Methodology
    1. 14.1. Report Description
    2. 14.2. Research Scope
    3. 14.3. Research Methodology
      1. 14.3.1. Secondary Research
      2. 14.3.2. Primary Research
      3. 14.3.3. Models

      List of Figures

      FIG. 1 Global Structural Adhesive Market, 2016-2026 (USD Million)
      FIG. 2 Global Structural Adhesive Market Share, by Product, 2019 & 2026 (USD Million)
      FIG. 3 Global Structural Adhesive Market share, by Product, 2019 & 2026 (Kilo Tons)
      FIG. 4 Global Acrylic Structural Adhesive Market, 2016-2026 (USD Million)
      FIG. 5 Global Acrylic Structural Adhesive  Market, 2016-2026 (Kilo Tons)
      FIG. 6 Global Urethanes Structural Adhesive Market, 2016-2026 (USD Million)
      FIG. 7 Global Urethanes Structural Adhesive  Market, 2016-2026 (Kilo Tons)
      FIG. 8 Global Epoxy Structural Adhesive Market, 2016-2026 (USD Million)
      FIG. 9 Global Epoxy Structural Adhesive  Market, 2016-2026 (Kilo Tons)
      FIG. 10 Global Cyanoacrylic Structural Adhesive Market, 2016-2026 (USD Million)
      FIG. 11 Global Cyanoacrylic Structural Adhesive  Market, 2016-2026 (Kilo Tons)
      FIG. 12 Global Others (Silicone, Anaerobic, Methacrylates) Structural Adhesive Market, 2016-2026 (USD Million)
      FIG. 13 Global Others (Silicone, Anaerobic, Methacrylates) Structural Adhesive  Market, 2016-2026 (Kilo Tons)
      FIG. 14 Global Structural Adhesive Market Share, by Technology, 2019 & 2026 (USD Million)
      FIG. 15 Global Structural Adhesive Market share, by Technology, 2019 & 2026 (Kilo Tons)
      FIG. 16 Global Solvent-based Structural Adhesive Market, 2016-2026 (USD Million)
      FIG. 17 Global Solvent-based Structural Adhesive  Market, 2016-2026 (Kilo Tons)
      FIG. 18 Global Water-based Structural Adhesive Market, 2016-2026 (USD Million)
      FIG. 19 Global Water-based Structural Adhesive  Market, 2016-2026 (Kilo Tons)
      FIG. 20 Global Others Structural Adhesive Market, 2016-2026 (USD Million)
      FIG. 21 Global Others Structural Adhesive  Market, 2016-2026 (Kilo Tons)
      FIG. 22 Global Structural Adhesive Market Share, by Application, 2019 & 2026 (USD Million)
      FIG. 23 Global Structural Adhesive Market share, by Application, 2019 & 2026 (Kilo Tons)
      FIG. 24 Global Furniture Structural Adhesive Market, 2016-2026 (USD Million)
      FIG. 25 Global Furniture Structural Adhesive  Market, 2016-2026 (Kilo Tons)
      FIG. 26 Global Transportation Structural Adhesive Market, 2016-2026 (USD Million)
      FIG. 27 Global Transportation Structural Adhesive  Market, 2016-2026 (Kilo Tons)
      FIG. 28 Global Consumer Appliances Structural Adhesive Market, 2016-2026 (USD Million)
      FIG. 29 Global Consumer Appliances Structural Adhesive  Market, 2016-2026 (Kilo Tons)
      FIG. 30 Global Construction Structural Adhesive Market, 2016-2026 (USD Million)
      FIG. 31 Global Construction Structural Adhesive  Market, 2016-2026 (Kilo Tons)
      FIG. 32 Global Others (Medical Devices, Industrial Machinery, Packaging) Structural Adhesive Market, 2016-2026 (USD Million)
      FIG. 33 Global Others (Medical Devices, Industrial Machinery, Packaging) Structural Adhesive  Market, 2016-2026 (Kilo Tons)
      FIG. 34 Global Structural Adhesive Market Share, by Region, 2019 & 2026
      FIG. 35 Global Structural Adhesive Market Share, by Region, 2019 & 2026
      FIG. 36 North America Structural Adhesive Market, 2016-2026
      FIG. 37 North America Structural Adhesive  Market, 2016-2026 (Kilo Tons)
      FIG. 38 U.S. Structural Adhesive Market, 2016-2026
      FIG. 39 U.S. Structural Adhesive  Market, 2016-2026 (Kilo Tons)
      FIG. 40 Canada Structural Adhesive Market, 2016-2026
      FIG. 41 Canada Structural Adhesive  Market, 2016-2026 (Kilo Tons)
      FIG. 42 Europe Structural Adhesive Market, 2016-2026
      FIG. 43 Europe Structural Adhesive  Market, 2016-2026 (Kilo Tons)
      FIG. 44 Germany Structural Adhesive Market, 2016-2026
      FIG. 45 Germany Structural Adhesive  Market, 2016-2026 (Kilo Tons)
      FIG. 46 France Structural Adhesive Market, 2016-2026
      FIG. 47 France Structural Adhesive  Market, 2016-2026 (Kilo Tons)
      FIG. 48 U.K. Structural Adhesive Market, 2016-2026
      FIG. 49 U.K. Structural Adhesive  Market, 2016-2026 (Kilo Tons)
      FIG. 50 Italy Structural Adhesive Market, 2016-2026
      FIG. 51 Italy Structural Adhesive  Market, 2016-2026 (Kilo Tons)
      FIG. 52 Spain Structural Adhesive Market, 2016-2026
      FIG. 53 Spain Structural Adhesive  Market, 2016-2026 (Kilo Tons)
      FIG. 54 Rest of Europe Structural Adhesive Market, 2016-2026
      FIG. 55 Rest of Europe Structural Adhesive  Market, 2016-2026 (Kilo Tons)
      FIG. 56 Asia Pacific Structural Adhesive Market, 2016-2026
      FIG. 57 Asia Pacific Structural Adhesive  Market, 2016-2026 (Kilo Tons)
      FIG. 58 China Structural Adhesive Market, 2016-2026
      FIG. 59 China Structural Adhesive  Market, 2016-2026 (Kilo Tons)
      FIG. 60 Japan Structural Adhesive Market, 2016-2026
      FIG. 61 Japan Structural Adhesive  Market, 2016-2026 (Kilo Tons)
      FIG. 62 India Structural Adhesive Market, 2016-2026
      FIG. 63 India Structural Adhesive  Market, 2016-2026 (Kilo Tons)
      FIG. 64 South  Korea Structural Adhesive Market, 2016-2026
      FIG. 65 South  Korea Structural Adhesive  Market, 2016-2026 (Kilo Tons)
      FIG. 66 South-East Asia Structural Adhesive Market, 2016-2026
      FIG. 67 South-East Asia Structural Adhesive  Market, 2016-2026 (Kilo Tons)
      FIG. 68 Rest of Asia Pacific Structural Adhesive Market, 2016-2026
      FIG. 69 Rest of Asia Pacific Structural Adhesive  Market, 2016-2026 (Kilo Tons)
      FIG. 70 Latin America Structural Adhesive Market, 2016-2026
      FIG. 71 Latin America Structural Adhesive  Market, 2016-2026 (Kilo Tons)
      FIG. 72 Brazil Structural Adhesive Market, 2016-2026
      FIG. 73 Brazil Structural Adhesive  Market, 2016-2026 (Kilo Tons)
      FIG. 74 Mexico Structural Adhesive Market, 2016-2026
      FIG. 75 Mexico Structural Adhesive  Market, 2016-2026 (Kilo Tons)
      FIG. 76 Rest of Latin America Structural Adhesive Market, 2016-2026
      FIG. 77 Rest of Latin America Structural Adhesive  Market, 2016-2026 (Kilo Tons)
      FIG. 78 The Middle-East and Africa Structural Adhesive Market, 2016-2026
      FIG. 79 The Middle-East and Africa Structural Adhesive  Market, 2016-2026 (Kilo Tons)
      FIG. 80 GCC Countries Structural Adhesive Market, 2016-2026
      FIG. 81 GCC Countries Structural Adhesive  Market, 2016-2026 (Kilo Tons)
      FIG. 82 South Africa Structural Adhesive Market, 2016-2026
      FIG. 83 South Africa Structural Adhesive  Market, 2016-2026 (Kilo Tons)
      FIG. 84 Rest of Middle-East Africa Structural Adhesive Market, 2016-2026
      FIG. 85 Rest of Middle-East Africa Structural Adhesive  Market, 2016-2026 (Kilo Tons)
      FIG. 86 Global Structural Adhesive production and revenue, 2015-2025 (USD Million) (Kilo Tons)
      FIG. 87 North America Structural Adhesive production and revenue, 2015-2025 (USD Million) (Kilo Tons)
      FIG. 88 Europe Structural Adhesive production and revenue, 2015-2025 (USD Million) (Kilo Tons)
      FIG. 89 Asia Pacific Structural Adhesive production and revenue, 2015-2025 (USD Million) (Kilo Tons)
      FIG. 90 Latin America Structural Adhesive production and revenue, 2015-2025 (USD Million) (Kilo Tons)
      FIG. 91 Middle East and Africa Structural Adhesive production and revenue, 2015-2025 (USD Million) (Kilo Tons)
      FIG. 92 Competitor Market Share – Revenue
      FIG. 93 Competitor Market Share – Volume
      FIG. 94 H.B. Fuller Revenue and Growth Rate
      FIG. 95 H.B. Fuller Market Share
      FIG. 96 Ashland Inc. Revenue and Growth Rate
      FIG. 97 Ashland Inc. Market Share
      FIG. 98 Sika AG Revenue and Growth Rate
      FIG. 99 Sika AG Market Share
      FIG. 100 Ried BV Revenue and Growth Rate
      FIG. 101 Ried BV Market Share
      FIG. 102 Illinois tool works Revenue and Growth Rate
      FIG. 103 Illinois tool works Market Share
      FIG. 104 Henkel AG & Co. Revenue and Growth Rate
      FIG. 105 Henkel AG & Co. Market Share
      FIG. 106 Scott Bade Company Revenue and Growth Rate
      FIG. 107 Scott Bade Company Market Share
      FIG. 108 Lord Corporation Revenue and Growth Rate
      FIG. 109 Lord Corporation Market Share
      FIG. 110 3M Company Revenue and Growth Rate
      FIG. 111 3M Company Market Share
      FIG. 112 Others Revenue and Growth Rate
      FIG. 113 Others Market Share
      FIG. 114 Market Dynamics
      FIG. 115 Global Structural Adhesive – Value Chain Analysis
      FIG. 116 Key Mandates and Regulations
      FIG. 117 Technology Roadmap and Timeline
      FIG. 118 Market Attractiveness Analysis – By Product
      FIG. 119 Market Attractiveness Analysis – By Technology
      FIG. 120 Market Attractiveness Analysis – By Application
      FIG. 121 Market Attractiveness Analysis – By Region
      FIG. 122 Manufacturing Cost Structure of Structural Adhesive
      FIG. 123 Structural Adhesive Industrial Chain Analysis
      FIG. 124 Market Channel
      FIG. 125 Marketing Channel Development Trend
      FIG. 126 Growth in World Gross Product, 2008-2018

      List of Tables

      TABLE 1 Global Structural Adhesive market, 2019 & 2026 (USD Million)
      TABLE 2 Global Structural Adhesive Market, by Product, 2016-2026 (USD Million)
      TABLE 3 Global Structural Adhesive Market, by Product, 2016-2026 (Kilo Tons)
      TABLE 4 Global Structural Adhesive Market, by Technology, 2016-2026 (USD Million)
      TABLE 5 Global Structural Adhesive Market, by Technology, 2016-2026 (Kilo Tons)
      TABLE 6 Global Structural Adhesive Market, by Application, 2016-2026 (USD Million)
      TABLE 7 Global Structural Adhesive Market, by Application, 2016-2026 (Kilo Tons)
      TABLE 8 Global Structural Adhesive market, by region, 2016-2026 (USD Million)
      TABLE 9 Global Structural Adhesive market, by region, 2016-2026 (Kilo Tons)
      TABLE 10 North America Structural Adhesive Market, by Product, 2016-2026 (USD Million)
      TABLE 11 North America Structural Adhesive Market, by Product, 2016-2026 (Kilo Tons)
      TABLE 12 North America Structural Adhesive Market, by Technology, 2016-2026 (USD Million)
      TABLE 13 North America Structural Adhesive Market, by Technology, 2016-2026 (Kilo Tons)
      TABLE 14 North America Structural Adhesive Market, by Application, 2016-2026 (USD Million)
      TABLE 15 North America Structural Adhesive Market, by Application, 2016-2026 (Kilo Tons)
      TABLE 16 Europe Structural Adhesive Market, by Product, 2016-2026 (USD Million)
      TABLE 17 Europe Structural Adhesive Market, by Product, 2016-2026 (Kilo Tons)
      TABLE 18 Europe Structural Adhesive Market, by Technology, 2016-2026 (USD Million)
      TABLE 19 Europe Structural Adhesive Market, by Technology, 2016-2026 (Kilo Tons)
      TABLE 20 Europe Structural Adhesive Market, by Application, 2016-2026 (USD Million)
      TABLE 21 Europe Structural Adhesive Market, by Application, 2016-2026 (Kilo Tons)
      TABLE 22 Asia Pacific Structural Adhesive Market, by Product, 2016-2026 (USD Million)
      TABLE 23 Asia Pacific Structural Adhesive Market, by Product, 2016-2026 (Kilo Tons)
      TABLE 24 Asia Pacific Structural Adhesive Market, by Technology, 2016-2026 (USD Million)
      TABLE 25 Asia Pacific Structural Adhesive Market, by Technology, 2016-2026 (Kilo Tons)
      TABLE 26 Asia Pacific Structural Adhesive Market, by Application, 2016-2026 (USD Million)
      TABLE 27 Asia Pacific Structural Adhesive Market, by Application, 2016-2026 (Kilo Tons)
      TABLE 28 Latin America Structural Adhesive Market, by Product, 2016-2026 (USD Million)
      TABLE 29 Latin America Structural Adhesive Market, by Product, 2016-2026 (Kilo Tons)
      TABLE 30 Latin America Structural Adhesive Market, by Technology, 2016-2026 (USD Million)
      TABLE 31 Latin America Structural Adhesive Market, by Technology, 2016-2026 (Kilo Tons)
      TABLE 32 Latin America Structural Adhesive Market, by Application, 2016-2026 (USD Million)
      TABLE 33 Latin America Structural Adhesive Market, by Application, 2016-2026 (Kilo Tons)
      TABLE 34 The Middle-East and Africa Structural Adhesive Market, by Product, 2016-2026 (USD Million)
      TABLE 35 The Middle-East and Africa Structural Adhesive Market, by Product, 2016-2026 (Kilo Tons)
      TABLE 36 The Middle-East and Africa Structural Adhesive Market, by Technology, 2016-2026 (USD Million)
      TABLE 37 The Middle-East and Africa Structural Adhesive Market, by Technology, 2016-2026 (Kilo Tons)
      TABLE 38 The Middle-East and Africa Structural Adhesive Market, by Application, 2016-2026 (USD Million)
      TABLE 39 The Middle-East and Africa Structural Adhesive Market, by Application, 2016-2026 (Kilo Tons)
      TABLE 40 North America Structural Adhesive Production, Consumption, Export, Import, 2016-2019
      TABLE 41 Europe Structural Adhesive Production, Consumption, Export, Import, 2016-2019
      TABLE 42 Asia Pacific Structural Adhesive Production, Consumption, Export, Import, 2016-2019
      TABLE 43 Latin America Structural Adhesive Production, Consumption, Export, Import, 2016-2019
      TABLE 44 Middle East & Africa Structural Adhesive Production, Consumption, Export, Import, 2016-2019
      TABLE 45 Global Structural Adhesive Market - Company Revenue Analysis 2016-2019 (USD Million)
      TABLE 46 Global Structural Adhesive Market - Company Revenue Share Analysis 2016-2019(%)
      TABLE 47 Global Structural Adhesive Market - Company Volume Analysis 2016-2019 (Kilo Tons)
      TABLE 48 Global Structural Adhesive Market - Company Volume Share Analysis 2016-2019(%)
      TABLE 49 Acquisitions and Mergers
      TABLE 50 New Product/Service Launch
      TABLE 51 Research & Development Activities
      TABLE 52 Market Drivers
      TABLE 53 Market Restraints
      TABLE 54 Market Opportunities
      TABLE 55 Production Base and Market Concentration Rate of Raw Material
      TABLE 56 Key Suppliers of Raw Materials
      TABLE 57 Raw Materials Sources of Structural Adhesive Major Manufacturers in 2016
      TABLE 58 Major Buyers of Structural Adhesive
      TABLE 59 Distributors/Traders of Structural Adhesive by Region

Industry Major Market Players

  • H.B. Fuller
  •  Ashland Inc.
  •  Sika AG
  •  Ried BV
  •  Illinois tool works
  • Henkel AG & Co.
  • Scott Bade Company
  • Lord Corporation
  • 3M Company