Search Market Research Report

Discover Our Latest Reports
Discover Our Featured Reports
Discover Top Selling Reports

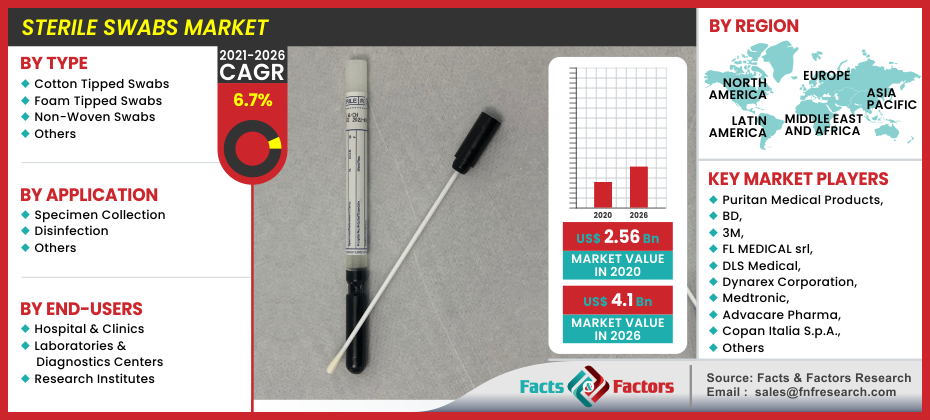
Sterile Swabs Market Size, Share Global Analysis Report, , 2021 – 2026

report img

Sterile Swabs Market By Type (Cotton Tipped Swabs, Foam Tipped Swabs, Non-Woven Swabs, & Others), By Application (Specimen Collection, Disinfection, & Others), By End-Users (Hospital & Clinics, Laboratories & Diagnostics Centers, & Research Institutes), And By Regions - Global And Regional Industry Perspective, Comprehensive Analysis, and Forecast, 2021 – 2026

Industry Insights

[197+ Pages Report] The latest finding for the “Sterile Swabs Market” has been encompassed in the latest study published on facts and factors. We estimate that the global sterile swabs market will grow at a steady CAGR growth of 6.7% and will project a value of USD 4.1 Billion in the year 2026 from a previous value of USD 2.56 Billion in the year 2020.

logoMarket Overview

Sterile swabs are a medical accessory that is present in the form of a small stick with sterile cotton present at the end. Its most common application is absorption of bodily fluids during surgical procedures, collect specimens, or application of medical substances while cleaning a wound. Sterile swabs help in maintaining minimum contact with the patient while giving the patient access to superior medical care. Furthermore, the latest iteration of sterile swabs has a re-sealable sterile container that maintains the integrity and purity of the sample collected during travel conditions.

logoIndustry Growth Factors

The market of sterile swabs has gained significant traction over the last year owing to the advent of the global pandemic which has added a large chunk of market value to the latter. The pandemic has led to an increase in volume of sales of sterile swabs over the forecast alongside surgical masks and other diagnostics products. Additionally, an increase in sales has led to better production techniques and improvements in the quality and functionality of sterile swabs which proportionally leads to a further increase in sales.

Rise in infectious diseases among the rising geriatric population is a major driving factor for the growth of the sterile swabs market during the forecast. Rise of rapid testing services due to an increase in COVID-19 cases and other conjoining diseases will further open new opportunities for the sterile swab market to expand during the forecast timeframe. Government bodies across the world focusing a low portion of their GDP on healthcare expenditure can hamper the growth of the sterile swab market during the forecast to a certain extent.

Sterile Swabs Market

To know more about this report | Request Free Sample Copy

logoSegmentation Analysis

The global sterile swab market can be segmented on the basis of type, application, end-users, and regions.

On the basis of type, the global sterile swab market can be divided on the basis of cotton-tipped swab, foam tipped swab, non-woven swab, and others. The cotton tipped swab is expected to witness the largest market share during the forecast period due to contributing factors such as user-friendly functionality and easy disposable options. Foam tipped swabs and non-woven swabs will also post significant market share during the forecast due to similar factors. On the basis of application, the global sterile swabs market can be bifurcated into specimen collection, disinfection, and others. The segment of specimen collection will recoup the largest market share during the advent of the forecast owing to a rise of rapid testing protocols for the detection of COVID-19 cases and other similar diseases. However, the segment of disinfection is projected to grow with the fastest growing CAGR owing to the rise of surgeries in hospitals and other similar medical facilities. On the basis of end-users, the global sterile swabs market can be broken down into hospital & clinics, laboratories & diagnostics centers, and research institutes. The hospitals & clinics segment will account for the larger market share during the forecast period due to increase of medical requirements arising from COVID-19 complications and other range of infectious disorders.

logo Regional Analysis

North America is expected to witness the largest market share during the forecast period due to a number of contributing factors such as rising prevalence of infectious diseases in the region. North America recorded the highest number of COVID cases at the peak of its infancy which ultimately led to a surge of diagnostic kits and sterile swabs proportionately. Other factors for the massive market footprint in the region can be credited to rise in consumer awareness about infectious diseases and increased government support in the form of monetary measures. On the other hand, Asia-Pacific is expected to occupy a significant portion of the market during the forecast due to hugely populous countries such as China and India alongside the presence of key players in the region.

logoReport Scope

Report Attribute

Details

Market Size in 2020

USD 2.56 billion

Projected Market Size in 2026

USD 4.1 billion

CAGR Growth Rate

6.7% CAGR

Base Year

2019

Forecast Years

2020-2026

Key Market Players

Puritan Medical Products, BD, 3M, FL MEDICAL Srl, DLS Medical, Dynarex Corporation, Medtronic, Advacare Pharma, Copan Italia S.p.A., Lynn Medical, Super Brush LLC, Biosigma S.p. A, and Medical Wire and Equipment Co Ltd (MWE), among others., and others.

Key Segment

By Type, Application, End-Users , and Region

Major Regions Covered

North America, Europe, Asia Pacific, Latin America, and the Middle East &, Africa

Purchase Options

Request customized purchase options to meet your research needs. Explore purchase options

logo Competitive Players

The key participants in the global sterile swabs market are

  • Puritan Medical Products
  • BD
  • 3M
  • FL MEDICAL srl
  • DLS Medical
  • Dynarex Corporation
  • Medtronic
  • Advacare Pharma
  • Copan Italia S.p.A.
  • Lynn Medical
  • Super Brush LLC
  • Biosigma S.p.A
  • Medical Wire and Equipment Co Ltd (MWE)

logo By Type Segment Analysis

  • Cotton Tipped Swabs
  • Foam Tipped Swabs
  • Non-Woven Swabs
  • Others

logo By Application Segment Analysis

  • Specimen Collection
  • Disinfection
  • Others

logo By End-Users Segment Analysis

  • Hospital & Clinics
  • Laboratories & Diagnostics Centers
  • Research Institutes

logo By Regional Segment Analysis

  • North America
  • U.S.
  • Canada
  • Europe
  • UK
  • France
  • Germany
  • Italy
  • Spain
  • Rest of Europe
  • Asia Pacific
  • China
  • Japan
  • India
  • South Korea
  • Southeast Asia
  • Rest of Asia Pacific
  • Latin America
  • Brazil
  • Mexico
  • Rest of Latin America
  • Middle East and Africa
  • GCC Countries
  • South Africa
  • Rest of MEA

Table of Content

  1. Chapter 1 Executive Summary
    1. 1.1. Introduction of Sterile Swabs
    2. 1.2. Global Sterile Swabs Market, 2020 & 2026 (USD Billion)
    3. 1.3. Global Sterile Swabs Market, 2016 – 2026 (USD Billion)
    4. 1.4. Global Sterile Swabs Market Absolute Revenue Opportunity, 2016 – 2026 (USD Billion)
    5. 1.5. Global Sterile Swabs Market Incremental Revenue Opportunity, 2020 – 2026 (USD Billion)
  2. Chapter 2 Sterile Swabs Market – Type Analysis
    1. 2.1. Global Sterile Swabs Market – Type Overview
    2. 2.2. Global Sterile Swabs Market Share, by Type, 2020 & 2026 (USD Billion)
    3. 2.3. Cotton Tipped Swabs
      1. 2.3.1. Global Cotton Tipped Swabs Sterile Swabs Market, 2016 – 2026 (USD Billion)
    4. 2.4. Foam Tipped Swabs
      1. 2.4.1. Global Foam Tipped Swabs Sterile Swabs Market, 2016 – 2026 (USD Billion)
    5. 2.5. Non-Woven Swabs
      1. 2.5.1. Global Non-Woven Swabs Sterile Swabs Market, 2016 – 2026 (USD Billion)
    6. 2.6. Others
      1. 2.6.1. Global Others Sterile Swabs Market, 2016 – 2026 (USD Billion)
  3. Chapter 3 Sterile Swabs Market – Application Analysis
    1. 3.1. Global Sterile Swabs Market – Application Overview
    2. 3.2. Global Sterile Swabs Market Share, by Application, 2020 & 2026 (USD Billion)
    3. 3.3. Specimen Collection
      1. 3.3.1. Global Specimen Collection Sterile Swabs Market, 2016 – 2026 (USD Billion)
    4. 3.4. Disinfection
      1. 3.4.1. Global Disinfection Sterile Swabs Market, 2016 – 2026 (USD Billion)
    5. 3.5. Disinfection
      1. 3.5.1. Global Disinfection Sterile Swabs Market, 2016 – 2026 (USD Billion)
    6. 3.6. Others
      1. 3.6.1. Global Others Sterile Swabs Market, 2016 – 2026 (USD Billion)
  4. Chapter 4 Sterile Swabs Market – End-Users Analysis
    1. 4.1. Global Sterile Swabs Market – End-Users Overview
    2. 4.2. Global Sterile Swabs Market Share, by End-Users, 2020 & 2026 (USD Billion)
    3. 4.3. Hospital & Clinics
      1. 4.3.1. Global Hospital & Clinics Sterile Swabs Market, 2016 – 2026 (USD Billion)
    4. 4.4. Laboratories & Diagnostics Centers
      1. 4.4.1. Global Laboratories & Diagnostics Centers Sterile Swabs Market, 2016 – 2026 (USD Billion)
    5. 4.5. Research Institutes
      1. 4.5.1. Global Research Institutes Sterile Swabs Market, 2016 – 2026 (USD Billion)
  5. Chapter 5 Sterile Swabs Market – Regional Analysis
    1. 5.1. Global Sterile Swabs Market Regional Overview
    2. 5.2. Global Sterile Swabs Market Share, by Region, 2020 & 2026 (USD Billion)
    3. 5.3. North America
      1. 5.3.1. North America Sterile Swabs Market, 2016 – 2026 (USD Billion)
        1. 5.3.1.1. North America Sterile Swabs Market, by Country, 2016 - 2026 (USD Billion)
      2. 5.3.2. North America Sterile Swabs Market, by Type, 2016 – 2026
        1. 5.3.2.1. North America Sterile Swabs Market, by Type, 2016 – 2026 (USD Billion)
      3. 5.3.3. North America Sterile Swabs Market, by Application, 2016 – 2026
        1. 5.3.3.1. North America Sterile Swabs Market, by Application, 2016 – 2026 (USD Billion)
      4. 5.3.4. North America Sterile Swabs Market, by End-Users, 2016 – 2026
        1. 5.3.4.1. North America Sterile Swabs Market, by End-Users, 2016 – 2026 (USD Billion)
      5. 5.3.5. U.S.
        1. 5.3.5.1. U.S. Sterile Swabs Market, 2016 – 2026 (USD Billion)
      6. 5.3.6. Canada
        1. 5.3.6.1. Canada Sterile Swabs Market, 2016 – 2026 (USD Billion)
    4. 5.4. Europe
      1. 5.4.1. Europe Sterile Swabs Market, 2016 – 2026 (USD Billion)
        1. 5.4.1.1. Europe Sterile Swabs Market, by Country, 2016 - 2026 (USD Billion)
      2. 5.4.2. Europe Sterile Swabs Market, by Type, 2016 – 2026
        1. 5.4.2.1. Europe Sterile Swabs Market, by Type, 2016 – 2026 (USD Billion)
      3. 5.4.3. Europe Sterile Swabs Market, by Application, 2016 – 2026
        1. 5.4.3.1. Europe Sterile Swabs Market, by Application, 2016 – 2026 (USD Billion)
      4. 5.4.4. Europe Sterile Swabs Market, by End-Users, 2016 – 2026
        1. 5.4.4.1. Europe Sterile Swabs Market, by End-Users, 2016 – 2026 (USD Billion)
      5. 5.4.5. Germany
        1. 5.4.5.1. Germany Sterile Swabs Market, 2016 – 2026 (USD Billion)
      6. 5.4.6. France
        1. 5.4.6.1. France Sterile Swabs Market, 2016 – 2026 (USD Billion)
      7. 5.4.7. U.K.
        1. 5.4.7.1. U.K. Sterile Swabs Market, 2016 – 2026 (USD Billion)
      8. 5.4.8. Italy
        1. 5.4.8.1. Italy Sterile Swabs Market, 2016 – 2026 (USD Billion)
      9. 5.4.9. Spain
        1. 5.4.9.1. Spain Sterile Swabs Market, 2016 – 2026 (USD Billion)
      10. 5.4.10. Rest of Europe
        1. 5.4.10.1. Rest of Europe Sterile Swabs Market, 2016 – 2026 (USD Billion)
    5. 5.5. Asia Pacific
      1. 5.5.1. Asia Pacific Sterile Swabs Market, 2016 – 2026 (USD Billion)
        1. 5.5.1.1. Asia Pacific Sterile Swabs Market, by Country, 2016 - 2026 (USD Billion)
      2. 5.5.2. Asia Pacific Sterile Swabs Market, by Type, 2016 – 2026
        1. 5.5.2.1. Asia Pacific Sterile Swabs Market, by Type, 2016 – 2026 (USD Billion)
      3. 5.5.3. Asia Pacific Sterile Swabs Market, by Application, 2016 – 2026
        1. 5.5.3.1. Asia Pacific Sterile Swabs Market, by Application, 2016 – 2026 (USD Billion)
      4. 5.5.4. Asia Pacific Sterile Swabs Market, by End-Users, 2016 – 2026
        1. 5.5.4.1. Asia Pacific Sterile Swabs Market, by End-Users, 2016 – 2026 (USD Billion)
      5. 5.5.5. China
        1. 5.5.5.1. China Sterile Swabs Market, 2016 – 2026 (USD Billion)
      6. 5.5.6. Japan
        1. 5.5.6.1. Japan Sterile Swabs Market, 2016 – 2026 (USD Billion)
      7. 5.5.7. India
        1. 5.5.7.1. India Sterile Swabs Market, 2016 – 2026 (USD Billion)
      8. 5.5.8. South Korea
        1. 5.5.8.1. South Korea Sterile Swabs Market, 2016 – 2026 (USD Billion)
      9. 5.5.9. South-East Asia
        1. 5.5.9.1. South-East Asia Sterile Swabs Market, 2016 – 2026 (USD Billion)
      10. 5.5.10. Rest of Asia Pacific
        1. 5.5.10.1. Rest of Asia Pacific Sterile Swabs Market, 2016 – 2026 (USD Billion)
    6. 5.6. Latin America
      1. 5.6.1. Latin America Sterile Swabs Market, 2016 – 2026 (USD Billion)
        1. 5.6.1.1. Latin America Sterile Swabs Market, by Country, 2016 - 2026 (USD Billion)
      2. 5.6.2. Latin America Sterile Swabs Market, by Type, 2016 – 2026
        1. 5.6.2.1. Latin America Sterile Swabs Market, by Type, 2016 – 2026 (USD Billion)
      3. 5.6.3. Latin America Sterile Swabs Market, by Application, 2016 – 2026
        1. 5.6.3.1. Latin America Sterile Swabs Market, by Application, 2016 – 2026 (USD Billion)
      4. 5.6.4. Latin America Sterile Swabs Market, by End-Users, 2016 – 2026
        1. 5.6.4.1. Latin America Sterile Swabs Market, by End-Users, 2016 – 2026 (USD Billion)
      5. 5.6.5. Brazil
        1. 5.6.5.1. Brazil Sterile Swabs Market, 2016 – 2026 (USD Billion)
      6. 5.6.6. Mexico
        1. 5.6.6.1. Mexico Sterile Swabs Market, 2016 – 2026 (USD Billion)
      7. 5.6.7. Rest of Latin America
        1. 5.6.7.1. Rest of Latin America Sterile Swabs Market, 2016 – 2026 (USD Billion)
    7. 5.7. The Middle-East and Africa
      1. 5.7.1. The Middle-East and Africa Sterile Swabs Market, 2016 – 2026 (USD Billion)
        1. 5.7.1.1. The Middle-East and Africa Sterile Swabs Market, by Country, 2016 - 2026 (USD Billion)
      2. 5.7.2. The Middle-East and Africa Sterile Swabs Market, by Type, 2016 – 2026
        1. 5.7.2.1. The Middle-East and Africa Sterile Swabs Market, by Type, 2016 – 2026 (USD Billion)
      3. 5.7.3. The Middle-East and Africa Sterile Swabs Market, by Application, 2016 – 2026
        1. 5.7.3.1. The Middle-East and Africa Sterile Swabs Market, by Application, 2016 – 2026 (USD Billion)
      4. 5.7.4. The Middle-East and Africa Sterile Swabs Market, by End-Users, 2016 – 2026
        1. 5.7.4.1. The Middle-East and Africa Sterile Swabs Market, by End-Users, 2016 – 2026 (USD Billion)
      5. 5.7.5. GCC Countries
        1. 5.7.5.1. GCC Countries Sterile Swabs Market, 2016 – 2026 (USD Billion)
      6. 5.7.6. South Africa
        1. 5.7.6.1. South Africa Sterile Swabs Market, 2016 – 2026 (USD Billion)
      7. 5.7.7. Rest of Middle-East Africa
        1. 5.7.7.1. Rest of Middle-East Africa Sterile Swabs Market, 2016 – 2026 (USD Billion)
  6. Chapter 6 Sterile Swabs Market – Competitive Landscape
    1. 6.1. Competitor Market Share – Revenue
    2. 6.2. Market Concentration Rate Analysis, Top 3 and Top 5 Players
    3. 6.3. Strategic Developments
      1. 6.3.1. Acquisitions and Mergers
      2. 6.3.2. New Products
      3. 6.3.3. Research & Development Activities
  7. Chapter 7 Company Profiles
    1. 7.1. Puritan Medical Products
      1. 7.1.1. Company Overview
      2. 7.1.2. Product/Service Portfolio
      3. 7.1.3. Puritan Medical Products Sales, Revenue, and Gross Margin
      4. 7.1.4. Puritan Medical Products Revenue and Growth Rate
      5. 7.1.5. Puritan Medical Products Market Share
      6. 7.1.6. Recent Initiatives, Funding/VC Activities, and Technological Innovations
    2. 7.2. BD
      1. 7.2.1. Company Overview
      2. 7.2.2. Product/Service Portfolio
      3. 7.2.3. BD Sales, Revenue, and Gross Margin
      4. 7.2.4. BD Revenue and Growth Rate
      5. 7.2.5. BD Market Share
      6. 7.2.6. Recent Initiatives, Funding/VC Activities, and Technological Innovations
    3. 7.3. 3M
      1. 7.3.1. Company Overview
      2. 7.3.2. Product/Service Portfolio
      3. 7.3.3. 3M Sales, Revenue, and Gross Margin
      4. 7.3.4. 3M Revenue and Growth Rate
      5. 7.3.5. 3M Market Share
      6. 7.3.6. Recent Initiatives, Funding/VC Activities, and Technological Innovations
    4. 7.4. FL MEDICAL srl
      1. 7.4.1. Company Overview
      2. 7.4.2. Product/Service Portfolio
      3. 7.4.3. FL MEDICAL srl Sales, Revenue, and Gross Margin
      4. 7.4.4. FL MEDICAL srl Revenue and Growth Rate
      5. 7.4.5. FL MEDICAL srl Market Share
      6. 7.4.6. Recent Initiatives, Funding/VC Activities, and Technological Innovations
    5. 7.5. DLS Medical
      1. 7.5.1. Company Overview
      2. 7.5.2. Product/Service Portfolio
      3. 7.5.3. DLS Medical Sales, Revenue, and Gross Margin
      4. 7.5.4. DLS Medical Revenue and Growth Rate
      5. 7.5.5. DLS Medical Market Share
      6. 7.5.6. Recent Initiatives, Funding/VC Activities, and Technological Innovations
    6. 7.6. Dynarex Corporation
      1. 7.6.1. Company Overview
      2. 7.6.2. Product/Service Portfolio
      3. 7.6.3. Dynarex Corporation Sales, Revenue, and Gross Margin
      4. 7.6.4. Dynarex Corporation Revenue and Growth Rate
      5. 7.6.5. Dynarex Corporation Market Share
      6. 7.6.6. Recent Initiatives, Funding/VC Activities, and Technological Innovations
    7. 7.7. Medtronic
      1. 7.7.1. Company Overview
      2. 7.7.2. Product/Service Portfolio
      3. 7.7.3. Medtronic Sales, Revenue, and Gross Margin
      4. 7.7.4. Medtronic Revenue and Growth Rate
      5. 7.7.5. Medtronic Market Share
      6. 7.7.6. Recent Initiatives, Funding/VC Activities, and Technological Innovations
    8. 7.8. Advacare Pharma
      1. 7.8.1. Company Overview
      2. 7.8.2. Product/Service Portfolio
      3. 7.8.3. Advacare Pharma Sales, Revenue, and Gross Margin
      4. 7.8.4. Advacare Pharma Revenue and Growth Rate
      5. 7.8.5. Advacare Pharma Market Share
      6. 7.8.6. Recent Initiatives, Funding/VC Activities, and Technological Innovations
    9. 7.9. Copan Italia S.p.A.
      1. 7.9.1. Company Overview
      2. 7.9.2. Product/Service Portfolio
      3. 7.9.3. Copan Italia S.p.A. Sales, Revenue, and Gross Margin
      4. 7.9.4. Copan Italia S.p.A. Revenue and Growth Rate
      5. 7.9.5. Copan Italia S.p.A. Market Share
      6. 7.9.6. Recent Initiatives, Funding/VC Activities, and Technological Innovations
    10. 7.10. Lynn Medical Products
      1. 7.10.1. Company Overview
      2. 7.10.2. Product/Service Portfolio
      3. 7.10.3. Lynn Medical Products Sales, Revenue, and Gross Margin
      4. 7.10.4. Lynn Medical Products Revenue and Growth Rate
      5. 7.10.5. Lynn Medical Products Market Share
      6. 7.10.6. Recent Initiatives, Funding/VC Activities, and Technological Innovations
    11. 7.11. Super Brush LLC
      1. 7.11.1. Company Overview
      2. 7.11.2. Product/Service Portfolio
      3. 7.11.3. Super Brush LLC Sales, Revenue, and Gross Margin
      4. 7.11.4. Super Brush LLC Revenue and Growth Rate
      5. 7.11.5. Super Brush LLC Market Share
      6. 7.11.6. Recent Initiatives, Funding/VC Activities, and Technological Innovations
    12. 7.12. Biosigma S.p.A
      1. 7.12.1. Company Overview
      2. 7.12.2. Product/Service Portfolio
      3. 7.12.3. Biosigma S.p.A Sales, Revenue, and Gross Margin
      4. 7.12.4. Biosigma S.p.A Revenue and Growth Rate
      5. 7.12.5. Biosigma S.p.A Market Share
      6. 7.12.6. Recent Initiatives, Funding/VC Activities, and Technological Innovations
    13. 7.13. Medical Wire and Equipment Co Ltd (MWE)
      1. 7.13.1. Company Overview
      2. 7.13.2. Product/Service Portfolio
      3. 7.13.3. Medical Wire and Equipment Co Ltd (MWE) Sales, Revenue, and Gross Margin
      4. 7.13.4. Medical Wire and Equipment Co Ltd (MWE) Revenue and Growth Rate
      5. 7.13.5. Medical Wire and Equipment Co Ltd (MWE) Market Share
      6. 7.13.6. Recent Initiatives, Funding/VC Activities, and Technological Innovations
  8. Chapter 8 Sterile Swabs — Industry Analysis
    1. 8.1. Introduction and Taxonomy
    2. 8.2. Sterile Swabs Market – Key Trends
      1. 8.2.1. Market Drivers
      2. 8.2.2. Market Restraints
      3. 8.2.3. Market Opportunities
    3. 8.3. Value Chain Analysis
    4. 8.4. Key Mandates and Regulations
    5. 8.5. Technology Roadmap and Timeline
    6. 8.6. Sterile Swabs Market – Attractiveness Analysis
      1. 8.6.1. By Type
      2. 8.6.2. By Application
      3. 8.6.3. By End-Users
      4. 8.6.4. By Region
  9. Chapter 9 Industrial Chain, Sourcing Strategy, and Downstream Buyers
    1. 9.1. Sterile Swabs Industrial Chain Analysis
    2. 9.2. Downstream Buyers
    3. 9.3. Distributors/Traders List
  10. Chapter 10 Marketing Strategy Analysis
    1. 10.1. Marketing Channel
    2. 10.2. Direct Marketing
    3. 10.3. Indirect Marketing
    4. 10.4. Marketing Channel Development Trends
    5. 10.5. Economic/Political Environmental Change
  11. Chapter 11 Report Conclusion & Key Insights
    1. 11.1. Key Insights from Primary Interviews & Surveys Respondents
    2. 11.2. Key Takeaways from Analysts, Consultants, and Industry Leaders
  12. Chapter 12 Research Approach & Methodology
    1. 12.1. Report Description
    2. 12.2. Research Scope
    3. 12.3. Research Methodology
      1. 12.3.1. Secondary Research
      2. 12.3.2. Primary Research
      3. 12.3.3. Statistical Models
        1. 12.3.3.1. Company Share Analysis Model
        2. 12.3.3.2. Revenue Based Modeling
      4. 12.3.4. Research Limitations

      List of Figures

      Fig.1	Product Picture of Sterile Swabs
      Fig.2	Global Sterile Swabs Market, 2016 – 2026 (USD Billion)
      Fig.3	Global Sterile Swabs Market Absolute Revenue Opportunity, 2016 – 2026 (USD Billion)
      Fig.4	Global Sterile Swabs Market Incremental Revenue Opportunity, 2020 – 2026 (USD Billion)
      Fig.5	Global Sterile Swabs Market Share, by Type, 2020 & 2026 (USD Billion)
      Fig.6	Global Cotton Tipped Swabs Sterile Swabs Market, 2016 – 2026 (USD Billion)
      Fig.7	Global Foam Tipped Swabs Sterile Swabs Market, 2016 – 2026 (USD Billion)
      Fig.8	Global Non-Woven Swabs Sterile Swabs Market, 2016 – 2026 (USD Billion)
      Fig.9	Global Others Sterile Swabs Market, 2016 – 2026 (USD Billion)
      Fig.10	Global Sterile Swabs Market Share, by Application, 2020 & 2026 (USD Billion)
      Fig.11	Global Specimen Collection Sterile Swabs Market, 2016 – 2026 (USD Billion)
      Fig.12	Global Disinfection Sterile Swabs Market, 2016 – 2026 (USD Billion)
      Fig.13	Global Disinfection Sterile Swabs Market, 2016 – 2026 (USD Billion)
      Fig.14	Global Others Sterile Swabs Market, 2016 – 2026 (USD Billion)
      Fig.15	Global Sterile Swabs Market Share, by End-Users, 2020 & 2026 (USD Billion)
      Fig.16	Global Hospital & Clinics Sterile Swabs Market, 2016 – 2026 (USD Billion)
      Fig.17	Global Laboratories & Diagnostics Centers Sterile Swabs Market, 2016 – 2026 (USD Billion)
      Fig.18	Global Research Institutes Sterile Swabs Market, 2016 – 2026 (USD Billion)
      Fig.19	Global Sterile Swabs Market Share, by Region, 2020 & 2026 (USD Billion)
      Fig.20	North America Sterile Swabs Market, 2016 – 2026 (USD Billion)
      Fig.21	U.S. Sterile Swabs Market, 2016 – 2026 (USD Billion)
      Fig.22	Canada Sterile Swabs Market, 2016 – 2026 (USD Billion)
      Fig.23	Europe Sterile Swabs Market, 2016 – 2026 (USD Billion)
      Fig.24	Germany Sterile Swabs Market, 2016 – 2026 (USD Billion)
      Fig.25	France Sterile Swabs Market, 2016 – 2026 (USD Billion)
      Fig.26	U.K. Sterile Swabs Market, 2016 – 2026 (USD Billion)
      Fig.27	Italy Sterile Swabs Market, 2016 – 2026 (USD Billion)
      Fig.28	Spain Sterile Swabs Market, 2016 – 2026 (USD Billion)
      Fig.29	Rest of Europe Sterile Swabs Market, 2016 – 2026 (USD Billion)
      Fig.30	Asia Pacific Sterile Swabs Market, 2016 – 2026 (USD Billion)
      Fig.31	China Sterile Swabs Market, 2016 – 2026 (USD Billion)
      Fig.32	Japan Sterile Swabs Market, 2016 – 2026 (USD Billion)
      Fig.33	India Sterile Swabs Market, 2016 – 2026 (USD Billion)
      Fig.34	South  Korea Sterile Swabs Market, 2016 – 2026 (USD Billion)
      Fig.35	South-East Asia Sterile Swabs Market, 2016 – 2026 (USD Billion)
      Fig.36	Rest of Asia Pacific Sterile Swabs Market, 2016 – 2026 (USD Billion)
      Fig.37	Latin America Sterile Swabs Market, 2016 – 2026 (USD Billion)
      Fig.38	Brazil Sterile Swabs Market, 2016 – 2026 (USD Billion)
      Fig.39	Mexico Sterile Swabs Market, 2016 – 2026 (USD Billion)
      Fig.40	Rest of Latin America Sterile Swabs Market, 2016 – 2026 (USD Billion)
      Fig.41	The Middle-East and Africa Sterile Swabs Market, 2016 – 2026 (USD Billion)
      Fig.42	GCC Countries Sterile Swabs Market, 2016 – 2026 (USD Billion)
      Fig.43	South Africa Sterile Swabs Market, 2016 – 2026 (USD Billion)
      Fig.44	Rest of Middle-East Africa Sterile Swabs Market, 2016 – 2026 (USD Billion)
      Fig.45	Competitor Market Share – Revenue
      Fig.46	Puritan Medical Products Revenue and Growth Rate
      Fig.47	Puritan Medical Products Market Share
      Fig.48	BD Revenue and Growth Rate
      Fig.49	BD Market Share
      Fig.50	3M Revenue and Growth Rate
      Fig.51	3M Market Share
      Fig.52	FL MEDICAL srl Revenue and Growth Rate
      Fig.53	FL MEDICAL srl Market Share
      Fig.54	DLS Medical Revenue and Growth Rate
      Fig.55	DLS Medical Market Share
      Fig.56	Dynarex Corporation Revenue and Growth Rate
      Fig.57	Dynarex Corporation Market Share
      Fig.58	Medtronic Revenue and Growth Rate
      Fig.59	Medtronic Market Share
      Fig.60	Advacare Pharma Revenue and Growth Rate
      Fig.61	Advacare Pharma Market Share
      Fig.62	Copan Italia S.p.A. Revenue and Growth Rate
      Fig.63	Copan Italia S.p.A. Market Share
      Fig.64	Lynn Medical Products Revenue and Growth Rate
      Fig.65	Lynn Medical Products Market Share
      Fig.66	Super Brush LLC Revenue and Growth Rate
      Fig.67	Super Brush LLC Market Share
      Fig.68	Biosigma S.p.A Revenue and Growth Rate
      Fig.69	Biosigma S.p.A Market Share
      Fig.70	Medical Wire and Equipment Co Ltd (MWE) Revenue and Growth Rate
      Fig.71	Medical Wire and Equipment Co Ltd (MWE) Market Share
      Fig.72	Market Dynamics
      Fig.73	Global Sterile Swabs – Value Chain Analysis
      Fig.74	Key Mandates and Regulations
      Fig.75	Technology Roadmap and Timeline
      Fig.76	Market Attractiveness Analysis – By Type
      Fig.77	Market Attractiveness Analysis – By Application
      Fig.78	Market Attractiveness Analysis – By End-Users
      Fig.79	Market Attractiveness Analysis – By Region
      Fig.80	Sterile Swabs Industrial Chain Analysis
      Fig.81	Market Channels
      Fig.82	Marketing Channel Development Trend
      Fig.83	Growth in World Gross Product, 2008-2018
      

      List of Tables

      Table 1	Global Sterile Swabs Market, 2020 & 2026 (USD Billion)
      Table 2	Global Sterile Swabs Market, by Type, 2016 – 2026 (USD Billion)
      Table 3	Global Sterile Swabs Market, by Application, 2016 – 2026 (USD Billion)
      Table 4	Global Sterile Swabs Market, by End-Users, 2016 – 2026 (USD Billion)
      Table 5	Global Sterile Swabs Market, by Region, 2016 – 2026 (USD Billion)
      Table 6	North America Sterile Swabs Market, by Country, 2016 – 2026 (USD Billion)
      Table 7	North America Sterile Swabs Market, by Type, 2016 – 2026 (USD Billion)
      Table 8	North America Sterile Swabs Market, by Application, 2016 – 2026 (USD Billion)
      Table 9 North America Sterile Swabs Market, by End-Users, 2016 – 2026 (USD Billion)
      Table 10 Europe Sterile Swabs Market, by Country, 2016 – 2026 (USD Billion)
      Table 11 Europe Sterile Swabs Market, by Type, 2016 – 2026 (USD Billion)
      Table 12 Europe Sterile Swabs Market, by Application, 2016 – 2026 (USD Billion)
      Table 13 Europe Sterile Swabs Market, by End-Users, 2016 – 2026 (USD Billion)
      Table 14 Asia Pacific Sterile Swabs Market, by Country, 2016 – 2026 (USD Billion)
      Table 15 Asia Pacific Sterile Swabs Market, by Type, 2016 – 2026 (USD Billion)
      Table 16 Asia Pacific Sterile Swabs Market, by Application, 2016 – 2026 (USD Billion)
      Table 17 Asia Pacific Sterile Swabs Market, by End-Users, 2016 – 2026 (USD Billion)
      Table 18 Latin America Sterile Swabs Market, by Country, 2016 – 2026 (USD Billion)
      Table 19 Latin America Sterile Swabs Market, by Type, 2016 – 2026 (USD Billion)
      Table 20 Latin America Sterile Swabs Market, by Application, 2016 – 2026 (USD Billion)
      Table 21 Latin America Sterile Swabs Market, by End-Users, 2016 – 2026 (USD Billion)
      Table 22 The Middle-East and Africa Sterile Swabs Market, by Country, 2016 – 2026 (USD Billion)
      Table 23 The Middle-East and Africa Sterile Swabs Market, by Type, 2016 – 2026 (USD Billion)
      Table 24 The Middle-East and Africa Sterile Swabs Market, by Application, 2016 – 2026 (USD Billion)
      Table 25 The Middle-East and Africa Sterile Swabs Market, by End-Users, 2016 – 2026 (USD Billion)
      Table 26 Global Sterile Swabs Market - Company Revenue Analysis, 2016 – 2019 (USD Billion)
      Table 27 Global Sterile Swabs Market - Company Revenue Share Analysis, 2016 – 2019 (%)
      Table 28 Acquisitions and Mergers
      Table 29 Market Drivers – Impact Analysis
      Table 30 Market Restraints
      Table 31 Market Opportunities
      Table 32 Major Buyers of Sterile Swabs
      Table 33 Distributors/Traders of Sterile Swabs by Region
      

Industry Major Market Players

  • Puritan Medical Products
  • BD
  • 3M
  • FL MEDICAL srl
  • DLS Medical
  • Dynarex Corporation
  • Medtronic
  • Advacare Pharma
  • Copan Italia S.p.A.
  • Lynn Medical
  • Super Brush LLC
  • Biosigma S.p.A
  • Medical Wire and Equipment Co Ltd (MWE)