Search Market Research Report

Discover Our Latest Reports
Discover Our Featured Reports
Discover Top Selling Reports

Steam Turbine For Power Generation Market Size, Share Global Analysis Report, 2020–2026

report img

Steam Turbine For Power Generation Market By Fuel (Gas, Coal, Nuclear, and Others), Capacity (< 120 MW, 121 MW -350 MW, 351 MW -750 MW, and > 750 MW) and By Application (Energy & Power, Industrial, Petrochemical, Transport, and Others): Global Industry Outlook, Market Size, Business Intelligence, Consumer Preferences, Statistical Surveys, Comprehensive Analysis, Historical Developments, Current Trends, and Forecast 2020–2026

Industry Insights

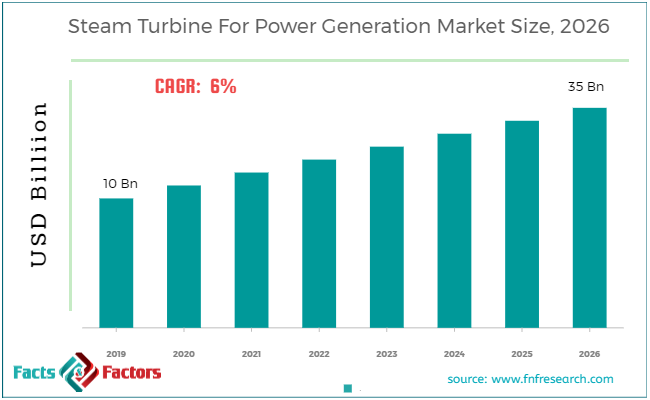
According to the report published by Facts & Factors, the global Steam Turbine For Power Generation market size was worth around USD 10 billion in 2019 and is predicted to grow to around USD 35 billion by 2026 with a compound annual growth rate (CAGR) of roughly 6% between 2020 and 2026. The report analyzes the global Steam Turbine For Power Generation market drivers, restraints/challenges, and the effect they have on the demands during the projection period. In addition, the report explores emerging opportunities in the Steam Turbine For Power Generation market.

This specialized and expertise oriented industry research report scrutinizes the technical and commercial business outlook of the Steam Turbine For Power Generation market. The report analyzes and declares the historical and current trends analysis of the Steam Turbine For the Power Generation industry and subsequently recommends the projected trends anticipated to be observed in the Steam Turbine For Power Generation market during the upcoming years.

Steam Turbine For Power Generation Market

To know more about this report | Request Free Sample Copy

The Steam Turbine For Power Generation market report analyzes and notifies the industry statistics at the global as well as regional and country levels in order to acquire a thorough perspective of the entire team Turbine For Power Generation market. The historical and past insights are provided for FY 2016 to FY 2019 whereas projected trends are delivered for FY 2020 to FY 2026. The quantitative and numerical data is represented in terms of both volume (K Units) and value (USD Million) from FY 2016 – 2026.

logoKey Insights from Primary Research

  • As per the response from our primary respondent, the Steam Turbine for Power Generation market is expected to grow at CAGR of around 6%.
  • The revenue generated by the market was valued at around USD 35 Billion.
  • The category of “Coal”, on the basis of Fuel segmentation, has the maximum share as compared with other fuel types.
  • The category of “121 MW -350 MW”, on the capacity segmentation, has the lead in the revenue generation.
  • The category of “Energy & Power”, on the basis of application segmentation, leads the market and shares the maximum revenue generated.

logoKey Recommendations from Analysts

  • As per our analysts, steam engines which are an integral part of thermal power plants as they are operated across the world are undergoing changes and accepting clean sources like fuel cells, natural gas, and renewable energy for reducing the environmental pollution caused by the coal-burning.
  • European countries like Germany are installing combined heat &power(CHP) technology that produces heat and electrical power from gas at the same time which also serves as a source of direct power, electricity, and heat.
  • The high rate of industrialization going in the developing countries of the Asia Pacific region creates an opportunity for CHP in these countries.
  • Steam Turbine for Power Generation market is heading towards consolidation and the key players are focusing mainly on acquisitions and mergers.
  • Growing at a CAGR of around 6%, Steam Turbine for Power Generation market provides numerous opportunities for all of the involved stakeholders across the entire value chain.
  • Our analysts have identified the “Nuclear” and “consumer durables” categories as the leading investment pocketSteam Turbine for Power Generation market in terms of Fuel type segmentation.

The quantitative data is further underlined and reinforced by comprehensive qualitative data which comprises various across-the-board market dynamics. The rationales which directly or indirectly impact the Steam Turbine ForPower Generation industry are exemplified through parameters such as growth drivers, restraints, challenges, and opportunities among other impacting factors.

Throughout our research report, we have encompassed all the proven models and tools of industry analysis and extensively illustrated all the key business strategies and business models adopted in the Steam Turbine For the Power Generation industry. The report provides an all-inclusive and detailed competitive landscape prevalent in the Steam Turbine For Power Generation market.

The report utilizes established industry analysis tools and models such as Porter’s Five Forces framework to analyze and recognize critical business strategies adopted by various stakeholders involved in the entire value chain of the Steam Turbine For Power Generation industry. The Steam Turbine For Power Generation market report additionally employs SWOT analysis and PESTLE analysis models for further in-depth analysis.

The report study further includes an in-depth analysis of industry players' market shares and provides an overview of leading players' market position in the Steam Turbine For Power Generation sector. Key strategic developments in the Steam Turbine For Power Generation market competitive landscape such as acquisitions & mergers, inaugurations of different products and services, partnerships & joint ventures, MoU agreements, VC & funding activities, R&D activities, and geographic expansion among other noteworthy activities by key players of the Steam Turbine For Power Generation market are appropriately highlighted in the report.

Steam turbines are used for the conversion of thermal energy into mechanical energy and utilize high pressure and high temperature. Coal is the primary fuel that is used in powering these steam turbine plants but due to its hazardous effects on the environment, many developed countries are replacing coal power plants with cleaner options such as gas power, nuclear power, renewable sources, etc. About 90% of the electricity that is generated across the world comes from the steam turbine.

There are multiple types of fuels available that can be used in powering these steam engines out of which coal is used on a large scale as it is less expensive and easily available. But as burning coal leads to various environmental problems, many countries are replacing coal burning with other clean sources like natural gas burning, renewable energy, and fuel cells. These steam turbines are in huge demand in developing countries as there is a demand for continuous energy supply for housing and industrial purposes.

logoReport Scope

Report Attribute

Details

Market Size in 2019

USD 10 Billion

Projected Market Size in 2026

USD 35 Billion

CAGR Growth Rate

6% CAGR

Base Year

2019

Forecast Years

2020-2026

Key Market Players

Alstom, Siemens AG, General Electric Company, Mitsubishi Hitachi Power Systems, Bharat Heavy Electricals Limited, Elliott Group, MAN Diesel & Turbo, Dongfang Turbine Company Limited, and others.

Key Segment

By Fuel, Capacity, Application, and Region

Major Regions Covered

North America, Europe, Asia Pacific, Latin America, and the Middle East &, Africa

Purchase Options

Request customized purchase options to meet your research needs. Explore purchase options

logoRegional Overview:

The Steam Turbine For Power Generation market research report delivers an acute valuation and taxonomy of the Steam Turbine For Power Generation industry by practically splitting the market on the basis of different types, applications, and regions. Through the analysis of the historical and projected trends, all the segments and sub-segments were evaluated through the bottom-up approach, and different market sizes have been projected for FY 2020 to FY 2026.

The regional segmentation of the Steam Turbine For the Power Generation industry includes the complete classification of all the major continents including North America, Latin America, Europe, Asia Pacific, and Middle East & Africa. Further, country-wise data for the Steam Turbine For the Power Generation industry is provided for the leading economies of the world.

The Steam Turbine For Power Generation market is segmented based on Fuel, Capacity, and Application.  On the basis of Fuel segmentation, the market is classified into Gas, Coal, Nuclear, and Others. On the basis of Capacity segmentation, the market is divided into < 120 MW, 121 MW -350 MW, 351 MW -750 MW, and > 750 MW. In terms of Application segmentation, the market is bifurcated into Energy & Power, Industrial, Petrochemical, Transport, and Others.

logoSome of the essential players operating in the Steam Turbine For Power Generation market, but not restricted include:

  • Alstom
  • Siemens AG
  • General Electric Company
  • Mitsubishi Hitachi Power Systems
  • Bharat Heavy Electricals Limited
  • Elliott Group
  • MAN Diesel & Turbo
  • Dongfang Turbine Company Limited

The taxonomy of the Steam Turbine For Power Generation Market by its scope and segmentation is as follows:

logo By Fuel Segmentation Analysis (Customizable)

  • Gas
  • Coal
  • Nuclear
  • Others

logo By Capacity Segmentation Analysis (Customizable)

  • < 120 MW
  • 121 MW -350 MW
  • 351 MW -750 MW
  • > 750 MW

logo By Application Segmentation Analysis (Customizable)

  • Energy & Power
  • Industrial
  • Petrochemical
  • Transport
  • Others

logo By Regional Segmentation Analysis (Customizable)

  • North America
    • The U.S.
    • Canada
  • Europe
    • Germany
    • The UK
    • France
    • Spain
    • Italy
    • Rest of Europe
  • Asia Pacific
    • China
    • Japan
    • India
    • South Korea
    • Southeast Asia
    • Rest of Asia Pacific
  • Latin America
    • Brazil
    • Mexico
    • Rest of Latin America
  • Middle East & Africa
    • GCC
    • South Africa
    • Rest of the Middle East & Africa

Table of Content

  1. CHAPTER 1. Executive Summary
  2. CHAPTER 2. Steam Turbine Market For Power Generation market – Fuel Analysis
    1. 2.1. Global Steam Turbine Market For Power Generation Market – Fuel Overview
    2. 2.2. Global Steam Turbine Market For Power Generation Market Share, by Fuel, 2018 & 2025 (USD Million)
    3. 2.3. Global Steam Turbine Market For Power Generation Market share, by Fuel, 2018 & 2025 (K Units)
    4. 2.4. Gas
      1. 2.4.1. Global Gas Steam Turbine Market For Power Generation Market, 2016-2026 (USD Million)
      2. 2.4.2. Global Gas Steam Turbine Market For Power Generation Market, 2016-2026 (K Units)
    5. 2.5. Coal
      1. 2.5.1. Global Coal Steam Turbine Market For Power Generation Market, 2016-2026 (USD Million)
      2. 2.5.2. Global Coal Steam Turbine Market For Power Generation Market, 2016-2026 (K Units)
    6. 2.6. Nuclear
      1. 2.6.1. Global Nuclear Steam Turbine Market For Power Generation Market, 2016-2026 (USD Million)
      2. 2.6.2. Global Nuclear Steam Turbine Market For Power Generation Market, 2016-2026 (K Units)
    7. 2.7. Others
      1. 2.7.1. Global Others Steam Turbine Market For Power Generation Market, 2016-2026 (USD Million)
      2. 2.7.2. Global Others Steam Turbine Market For Power Generation Market, 2016-2026 (K Units)
  3. CHAPTER 3. Steam Turbine Market For Power Generation market – Capacity Analysis
    1. 3.1. Global Steam Turbine Market For Power Generation Market – Capacity Overview
    2. 3.2. Global Steam Turbine Market For Power Generation Market Share, by Capacity, 2018 & 2025 (USD Million)
    3. 3.3. Global Steam Turbine Market For Power Generation Market share, by Capacity, 2018 & 2025 (K Units)
    4. 3.4. < 120 MW
      1. 3.4.1. Global < 120 MW Steam Turbine Market For Power Generation Market, 2016-2026 (USD Million)
      2. 3.4.2. Global < 120 MW Steam Turbine Market For Power Generation Market, 2016-2026 (K Units)
    5. 3.5. 121 MW -350 MW
      1. 3.5.1. Global 121 MW -350 MW Steam Turbine Market For Power Generation Market, 2016-2026 (USD Million)
      2. 3.5.2. Global 121 MW -350 MW Steam Turbine Market For Power Generation Market, 2016-2026 (K Units)
    6. 3.6. 351 MW -750 MW
      1. 3.6.1. Global 351 MW -750 MW Steam Turbine Market For Power Generation Market, 2016-2026 (USD Million)
      2. 3.6.2. Global 351 MW -750 MW Steam Turbine Market For Power Generation Market, 2016-2026 (K Units)
    7. 3.7. > 750 MW
      1. 3.7.1. Global > 750 MW Steam Turbine Market For Power Generation Market, 2016-2026 (USD Million)
      2. 3.7.2. Global > 750 MW Steam Turbine Market For Power Generation Market, 2016-2026 (K Units)
  4. CHAPTER 4. Steam Turbine Market For Power Generation market – Application Analysis
    1. 4.1. Global Steam Turbine Market For Power Generation Market – Application Overview
    2. 4.2. Global Steam Turbine Market For Power Generation Market Share, by Application, 2018 & 2025 (USD Million)
    3. 4.3. Global Steam Turbine Market For Power Generation Market share, by Application, 2018 & 2025 (K Units)
    4. 4.4. Energy & Power
      1. 4.4.1. Global Energy & Power Steam Turbine Market For Power Generation Market, 2016-2026 (USD Million)
      2. 4.4.2. Global Energy & Power Steam Turbine Market For Power Generation Market, 2016-2026 (K Units)
    5. 4.5. Industrial
      1. 4.5.1. Global Industrial Steam Turbine Market For Power Generation Market, 2016-2026 (USD Million)
      2. 4.5.2. Global Industrial Steam Turbine Market For Power Generation Market, 2016-2026 (K Units)
    6. 4.6. Petrochemical
      1. 4.6.1. Global Petrochemical Steam Turbine Market For Power Generation Market, 2016-2026 (USD Million)
      2. 4.6.2. Global Petrochemical Steam Turbine Market For Power Generation Market, 2016-2026 (K Units)
    7. 4.7. Transport
      1. 4.7.1. Global Transport Steam Turbine Market For Power Generation Market, 2016-2026 (USD Million)
      2. 4.7.2. Global Transport Steam Turbine Market For Power Generation Market, 2016-2026 (K Units)
    8. 4.8. Others
      1. 4.8.1. Global Others Steam Turbine Market For Power Generation Market, 2016-2026 (USD Million)
      2. 4.8.2. Global Others Steam Turbine Market For Power Generation Market, 2016-2026 (K Units)
  5. CHAPTER 5. Steam Turbine Market For Power Generation market – Regional Analysis
    1. 5.1. Global Steam Turbine Market For Power Generation Market Regional Overview
    2. 5.2. Global Steam Turbine Market For Power Generation Market Share, by Region, 2018 & 2025 (Value)
    3. 5.3. Global Steam Turbine Market For Power Generation Market Share, by Region, 2018 & 2025 (Volume)
    4. 5.4. North America
      1. 5.4.1. North America Steam Turbine Market For Power Generation Market size and forecast, 2016-2026
      2. 5.4.2. North America Steam Turbine Market For Power Generation Market, by Country, 2018 - 2025 (USD Million)
      3. 5.4.3. North America Market size and forecast, 2016-2026 (K Units)
      4. 5.4.4. North America Steam Turbine Market For Power Generation Market, by Country, 2018 - 2025 (K Units)
      5. 5.4.5. North America Steam Turbine Market For Power Generation Market, by Fuel, 2016-2026
        1. 5.4.5.1. North America Steam Turbine Market For Power Generation Market, by Fuel, 2016-2026 (USD Million)
        2. 5.4.5.2. North America Steam Turbine Market For Power Generation Market, by Fuel, 2016-2026 (K Units)
      6. 5.4.6. North America Steam Turbine Market For Power Generation Market, by Capacity, 2016-2026
        1. 5.4.6.1. North America Steam Turbine Market For Power Generation Market, by Capacity, 2016-2026 (USD Million)
        2. 5.4.6.2. North America Steam Turbine Market For Power Generation Market, by Capacity, 2016-2026 (K Units)
      7. 5.4.7. North America Steam Turbine Market For Power Generation Market, by Application, 2016-2026
        1. 5.4.7.1. North America Steam Turbine Market For Power Generation Market, by Application, 2016-2026 (USD Million)
        2. 5.4.7.2. North America Steam Turbine Market For Power Generation Market, by Application, 2016-2026 (K Units)
      8. 5.4.8. U.S.
        1. 5.4.8.1. U.S. Market size and forecast, 2016-2026 (USD Million)
        2. 5.4.8.2. U.S. Market size and forecast, 2016-2026 (K Units)
      9. 5.4.9. Canada
        1. 5.4.9.1. Canada Market size and forecast, 2016-2026 (USD Million)
        2. 5.4.9.2. Canada Market size and forecast, 2016-2026 (K Units)
    5. 5.5. Europe
      1. 5.5.1. Europe Steam Turbine Market For Power Generation Market size and forecast, 2016-2026
      2. 5.5.2. Europe Steam Turbine Market For Power Generation Market, by Country, 2018 - 2025 (USD Million)
      3. 5.5.3. Europe Market size and forecast, 2016-2026 (K Units)
      4. 5.5.4. Europe Steam Turbine Market For Power Generation Market, by Country, 2018 - 2025 (K Units)
      5. 5.5.5. Europe Steam Turbine Market For Power Generation Market, by Fuel, 2016-2026
        1. 5.5.5.1. Europe Steam Turbine Market For Power Generation Market, by Fuel, 2016-2026 (USD Million)
        2. 5.5.5.2. Europe Steam Turbine Market For Power Generation Market, by Fuel, 2016-2026 (K Units)
      6. 5.5.6. Europe Steam Turbine Market For Power Generation Market, by Capacity, 2016-2026
        1. 5.5.6.1. Europe Steam Turbine Market For Power Generation Market, by Capacity, 2016-2026 (USD Million)
        2. 5.5.6.2. Europe Steam Turbine Market For Power Generation Market, by Capacity, 2016-2026 (K Units)
      7. 5.5.7. Europe Steam Turbine Market For Power Generation Market, by Application, 2016-2026
        1. 5.5.7.1. Europe Steam Turbine Market For Power Generation Market, by Application, 2016-2026 (USD Million)
        2. 5.5.7.2. Europe Steam Turbine Market For Power Generation Market, by Application, 2016-2026 (K Units)
      8. 5.5.8. Germany
        1. 5.5.8.1. Germany Market size and forecast, 2016-2026 (USD Million)
        2. 5.5.8.2. Germany Market size and forecast, 2016-2026 (K Units)
      9. 5.5.9. France
        1. 5.5.9.1. France Market size and forecast, 2016-2026 (USD Million)
        2. 5.5.9.2. France Market size and forecast, 2016-2026 (K Units)
      10. 5.5.10. U.K.
        1. 5.5.10.1. U.K. Market size and forecast, 2016-2026 (USD Million)
        2. 5.5.10.2. U.K. Market size and forecast, 2016-2026 (K Units)
      11. 5.5.11. Italy
        1. 5.5.11.1. Italy Market size and forecast, 2016-2026 (USD Million)
        2. 5.5.11.2. Italy Market size and forecast, 2016-2026 (K Units)
      12. 5.5.12. Spain
        1. 5.5.12.1. Spain Market size and forecast, 2016-2026 (USD Million)
        2. 5.5.12.2. Spain Market size and forecast, 2016-2026 (K Units)
      13. 5.5.13. Rest of Europe
        1. 5.5.13.1. Rest of Europe Market size and forecast, 2016-2026 (USD Million)
        2. 5.5.13.2. Rest of Europe Market size and forecast, 2016-2026 (K Units)
    6. 5.6. Asia Pacific
      1. 5.6.1. Asia Pacific Steam Turbine Market For Power Generation Market size and forecast, 2016-2026
      2. 5.6.2. Asia Pacific Steam Turbine Market For Power Generation Market, by Country, 2018 - 2025 (USD Million)
      3. 5.6.3. Asia Pacific Market size and forecast, 2016-2026 (K Units)
      4. 5.6.4. Asia Pacific Steam Turbine Market For Power Generation Market, by Country, 2018 - 2025 (K Units)
      5. 5.6.5. Asia Pacific Steam Turbine Market For Power Generation Market, by Fuel, 2016-2026
        1. 5.6.5.1. Asia Pacific Steam Turbine Market For Power Generation Market, by Fuel, 2016-2026 (USD Million)
        2. 5.6.5.2. Asia Pacific Steam Turbine Market For Power Generation Market, by Fuel, 2016-2026 (K Units)
      6. 5.6.6. Asia Pacific Steam Turbine Market For Power Generation Market, by Capacity, 2016-2026
        1. 5.6.6.1. Asia Pacific Steam Turbine Market For Power Generation Market, by Capacity, 2016-2026 (USD Million)
        2. 5.6.6.2. Asia Pacific Steam Turbine Market For Power Generation Market, by Capacity, 2016-2026 (K Units)
      7. 5.6.7. Asia Pacific Steam Turbine Market For Power Generation Market, by Application, 2016-2026
        1. 5.6.7.1. Asia Pacific Steam Turbine Market For Power Generation Market, by Application, 2016-2026 (USD Million)
        2. 5.6.7.2. Asia Pacific Steam Turbine Market For Power Generation Market, by Application, 2016-2026 (K Units)
      8. 5.6.8. China
        1. 5.6.8.1. China Market size and forecast, 2016-2026 (USD Million)
        2. 5.6.8.2. China Market size and forecast, 2016-2026 (K Units)
      9. 5.6.9. Japan
        1. 5.6.9.1. Japan Market size and forecast, 2016-2026 (USD Million)
        2. 5.6.9.2. Japan Market size and forecast, 2016-2026 (K Units)
      10. 5.6.10. India
        1. 5.6.10.1. India Market size and forecast, 2016-2026 (USD Million)
        2. 5.6.10.2. India Market size and forecast, 2016-2026 (K Units)
      11. 5.6.11. South Korea
        1. 5.6.11.1. South Korea Market size and forecast, 2016-2026 (USD Million)
        2. 5.6.11.2. South Korea Market size and forecast, 2016-2026 (K Units)
      12. 5.6.12. South-East Asia
        1. 5.6.12.1. South-East Asia Market size and forecast, 2016-2026 (USD Million)
        2. 5.6.12.2. South-East Asia Market size and forecast, 2016-2026 (K Units)
      13. 5.6.13. Rest of Asia Pacific
        1. 5.6.13.1. Rest of Asia Pacific Market size and forecast, 2016-2026 (USD Million)
        2. 5.6.13.2. Rest of Asia Pacific Market size and forecast, 2016-2026 (K Units)
    7. 5.7. Latin America
      1. 5.7.1. Latin America Steam Turbine Market For Power Generation Market size and forecast, 2016-2026
      2. 5.7.2. Latin America Steam Turbine Market For Power Generation Market, by Country, 2018 - 2025 (USD Million)
      3. 5.7.3. Latin America Market size and forecast, 2016-2026 (K Units)
      4. 5.7.4. Latin America Steam Turbine Market For Power Generation Market, by Country, 2018 - 2025 (K Units)
      5. 5.7.5. Latin America Steam Turbine Market For Power Generation Market, by Fuel, 2016-2026
        1. 5.7.5.1. Latin America Steam Turbine Market For Power Generation Market, by Fuel, 2016-2026 (USD Million)
        2. 5.7.5.2. Latin America Steam Turbine Market For Power Generation Market, by Fuel, 2016-2026 (K Units)
      6. 5.7.6. Latin America Steam Turbine Market For Power Generation Market, by Capacity, 2016-2026
        1. 5.7.6.1. Latin America Steam Turbine Market For Power Generation Market, by Capacity, 2016-2026 (USD Million)
        2. 5.7.6.2. Latin America Steam Turbine Market For Power Generation Market, by Capacity, 2016-2026 (K Units)
      7. 5.7.7. Latin America Steam Turbine Market For Power Generation Market, by Application, 2016-2026
        1. 5.7.7.1. Latin America Steam Turbine Market For Power Generation Market, by Application, 2016-2026 (USD Million)
        2. 5.7.7.2. Latin America Steam Turbine Market For Power Generation Market, by Application, 2016-2026 (K Units)
      8. 5.7.8. Brazil
        1. 5.7.8.1. Brazil Market size and forecast, 2016-2026 (USD Million)
        2. 5.7.8.2. Brazil Market size and forecast, 2016-2026 (K Units)
      9. 5.7.9. Mexico
        1. 5.7.9.1. Mexico Market size and forecast, 2016-2026 (USD Million)
        2. 5.7.9.2. Mexico Market size and forecast, 2016-2026 (K Units)
      10. 5.7.10. Rest of Latin America
        1. 5.7.10.1. Rest of Latin America Market size and forecast, 2016-2026 (USD Million)
        2. 5.7.10.2. Rest of Latin America Market size and forecast, 2016-2026 (K Units)
    8. 5.8. The Middle-East and Africa
      1. 5.8.1. The Middle-East and Africa Steam Turbine Market For Power Generation Market size and forecast, 2016-2026
      2. 5.8.2. The Middle-East and Africa Steam Turbine Market For Power Generation Market, by Country, 2018 - 2025 (USD Million)
      3. 5.8.3. The Middle-East and Africa Market size and forecast, 2016-2026 (K Units)
      4. 5.8.4. The Middle-East and Africa Steam Turbine Market For Power Generation Market, by Country, 2018 - 2025 (K Units)
      5. 5.8.5. The Middle-East and Africa Steam Turbine Market For Power Generation Market, by Fuel, 2016-2026
        1. 5.8.5.1. The Middle-East and Africa Steam Turbine Market For Power Generation Market, by Fuel, 2016-2026 (USD Million)
        2. 5.8.5.2. The Middle-East and Africa Steam Turbine Market For Power Generation Market, by Fuel, 2016-2026 (K Units)
      6. 5.8.6. The Middle-East and Africa Steam Turbine Market For Power Generation Market, by Capacity, 2016-2026
        1. 5.8.6.1. The Middle-East and Africa Steam Turbine Market For Power Generation Market, by Capacity, 2016-2026 (USD Million)
        2. 5.8.6.2. The Middle-East and Africa Steam Turbine Market For Power Generation Market, by Capacity, 2016-2026 (K Units)
      7. 5.8.7. The Middle-East and Africa Steam Turbine Market For Power Generation Market, by Application, 2016-2026
        1. 5.8.7.1. The Middle-East and Africa Steam Turbine Market For Power Generation Market, by Application, 2016-2026 (USD Million)
        2. 5.8.7.2. The Middle-East and Africa Steam Turbine Market For Power Generation Market, by Application, 2016-2026 (K Units)
      8. 5.8.8. GCC Countries
        1. 5.8.8.1. GCC Countries Market size and forecast, 2016-2026 (USD Million)
        2. 5.8.8.2. GCC Countries Market size and forecast, 2016-2026 (K Units)
      9. 5.8.9. South Africa
        1. 5.8.9.1. South Africa Market size and forecast, 2016-2026 (USD Million)
        2. 5.8.9.2. South Africa Market size and forecast, 2016-2026 (K Units)
      10. 5.8.10. Rest of Middle-East Africa
        1. 5.8.10.1. Rest of Middle-East Africa Market size and forecast, 2016-2026 (USD Million)
        2. 5.8.10.2. Rest of Middle-East Africa Market size and forecast, 2016-2026 (K Units)
  6. CHAPTER 6. Steam Turbine Market For Power Generation Production, Consumption, Export, Import by Regions
    1. 6.1. Global Steam Turbine Market For Power Generation production and revenue, 2015-2025 (USD Million) (K Units)
    2. 6.2. Global Import and Export Analysis, by Region
  7. CHAPTER 7. Steam Turbine Market For Power Generation market – Competitive Landscape
    1. 7.1. Competitor Market Share – Revenue
    2. 7.2. Market Concentration Rate Analysis, Top 3 and Top 5 Players
    3. 7.3. Competitor Market Share – Volume
    4. 7.4. Strategic Development
      1. 7.4.1. Acquisitions and Mergers
      2. 7.4.2. New Products
      3. 7.4.3. Research & Development Activities
  8. CHAPTER 8. Company Profiles
    1. 8.1. Alstom
      1. 8.1.1. Company Overview
      2. 8.1.2. Alstom Sales, Revenue, Price, and Gross Margin
      3. 8.1.3. Product portfolio
      4. 8.1.4. Recent initiatives
    2. 8.2. Siemens AG
      1. 8.2.1. Company Overview
      2. 8.2.2. Siemens AG Sales, Revenue, Price, and Gross Margin
      3. 8.2.3. Product portfolio
      4. 8.2.4. Recent initiatives
    3. 8.3. General Electric Company
      1. 8.3.1. Company Overview
      2. 8.3.2. General Electric Company Sales, Revenue, Price, and Gross Margin
      3. 8.3.3. Product portfolio
      4. 8.3.4. Recent initiatives
    4. 8.4. Mitsubishi Hitachi Power Systems
      1. 8.4.1. Company Overview
      2. 8.4.2. Mitsubishi Hitachi Power Systems Sales, Revenue, Price, and Gross Margin
      3. 8.4.3. Product portfolio
      4. 8.4.4. Recent initiatives
    5. 8.5. Bharat Heavy Electricals Limited
      1. 8.5.1. Company Overview
      2. 8.5.2. Bharat Heavy Electricals Limited Sales, Revenue, Price, and Gross Margin
      3. 8.5.3. Product portfolio
      4. 8.5.4. Recent initiatives
    6. 8.6. Elliott Group
      1. 8.6.1. Company Overview
      2. 8.6.2. Elliott Group Sales, Revenue, Price, and Gross Margin
      3. 8.6.3. Product portfolio
      4. 8.6.4. Recent initiatives
    7. 8.7. MAN Diesel & Turbo
      1. 8.7.1. Company Overview
      2. 8.7.2. MAN Diesel & Turbo Sales, Revenue, Price, and Gross Margin
      3. 8.7.3. Product portfolio
      4. 8.7.4. Recent initiatives
    8. 8.8. Dongfang Turbine Company Limited
      1. 8.8.1. Company Overview
      2. 8.8.2. Dongfang Turbine Company Limited Sales, Revenue, Price, and Gross Margin
      3. 8.8.3. Product portfolio
      4. 8.8.4. Recent initiatives
    9. 8.9. Others
      1. 8.9.1. Company Overview
      2. 8.9.2. Others Sales, Revenue, Price, and Gross Margin
      3. 8.9.3. Product portfolio
      4. 8.9.4. Recent initiatives
  9. CHAPTER 9. Steam Turbine Market For Power Generation — Industry Analysis
    1. 9.1. Introduction and Taxonomy
    2. 9.2. Steam Turbine Market For Power Generation Market – Key Trends
      1. 9.2.1. Market Drivers
      2. 9.2.2. Market Restraints
      3. 9.2.3. Market Opportunities
    3. 9.3. Value Chain Analysis
    4. 9.4. Key Mandates and Regulations
    5. 9.5. Technology Roadmap and Timeline
    6. 9.6. Steam Turbine Market For Power Generation market – Attractiveness Analysis
      1. 9.6.1. By Fuel
      2. 9.6.2. By Capacity
      3. 9.6.3. By Application
      4. 9.6.4. By Region
  10. CHAPTER 10. Raw Material analysis
    1. 10.1. Steam Turbine Market For Power Generation Key Raw Material Analysis
      1. 10.1.1. Key Raw Materials
      2. 10.1.2. Price Trend of Key Raw Materials
    2. 10.2. Key Suppliers of Raw Materials
    3. 10.3. Proportion of Manufacturing Cost Structure
      1. 10.3.1. Raw Materials
      2. 10.3.2. Labor Cost
    4. 10.4. Manufacturing Expenses Analysis of Steam Turbine Market For Power Generation
  11. CHAPTER 11. Industrial Chain, Sourcing Strategy and Downstream Buyers
    1. 11.1. Steam Turbine Market For Power Generation Industrial Chain Analysis
    2. 11.2. Upstream Raw Materials Sourcing
      1. 11.2.1. Risk Mitigation:
      2. 11.2.2. Supplier Relationships:
      3. 11.2.3. Business Processes:
      4. 11.2.4. Securing the Product:
    3. 11.3. Raw Materials Sources of Steam Turbine Market For Power Generation Major Manufacturers in 2016
    4. 11.4. Downstream Buyers
    5. 11.5. Distributors/Traders List
  12. CHAPTER 12. Marketing Strategy Analysis, Distributors
    1. 12.1. Marketing Channel
    2. 12.2. Direct Marketing
    3. 12.3. Indirect Marketing
    4. 12.4. Marketing Channel Development Trend
    5. 12.5. Economic/Political Environmental Change
  13. CHAPTER 13. Report Conclusion
  14. CHAPTER 14. Research Approach & Methodology
    1. 14.1. Report Description
    2. 14.2. Research Scope
    3. 14.3. Research Methodology
      1. 14.3.1. Secondary Research
      2. 14.3.2. Primary Research
      3. 14.3.3. Models
        1. 14.3.3.1. Company Share Analysis Model
        2. 14.3.3.2. Revenue Based Modeling
        3. 14.3.3.3. Research Limitations

        List of Figures

        FIG. 1 Global Steam Turbine Market For Power Generation Market, 2016-2026 (USD Million)
        FIG. 2 Global Steam Turbine Market For Power Generation Market Share, by Fuel, 2018 & 2025 (USD Million)
        FIG. 3 Global Steam Turbine Market For Power Generation Market share, by Fuel, 2018 & 2025 (K Units)
        FIG. 4 Global Gas Steam Turbine Market For Power Generation Market, 2016-2026 (USD Million)
        FIG. 5 Global Gas Steam Turbine Market For Power Generation  Market, 2016-2026 (K Units)
        FIG. 6 Global Coal Steam Turbine Market For Power Generation Market, 2016-2026 (USD Million)
        FIG. 7 Global Coal Steam Turbine Market For Power Generation  Market, 2016-2026 (K Units)
        FIG. 8 Global Nuclear Steam Turbine Market For Power Generation Market, 2016-2026 (USD Million)
        FIG. 9 Global Nuclear Steam Turbine Market For Power Generation  Market, 2016-2026 (K Units)
        FIG. 10 Global Others Steam Turbine Market For Power Generation Market, 2016-2026 (USD Million)
        FIG. 11 Global Others Steam Turbine Market For Power Generation  Market, 2016-2026 (K Units)
        FIG. 12 Global Steam Turbine Market For Power Generation Market Share, by Capacity, 2018 & 2025 (USD Million)
        FIG. 13 Global Steam Turbine Market For Power Generation Market share, by Capacity, 2018 & 2025 (K Units)
        FIG. 14 Global < 120 MW Steam Turbine Market For Power Generation Market, 2016-2026 (USD Million)
        FIG. 15 Global < 120 MW Steam Turbine Market For Power Generation  Market, 2016-2026 (K Units)
        FIG. 16 Global 121 MW -350 MW Steam Turbine Market For Power Generation Market, 2016-2026 (USD Million)
        FIG. 17 Global 121 MW -350 MW Steam Turbine Market For Power Generation  Market, 2016-2026 (K Units)
        FIG. 18 Global 351 MW -750 MW Steam Turbine Market For Power Generation Market, 2016-2026 (USD Million)
        FIG. 19 Global 351 MW -750 MW Steam Turbine Market For Power Generation  Market, 2016-2026 (K Units)
        FIG. 20 Global > 750 MW Steam Turbine Market For Power Generation Market, 2016-2026 (USD Million)
        FIG. 21 Global > 750 MW Steam Turbine Market For Power Generation  Market, 2016-2026 (K Units)
        FIG. 22 Global Steam Turbine Market For Power Generation Market Share, by Application, 2018 & 2025 (USD Million)
        FIG. 23 Global Steam Turbine Market For Power Generation Market share, by Application, 2018 & 2025 (K Units)
        FIG. 24 Global Energy & Power Steam Turbine Market For Power Generation Market, 2016-2026 (USD Million)
        FIG. 25 Global Energy & Power Steam Turbine Market For Power Generation  Market, 2016-2026 (K Units)
        FIG. 26 Global Industrial Steam Turbine Market For Power Generation Market, 2016-2026 (USD Million)
        FIG. 27 Global Industrial Steam Turbine Market For Power Generation  Market, 2016-2026 (K Units)
        FIG. 28 Global Petrochemical Steam Turbine Market For Power Generation Market, 2016-2026 (USD Million)
        FIG. 29 Global Petrochemical Steam Turbine Market For Power Generation  Market, 2016-2026 (K Units)
        FIG. 30 Global Transport Steam Turbine Market For Power Generation Market, 2016-2026 (USD Million)
        FIG. 31 Global Transport Steam Turbine Market For Power Generation  Market, 2016-2026 (K Units)
        FIG. 32 Global Others Steam Turbine Market For Power Generation Market, 2016-2026 (USD Million)
        FIG. 33 Global Others Steam Turbine Market For Power Generation  Market, 2016-2026 (K Units)
        FIG. 34 Global Steam Turbine Market For Power Generation Market Share, by Region, 2018 & 2025
        FIG. 35 Global Steam Turbine Market For Power Generation Market Share, by Region, 2018 & 2025
        FIG. 36 North America Steam Turbine Market For Power Generation Market, 2016-2026
        FIG. 37 North America Steam Turbine Market For Power Generation  Market, 2016-2026 (K Units)
        FIG. 38 U.S. Steam Turbine Market For Power Generation Market, 2016-2026
        FIG. 39 U.S. Steam Turbine Market For Power Generation  Market, 2016-2026 (K Units)
        FIG. 40 Canada Steam Turbine Market For Power Generation Market, 2016-2026
        FIG. 41 Canada Steam Turbine Market For Power Generation  Market, 2016-2026 (K Units)
        FIG. 42 Europe Steam Turbine Market For Power Generation Market, 2016-2026
        FIG. 43 Europe Steam Turbine Market For Power Generation  Market, 2016-2026 (K Units)
        FIG. 44 Germany Steam Turbine Market For Power Generation Market, 2016-2026
        FIG. 45 Germany Steam Turbine Market For Power Generation  Market, 2016-2026 (K Units)
        FIG. 46 France Steam Turbine Market For Power Generation Market, 2016-2026
        FIG. 47 France Steam Turbine Market For Power Generation  Market, 2016-2026 (K Units)
        FIG. 48 U.K. Steam Turbine Market For Power Generation Market, 2016-2026
        FIG. 49 U.K. Steam Turbine Market For Power Generation  Market, 2016-2026 (K Units)
        FIG. 50 Italy Steam Turbine Market For Power Generation Market, 2016-2026
        FIG. 51 Italy Steam Turbine Market For Power Generation  Market, 2016-2026 (K Units)
        FIG. 52 Spain Steam Turbine Market For Power Generation Market, 2016-2026
        FIG. 53 Spain Steam Turbine Market For Power Generation  Market, 2016-2026 (K Units)
        FIG. 54 Rest of Europe Steam Turbine Market For Power Generation Market, 2016-2026
        FIG. 55 Rest of Europe Steam Turbine Market For Power Generation  Market, 2016-2026 (K Units)
        FIG. 56 Asia Pacific Steam Turbine Market For Power Generation Market, 2016-2026
        FIG. 57 Asia Pacific Steam Turbine Market For Power Generation  Market, 2016-2026 (K Units)
        FIG. 58 China Steam Turbine Market For Power Generation Market, 2016-2026
        FIG. 59 China Steam Turbine Market For Power Generation  Market, 2016-2026 (K Units)
        FIG. 60 Japan Steam Turbine Market For Power Generation Market, 2016-2026
        FIG. 61 Japan Steam Turbine Market For Power Generation  Market, 2016-2026 (K Units)
        FIG. 62 India Steam Turbine Market For Power Generation Market, 2016-2026
        FIG. 63 India Steam Turbine Market For Power Generation  Market, 2016-2026 (K Units)
        FIG. 64 South  Korea Steam Turbine Market For Power Generation Market, 2016-2026
        FIG. 65 South  Korea Steam Turbine Market For Power Generation  Market, 2016-2026 (K Units)
        FIG. 66 South-East Asia Steam Turbine Market For Power Generation Market, 2016-2026
        FIG. 67 South-East Asia Steam Turbine Market For Power Generation  Market, 2016-2026 (K Units)
        FIG. 68 Rest of Asia Pacific Steam Turbine Market For Power Generation Market, 2016-2026
        FIG. 69 Rest of Asia Pacific Steam Turbine Market For Power Generation  Market, 2016-2026 (K Units)
        FIG. 70 Latin America Steam Turbine Market For Power Generation Market, 2016-2026
        FIG. 71 Latin America Steam Turbine Market For Power Generation  Market, 2016-2026 (K Units)
        FIG. 72 Brazil Steam Turbine Market For Power Generation Market, 2016-2026
        FIG. 73 Brazil Steam Turbine Market For Power Generation  Market, 2016-2026 (K Units)
        FIG. 74 Mexico Steam Turbine Market For Power Generation Market, 2016-2026
        FIG. 75 Mexico Steam Turbine Market For Power Generation  Market, 2016-2026 (K Units)
        FIG. 76 Rest of Latin America Steam Turbine Market For Power Generation Market, 2016-2026
        FIG. 77 Rest of Latin America Steam Turbine Market For Power Generation  Market, 2016-2026 (K Units)
        FIG. 78 The Middle-East and Africa Steam Turbine Market For Power Generation Market, 2016-2026
        FIG. 79 The Middle-East and Africa Steam Turbine Market For Power Generation  Market, 2016-2026 (K Units)
        FIG. 80 GCC Countries Steam Turbine Market For Power Generation Market, 2016-2026
        FIG. 81 GCC Countries Steam Turbine Market For Power Generation  Market, 2016-2026 (K Units)
        FIG. 82 South Africa Steam Turbine Market For Power Generation Market, 2016-2026
        FIG. 83 South Africa Steam Turbine Market For Power Generation  Market, 2016-2026 (K Units)
        FIG. 84 Rest of Middle-East Africa Steam Turbine Market For Power Generation Market, 2016-2026
        FIG. 85 Rest of Middle-East Africa Steam Turbine Market For Power Generation  Market, 2016-2026 (K Units)
        FIG. 86 Global Steam Turbine Market For Power Generation production and revenue, 2015-2025 (USD Million) (K Units)
        FIG. 87 North America Steam Turbine Market For Power Generation production and revenue, 2015-2025 (USD Million) (K Units)
        FIG. 88 Europe Steam Turbine Market For Power Generation production and revenue, 2015-2025 (USD Million) (K Units)
        FIG. 89 Asia Pacific Steam Turbine Market For Power Generation production and revenue, 2015-2025 (USD Million) (K Units)
        FIG. 90 Latin America Steam Turbine Market For Power Generation production and revenue, 2015-2025 (USD Million) (K Units)
        FIG. 91 Middle East and Africa Steam Turbine Market For Power Generation production and revenue, 2015-2025 (USD Million) (K Units)
        FIG. 92 Competitor Market Share – Revenue
        FIG. 93 Competitor Market Share – Volume
        FIG. 94 Alstom Revenue and Growth Rate
        FIG. 95 Alstom Market Share
        FIG. 96 Siemens AG Revenue and Growth Rate
        FIG. 97 Siemens AG Market Share
        FIG. 98 General Electric Company Revenue and Growth Rate
        FIG. 99 General Electric Company Market Share
        FIG. 100 Mitsubishi Hitachi Power Systems Revenue and Growth Rate
        FIG. 101 Mitsubishi Hitachi Power Systems Market Share
        FIG. 102 Bharat Heavy Electricals Limited Revenue and Growth Rate
        FIG. 103 Bharat Heavy Electricals Limited Market Share
        FIG. 104 Elliott Group Revenue and Growth Rate
        FIG. 105 Elliott Group Market Share
        FIG. 106 MAN Diesel & Turbo Revenue and Growth Rate
        FIG. 107 MAN Diesel & Turbo Market Share
        FIG. 108 Dongfang Turbine Company Limited Revenue and Growth Rate
        FIG. 109 Dongfang Turbine Company Limited Market Share
        FIG. 110 Others Revenue and Growth Rate
        FIG. 111 Others Market Share
        FIG. 112 Market Dynamics
        FIG. 113 Global Steam Turbine Market For Power Generation – Value Chain Analysis
        FIG. 114 Key Mandates and Regulations
        FIG. 115 Technology Roadmap and Timeline
        FIG. 116 Market Attractiveness Analysis – By Fuel
        FIG. 117 Market Attractiveness Analysis – By Capacity
        FIG. 118 Market Attractiveness Analysis – By Application
        FIG. 119 Market Attractiveness Analysis – By Region
        FIG. 120 Manufacturing Cost Structure of Steam Turbine Market For Power Generation
        FIG. 121 Steam Turbine Market For Power Generation Industrial Chain Analysis
        FIG. 122 Market Channel
        FIG. 123 Marketing Channel Development Trend
        FIG. 124 Growth in World Gross Product, 2008-2018

        List of Tables

        TABLE 1 Global Steam Turbine Market For Power Generation market, 2018 & 2025 (USD Million)
        TABLE 2 Global Steam Turbine Market For Power Generation market, by Fuel, 2016-2026 (USD Million)
        TABLE 3 Global Steam Turbine Market For Power Generation market, by Fuel, 2016-2026 (K Units)
        TABLE 4 Global Steam Turbine Market For Power Generation market, by Capacity, 2016-2026 (USD Million)
        TABLE 5 Global Steam Turbine Market For Power Generation market, by Capacity, 2016-2026 (K Units)
        TABLE 6 Global Steam Turbine Market For Power Generation market, by Application, 2016-2026 (USD Million)
        TABLE 7 Global Steam Turbine Market For Power Generation market, by Application, 2016-2026 (K Units)
        TABLE 8 Global Steam Turbine Market For Power Generation market, by region, 2016-2026 (USD Million)
        TABLE 9 Global Steam Turbine Market For Power Generation market, by region, 2016-2026 (K Units)
        TABLE 10 North America Steam Turbine Market For Power Generation Market, by Fuel, 2016-2026 (USD Million)
        TABLE 11 North America Steam Turbine Market For Power Generation Market, by Fuel, 2016-2026 (K Units)
        TABLE 12 North America Steam Turbine Market For Power Generation Market, by Capacity, 2016-2026 (USD Million)
        TABLE 13 North America Steam Turbine Market For Power Generation Market, by Capacity, 2016-2026 (K Units)
        TABLE 14 North America Steam Turbine Market For Power Generation Market, by Application, 2016-2026 (USD Million)
        TABLE 15 North America Steam Turbine Market For Power Generation Market, by Application, 2016-2026 (K Units)
        TABLE 16 Europe Steam Turbine Market For Power Generation Market, by Fuel, 2016-2026 (USD Million)
        TABLE 17 Europe Steam Turbine Market For Power Generation Market, by Fuel, 2016-2026 (K Units)
        TABLE 18 Europe Steam Turbine Market For Power Generation Market, by Capacity, 2016-2026 (USD Million)
        TABLE 19 Europe Steam Turbine Market For Power Generation Market, by Capacity, 2016-2026 (K Units)
        TABLE 20 Europe Steam Turbine Market For Power Generation Market, by Application, 2016-2026 (USD Million)
        TABLE 21 Europe Steam Turbine Market For Power Generation Market, by Application, 2016-2026 (K Units)
        TABLE 22 Asia Pacific Steam Turbine Market For Power Generation Market, by Fuel, 2016-2026 (USD Million)
        TABLE 23 Asia Pacific Steam Turbine Market For Power Generation Market, by Fuel, 2016-2026 (K Units)
        TABLE 24 Asia Pacific Steam Turbine Market For Power Generation Market, by Capacity, 2016-2026 (USD Million)
        TABLE 25 Asia Pacific Steam Turbine Market For Power Generation Market, by Capacity, 2016-2026 (K Units)
        TABLE 26 Asia Pacific Steam Turbine Market For Power Generation Market, by Application, 2016-2026 (USD Million)
        TABLE 27 Asia Pacific Steam Turbine Market For Power Generation Market, by Application, 2016-2026 (K Units)
        TABLE 28 Latin America Steam Turbine Market For Power Generation Market, by Fuel, 2016-2026 (USD Million)
        TABLE 29 Latin America Steam Turbine Market For Power Generation Market, by Fuel, 2016-2026 (K Units)
        TABLE 30 Latin America Steam Turbine Market For Power Generation Market, by Capacity, 2016-2026 (USD Million)
        TABLE 31 Latin America Steam Turbine Market For Power Generation Market, by Capacity, 2016-2026 (K Units)
        TABLE 32 Latin America Steam Turbine Market For Power Generation Market, by Application, 2016-2026 (USD Million)
        TABLE 33 Latin America Steam Turbine Market For Power Generation Market, by Application, 2016-2026 (K Units)
        TABLE 34 The Middle-East and Africa Steam Turbine Market For Power Generation Market, by Fuel, 2016-2026 (USD Million)
        TABLE 35 The Middle-East and Africa Steam Turbine Market For Power Generation Market, by Fuel, 2016-2026 (K Units)
        TABLE 36 The Middle-East and Africa Steam Turbine Market For Power Generation Market, by Capacity, 2016-2026 (USD Million)
        TABLE 37 The Middle-East and Africa Steam Turbine Market For Power Generation Market, by Capacity, 2016-2026 (K Units)
        TABLE 38 The Middle-East and Africa Steam Turbine Market For Power Generation Market, by Application, 2016-2026 (USD Million)
        TABLE 39 The Middle-East and Africa Steam Turbine Market For Power Generation Market, by Application, 2016-2026 (K Units)
        TABLE 40 North America Steam Turbine Market For Power Generation Production, Consumption, Export, Import, 2016-2019
        TABLE 41 Europe Steam Turbine Market For Power Generation Production, Consumption, Export, Import, 2016-2019
        TABLE 42 Asia Pacific Steam Turbine Market For Power Generation Production, Consumption, Export, Import, 2016-2019
        TABLE 43 Latin America Steam Turbine Market For Power Generation Production, Consumption, Export, Import, 2016-2019
        TABLE 44 Middle East & Africa Steam Turbine Market For Power Generation Production, Consumption, Export, Import, 2016-2019
        TABLE 45 Global Steam Turbine Market For Power Generation Market - Company Revenue Analysis 2016-2019 (USD Million)
        TABLE 46 Global Steam Turbine Market For Power Generation Market - Company Revenue Share Analysis 2016-2019(%)
        TABLE 47 Global Steam Turbine Market For Power Generation Market - Company Volume Analysis 2016-2019 (K Units)
        TABLE 48 Global Steam Turbine Market For Power Generation Market - Company Volume Share Analysis 2016-2019(%)
        TABLE 49 Acquisitions and Mergers
        TABLE 50 New Product/Service Launch
        TABLE 51 Research & Development Activities
        TABLE 52 Market Drivers
        TABLE 53 Market Restraints
        TABLE 54 Market Opportunities
        TABLE 55 Production Base and Market Concentration Rate of Raw Material
        TABLE 56 Key Suppliers of Raw Materials
        TABLE 57 Raw Materials Sources of Steam Turbine Market For Power Generation Major Manufacturers in 2016
        TABLE 58 Major Buyers of Steam Turbine Market For Power Generation
        TABLE 59 Distributors/Traders of Steam Turbine Market For Power Generation by Region

Industry Major Market Players

  • Alstom
  • Siemens AG
  • General Electric Company
  • Mitsubishi Hitachi Power Systems
  • Bharat Heavy Electricals Limited
  • Elliott Group
  • MAN Diesel & Turbo
  • Dongfang Turbine Company Limited