![]()
Search Market Research Report
Spend Analytics Market Size, Share Global Analysis Report, 2026-2034

Spend Analytics Market Size, Share, Growth Analysis Report By Type (Software and Services), By Application (Cost Reduction, Supplier Management, Risk Management, Compliance Management, Strategic Sourcing, and Others), By End-User (BFSI, Retail & E-commerce, Manufacturing, Healthcare, Government, and Others), and By Region - Global Industry Insights, Overview, Comprehensive Analysis, Trends, Statistical Research, Market Intelligence, Historical Data and Forecast 2026-2034
Industry Insights
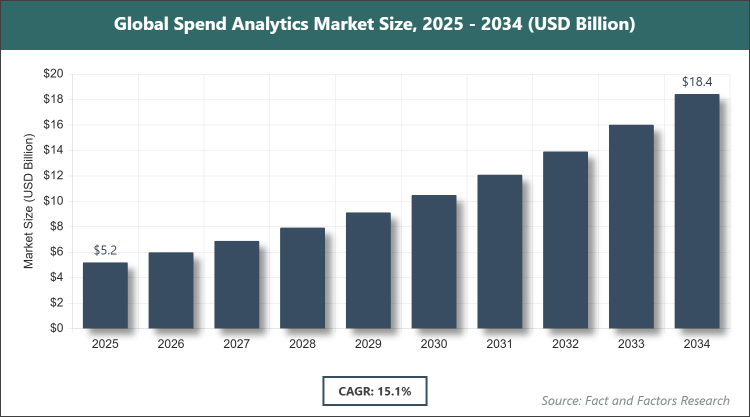
[229 + Pages Report] According to Facts & Factors, the global Spend Analytics market size was estimated at USD 5.2 billion in 2025 and is expected to reach USD 18.5 billion by the end of 2034. The Spend Analytics industry is anticipated to grow by a CAGR of 15.1% between 2026 and 2034. The Spend Analytics Market is driven by accelerating procurement digitization, rising pressure for cost optimization, and the need for real-time spend visibility across global enterprises.
 Market Overview
The Spend Analytics market encompasses advanced software platforms, services, and analytical tools that collect, cleanse, classify, enrich, and analyze an organization’s procurement and expense data from multiple sources to deliver actionable insights on spending patterns, supplier performance, cost-saving opportunities, compliance risks, and strategic sourcing decisions. These solutions leverage artificial intelligence, machine learning, natural language processing, and visualization dashboards to transform fragmented spend data into strategic intelligence, enabling CFOs, procurement leaders, and category managers to reduce maverick spending, negotiate better contracts, mitigate supplier risks, and align procurement with broader business objectives in a transparent and data-driven manner.
Key Insights
- As per the analysis shared by our research analyst, the Spend Analytics market is estimated to grow annually at a CAGR of around 15.1% over the forecast period (2026-2034).
- In terms of revenue, the Spend Analytics market size was valued at around USD 5.2 billion in 2025 and is projected to reach USD 18.5 billion by 2034.
- The Spend Analytics Market is driven by procurement digitization and demand for real-time cost optimization.
- Based on the Type, the Software segment dominated the market in 2025 with a share of 71% due to the rising adoption of cloud-based AI-powered platforms that deliver continuous spend visibility and automated insights.
- Based on the Application, the Cost Reduction segment dominated the market in 2025 with a share of 42%, owing to intense pressure on enterprises to identify and capture savings opportunities in a high-inflation environment.
- Based on the End-User, the Manufacturing segment dominated the market in 2025 with a share of 29% because of complex global supply chains and high indirect spend volumes requiring sophisticated category and supplier analytics.
- North America dominated the global Spend Analytics market in 2025 with a share of 38% attributed to early technology adoption, presence of major solution providers, and strong focus on procurement transformation among large enterprises.
Growth Drivers
- Procurement Digitization and Cost Pressure
Enterprises are rapidly moving from manual spreadsheets to AI-driven platforms to gain complete spend visibility, eliminate maverick buying, and unlock 5-15% savings across direct and indirect categories.
Integration of spend analytics with source-to-pay suites and ERP systems has created closed-loop processes that directly link insights to execution, driving higher ROI and wider adoption.
Restraints
- Data Quality and Integration Challenges
Fragmented legacy systems and poor data hygiene across ERP, P2P, and supplier portals make accurate classification and enrichment difficult, delaying value realization for many organizations.
High implementation costs and the need for specialized change management deter small and mid-sized enterprises from adopting advanced spend analytics solutions.
Opportunities
- AI/ML and Predictive Capabilities
Next-generation platforms using machine learning for predictive spend forecasting, anomaly detection, and automated supplier risk scoring are creating high-margin opportunities in strategic procurement.
Expansion into ESG spend analytics, diversity supplier tracking, and carbon-footprint measurement is opening new use cases for sustainability-focused organizations.
Challenges
- Talent Shortage and Change Management
Shortage of professionals skilled in both procurement domain knowledge and advanced analytics limits effective utilization and slows enterprise-wide adoption.
Frequent organizational changes and resistance to a data-driven decision-making culture continue to hinder full value capture from spend analytics investments.
Report Scope
Report Attribute |
Details |
Market Size 2025 |
USD 5.2 Billion |
Projected Market Size in 2034 |
USD 18.5 Billion |
CAGR Growth Rate |
15.1% CAGR |
Base Year |
2025 |
Forecast Years |
2026-2034 |
Key Market Players |
SAP SE, Oracle Corporation, Coupa Software, Jaggaer, Ivalua, GEP, Zycus, Sievo, Emptoris (IBM), Procurify, and Others. |
Key Segment |
By Type, By Application, By End-User, and By Region |
Major Regions Covered |
North America, Europe, Asia Pacific, Latin America, and the Middle East & Africa |
Purchase Options |
Request customized purchase options to meet your research needs. Explore purchase options |
Market Segmentation
The Spend Analytics market is segmented by type, application, end-user, and region.
Based on Type Segment, the Spend Analytics market is divided into software and services. The most dominant segment is Software, followed by Services. Software dominates because cloud-based AI platforms provide continuous, automated spend visibility and classification at scale, delivering immediate ROI through dashboards and alerts that drive higher adoption rates and recurring subscription revenue, which in turn funds further innovation in predictive modules and accelerates overall market expansion across enterprises of all sizes.
Based on Application Segment, the Spend Analytics market is divided into cost reduction, supplier management, risk management, compliance management, strategic sourcing, and others. The most dominant segment is Cost Reduction, followed by Supplier Management. Cost Reduction leads the segment because organizations in every industry face constant pressure to lower the total cost of ownership, making spend visibility and savings identification the highest-priority use case that generates the largest immediate business impact and encourages investment in complementary applications such as supplier and risk analytics.
Based on End-User Segment, the Spend Analytics market is divided into BFSI, retail & e-commerce, manufacturing, healthcare, government, and others. The most dominant segment is Manufacturing, followed by Retail & E-commerce. Manufacturing dominates because of its complex global supply chains, high indirect spend, and critical need for category-level visibility and supplier risk management, creating the largest and most consistent demand volume that stimulates the development of industry-specific analytics modules and drives sustained market revenue growth.
Recent Developments
- In February 2025, SAP Ariba launched AI-powered autonomous spend classification with 98% accuracy, adopted by several Fortune 500 manufacturers.
- In May 2025, Coupa Software introduced the ESG Spend Intelligence module, enabling real-time carbon and diversity tracking for enterprise customers.
- In August 2025, Jaggaer expanded its predictive analytics suite with generative AI for automated sourcing recommendations.
- In October 2025, Ivalua announced a major contract with a leading European bank for integrated risk and compliance spend analytics.
- In January 2026, GEP SMART released a new real-time anomaly detection engine, reducing maverick spend by up to 22% for early adopters.
Regional Analysis
- North America to dominate the global market
North America leads the Spend Analytics market through the highest concentration of large enterprises with mature procurement functions, early adoption of cloud-based AI solutions, substantial technology investment budgets, and strong regulatory focus on cost control and compliance. The region benefits from the presence of global solution providers, advanced data infrastructure, and a culture of data-driven decision-making across CFO and CPO offices. The United States dominates within North America with its massive corporate spend base, leadership in SaaS procurement technology, and concentration of Fortune 500 companies that treat spend analytics as a core strategic capability.
Europe exhibits robust and compliance-driven growth in the Spend Analytics market, supported by strict procurement regulations, ESG reporting requirements, and increasing focus on sustainable sourcing across manufacturing and retail sectors. The region leads in multilingual and multi-currency analytics capabilities. The United Kingdom and Germany dominate within Europe through their advanced digital procurement ecosystems and central role in driving adoption across pan-European corporations.
Asia Pacific is the fastest-growing region in the Spend Analytics market, fueled by the rapid digital transformation of procurement in China, India, Japan, and Southeast Asia, expanding manufacturing and retail sectors, and government initiatives promoting supply-chain transparency. China dominates within Asia Pacific with its enormous manufacturing base, state-driven digital economy policies, and rapid adoption of cloud spend analytics by both domestic conglomerates and multinational subsidiaries.
Latin America shows accelerating uptake in the Spend Analytics market driven by economic recovery, modernization of procurement functions in large corporates, and rising focus on cost control and supplier diversification. Brazil and Mexico dominate through their sizable manufacturing and retail industries, and increasing investment in digital procurement tools.
The Middle East & Africa region demonstrates emerging growth in the Spend Analytics market, supported by diversification initiatives, large infrastructure projects, and the need for transparent spend management in government and oil & gas sectors. The United Arab Emirates dominates within the region through its smart-government programs and leadership in adopting advanced analytics for public and private procurement.
Competitive Analysis
The global Spend Analytics market is dominated by players:
- SAP SE
- Oracle Corporation
- Coupa Software
- Jaggaer
- Ivalua
- GEP
- Zycus
- Sievo
- Emptoris (IBM)
- Procurify
The global Spend Analytics market is segmented as follows:
By Type
- Software
- Services
By Application
- Cost Reduction
- Supplier Management
- Risk Management
- Compliance Management
- Strategic Sourcing
- Others
By End-User
- BFSI
- Retail & E-commerce
- Manufacturing
- Healthcare
- Government
- Others
By Region
- North America
- The U.S.
- Canada
- Mexico
- Europe
- France
- The UK
- Spain
- Germany
- Italy
- Rest of Europe
- Asia Pacific
- China
- Japan
- India
- Australia
- Southeast Asia
- Rest of Asia Pacific
- The Middle East & Africa
- Saudi Arabia
- UAE
- Egypt
- Kuwait
- South Africa
- Rest of the Middle East & Africa
- Latin America
- Brazil
- Argentina
- Rest of Latin America
Table of Content
Industry Major Market Players
- SAP SE
- Oracle Corporation
- Coupa Software
- Jaggaer
- Ivalua
- GEP
- Zycus
- Sievo
- Emptoris (IBM)
- Procurify


Copyright © 2025 - 2026, All Rights Reserved, Facts and Factors